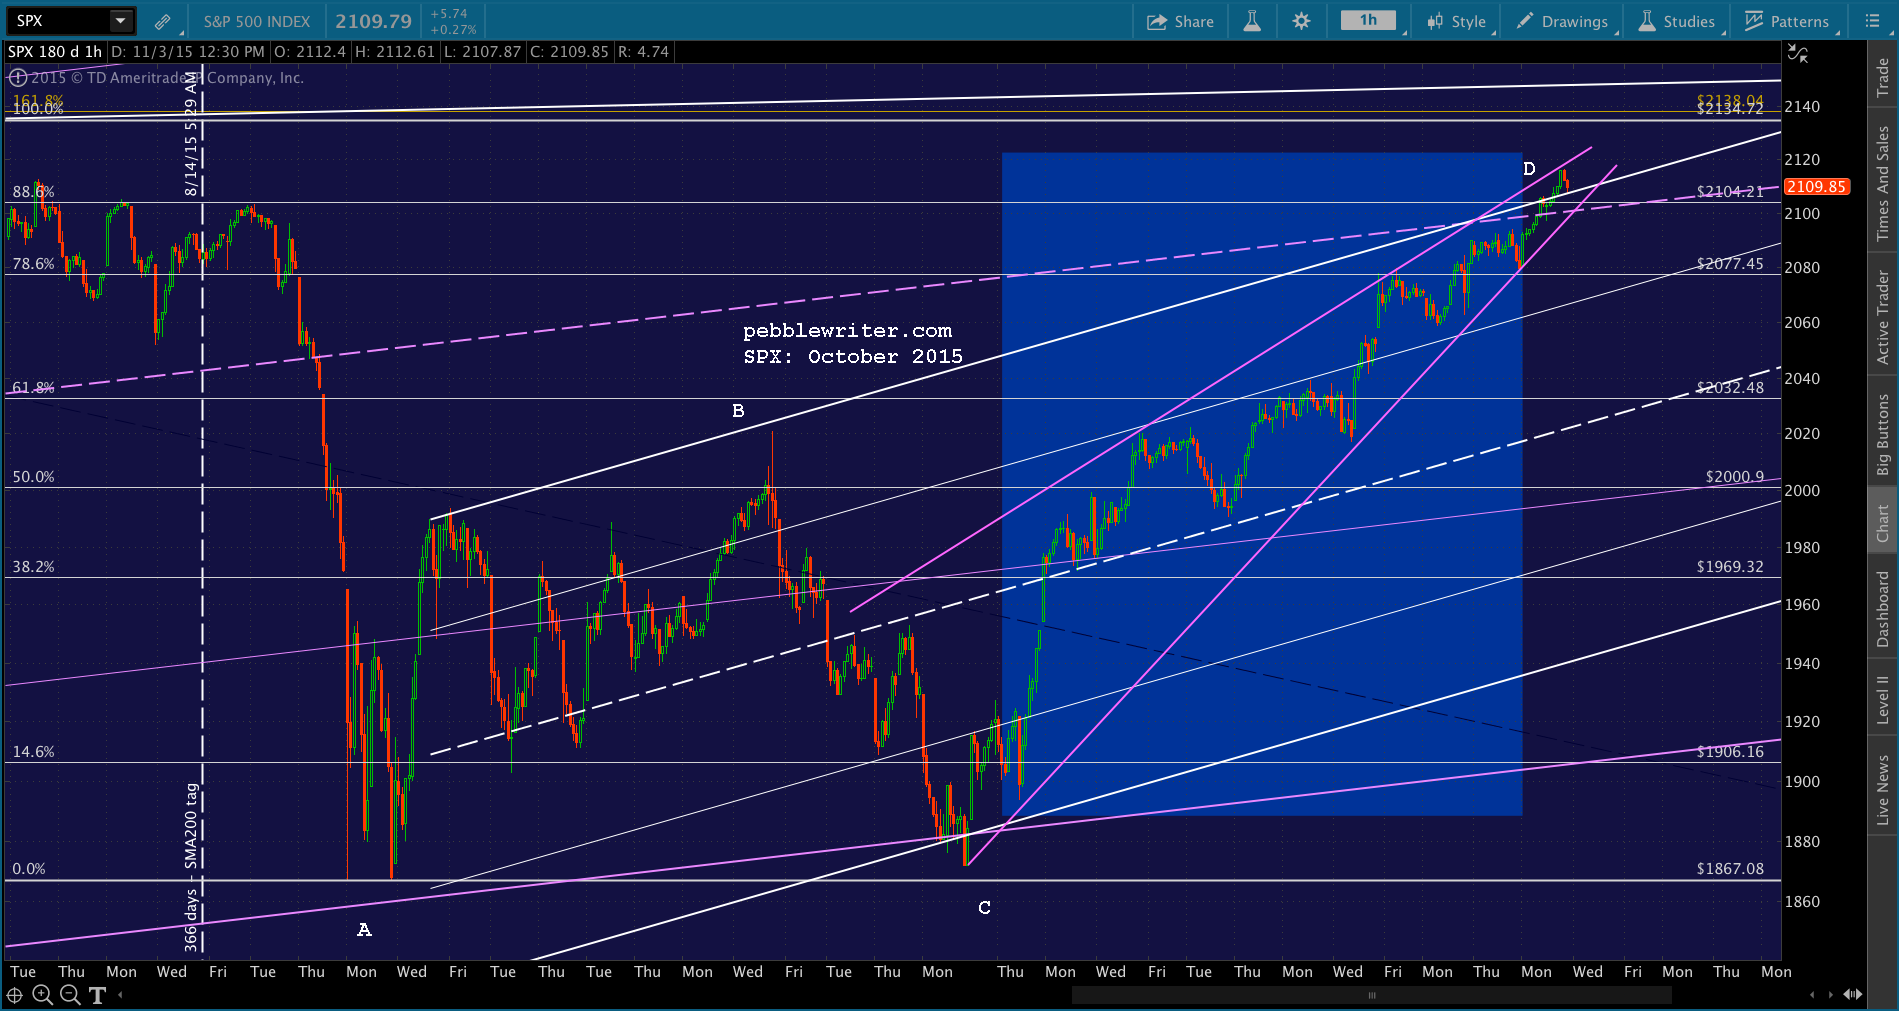
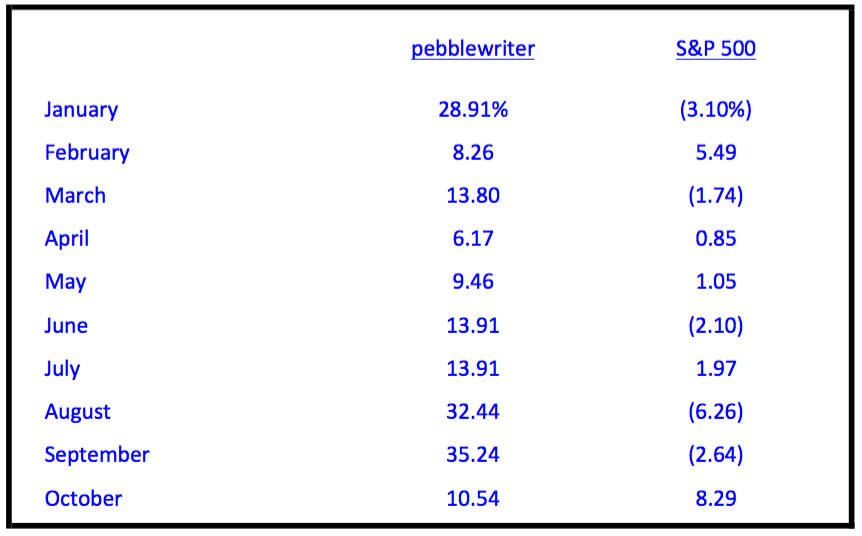
I’m going to do something a little different today. Since SPX is stuck between the .886 Fib retracement (of the May-Aug correction) and the 2134 all-time high, it’s a lousy day to trade using harmonics. But, it’s a great day to recap the past month which, in my opinion, speaks volumes about how manipulated the “markets” are.
I have no inside knowledge of the intricate mechanisms by which this manipulation takes place. My knowledge is based upon staring at multiple monitors all day long for the past 4 years, watching the moves in currencies and futures that force SPX in one direction or the other. I’ve amassed a very good track record in forecasting those moves, which suggests that my understanding is fairly accurate.
What They Did
We’ll start with a daily ES chart. By all rights, it should have reversed several times since its Sep 29 lows. Traditionally, we’d see significant reversals at important Fib levels, channel lines and key moving averages. The biggest Fib reversal during that period was a 32-pt (1.5%) backtest of the .500 Fib between Oct 13-14. It didn’t even reach the next lower Fib level. No other Fib reversal topped even 1%. The lack of any significant Fib reversals is highly unusual.
In terms of moving averages, there was a 23-pt reversal at the 100-day moving average (SMA100), and that’s about it. ES had no trouble knifing through the SMA10, SMA20, SMA50 and, most recently, the SMA200. This is also highly unusual.
The channel that captured ES’ decline between May and Aug was not a thing of beauty. There was a great channel until about 2000 on Aug 21. At that point, ES fell through the bottom. This necessitated widening the channel to the ugly one shown above.
Regardless of how you draw the bottom, however, the top is pretty clear. It’s formed by connecting the Jul 20 and Aug 18 tops. And, this is key.
On Oct 22, when ES reached the top of the falling channel, it also reached the SMA200 (thick red line.) By all rights, there should have been a significant reaction there — potentially very significant.
ES had plummeted when it plunged below the SMA200 back on Aug 20 (by 11.6% — the biggest since the 2011 mini-crash.) Yet no reaction when it finally clawed its way back to the SMA200? Again, highly unusual. Are you noticing a trend, yet?
How They Did It
 The yen carry trade has been the most important determinant of market direction and magnitude since USDJPY bottomed out in 2011. Whenever SPX needed to break through key resistance or propping up in the midst of a correction, USDJPY’s rallies provided the needed assistance.
Yet, as the chart below shows, USDJPY has been stuck at the .618 Fib (120.11) since last December. This represents the 61.8% retracement of the drop from 147 in 1998 to 75 in 2011.
Ever since USDJPY reached 120.11, the investors holding trillions of dollars tied to the yen carry trade have been hyper-focused on USDJPY. Would it break higher or reverse?
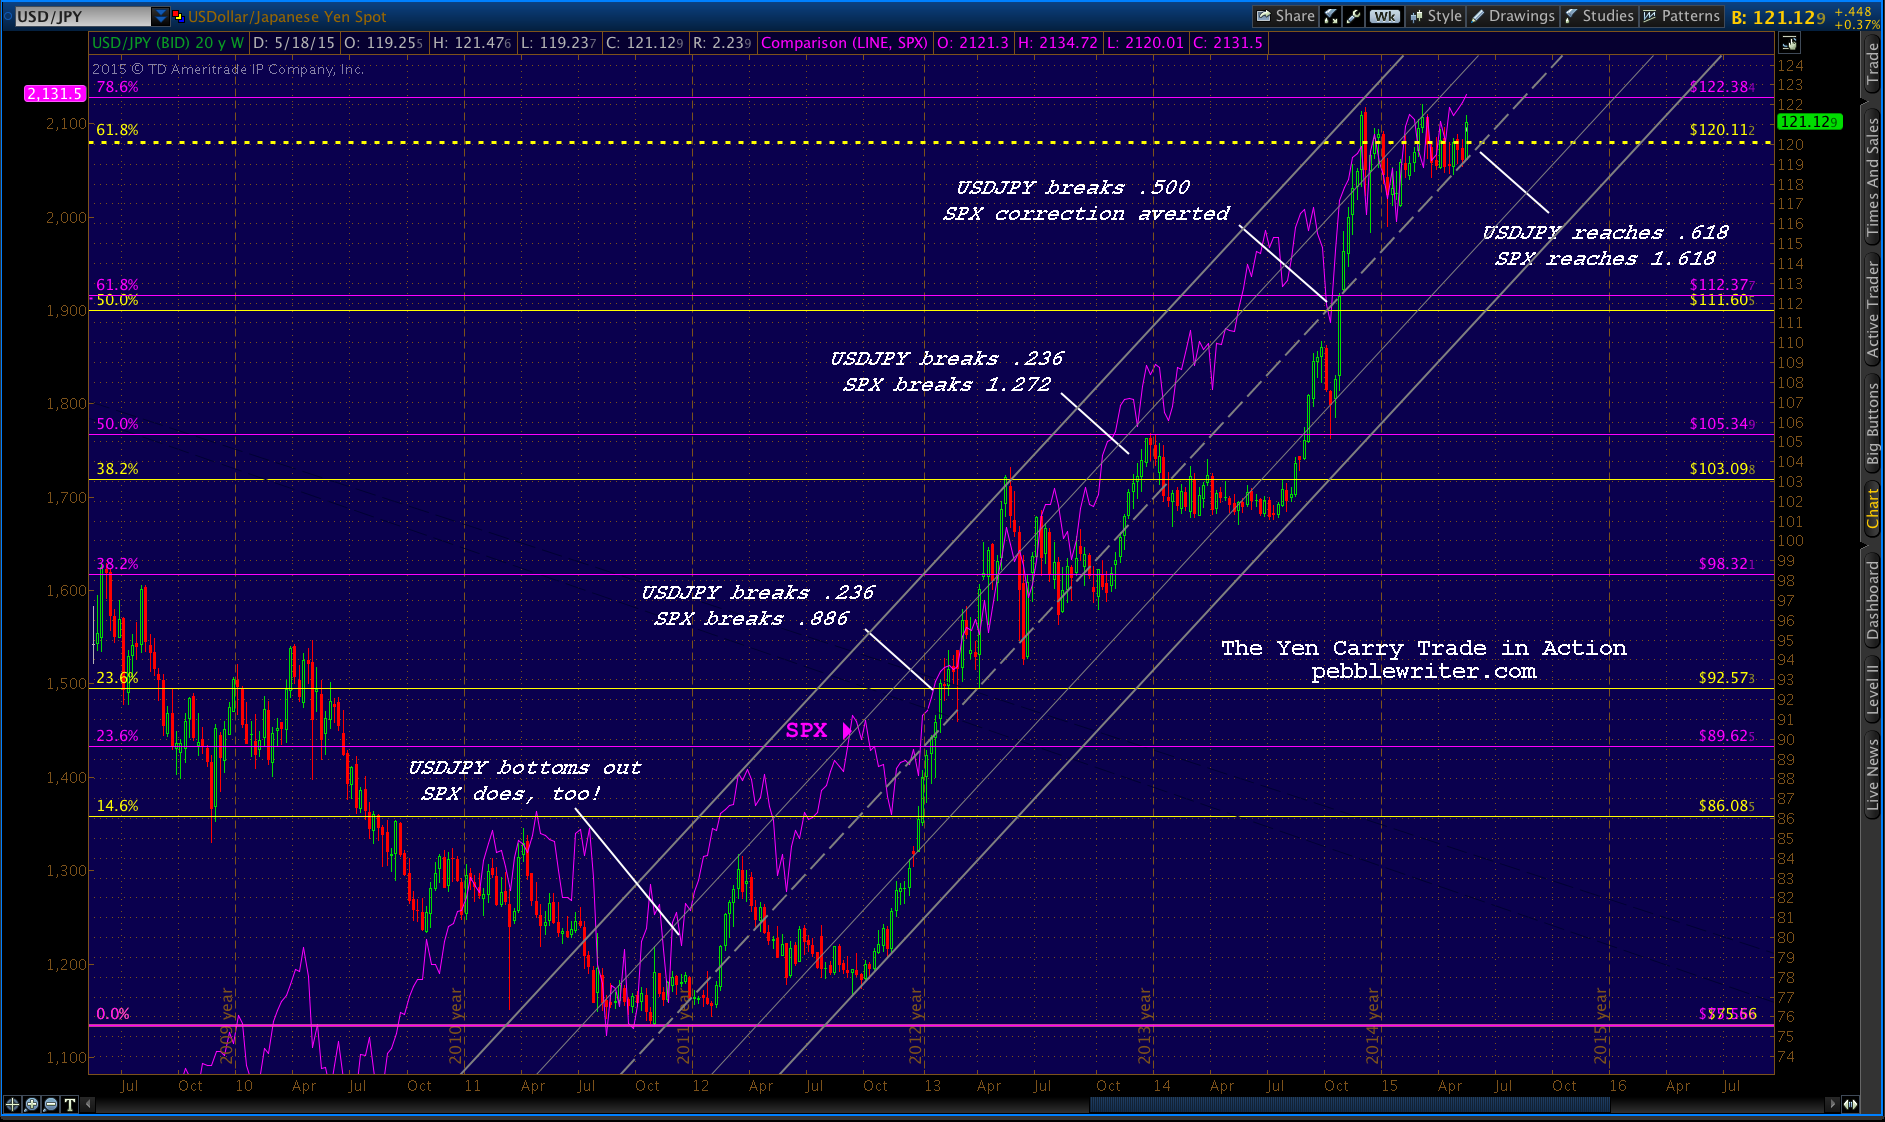 At first, markets were easy to please. If USDJPY shot up to or past 120.11 would automatically produce a rally in stocks. It could, then, be reset overnight (when the futures are more easily propped up) in order to repeat the process the next day.
But, investors began to understand there were no new highs being made in USDJPY. They seemed increasingly unlikely. USDJPY climbed its SMA100 (yellow below) for a while, driving ES higher. But, it was running out of steam.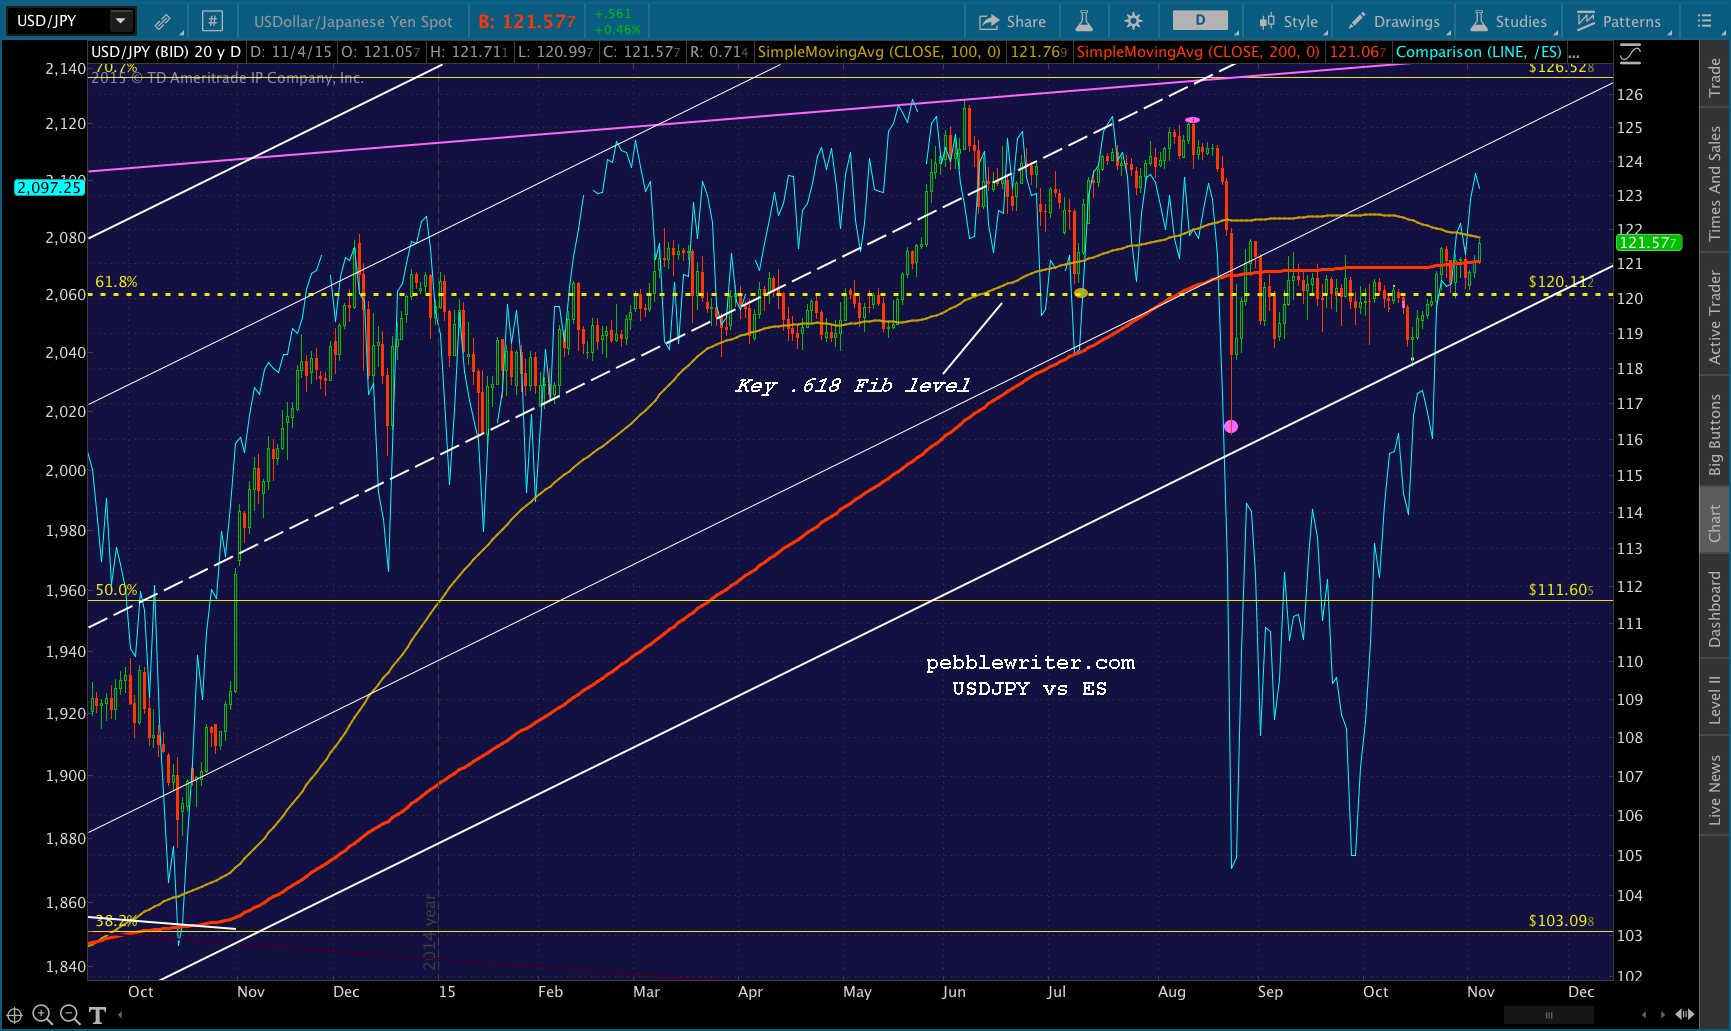 The gains it had produced in SPX were also coming to an end. SPX was approaching an incredibly important Fib level of its own: the 1.618 extension of the drop from 1576 in 2007 to 666 in 2009. As we wrote on May 20 [see: The Last Big Butterfly], completing this huge Butterfly Pattern signaled a very significant decline.
May 20 turned out to be the high for 2015. With 90 years of Harmonic history strongly suggesting a decline, and no USDJPY to support it, SPX began what would turn into a 267-pt (12.5%) correction.
The clincher was when, on Aug 21, USDJPY fell below its SMA100. On Aug 24, when it crashed below 120.11 and its SMA200, SPX fell over 100 points. Someone would have had to be in a coma not to notice the cause and effect. It called for immediate action. USDJPY was lifted 4.6% — a massive move in currency markets — and was back above 120.11 the very next day. As soon as investors saw the support the pair was getting, stocks bottomed out too. ES bounced an impressive 160 points (8.7%) over the next 3 sessions.
The bounce was short-lived as USDJPY, again, failed to break out. Instead, it traced out a Pennant Pattern (in purple above) that oscillated back and forth past 120.11, often testing the SMA200. By Sep 29, it was becoming apparent that it wasn’t going to break out. It had failed to retake the SMA200 nine separate times. Stocks started slipping.
Fortunately for The Powers That Be, the USDJPY isn’t the only tool in the manipulation shed. Oil (CL) had fallen over 65% over the past year in order to make devaluing the yen (in service of the yen carry trade) more palatable to the Japanese. With 8% of the entire S&P 500 tied to its price, pumping up CL was a great way to spark algos into action.
Between Oct 2-9, CL spiked a massive 15.9%. To put that move into perspective, it’s the equivalent of 333 SPX points — more points than SPX has ever moved in either direction in any one month, let alone a week.
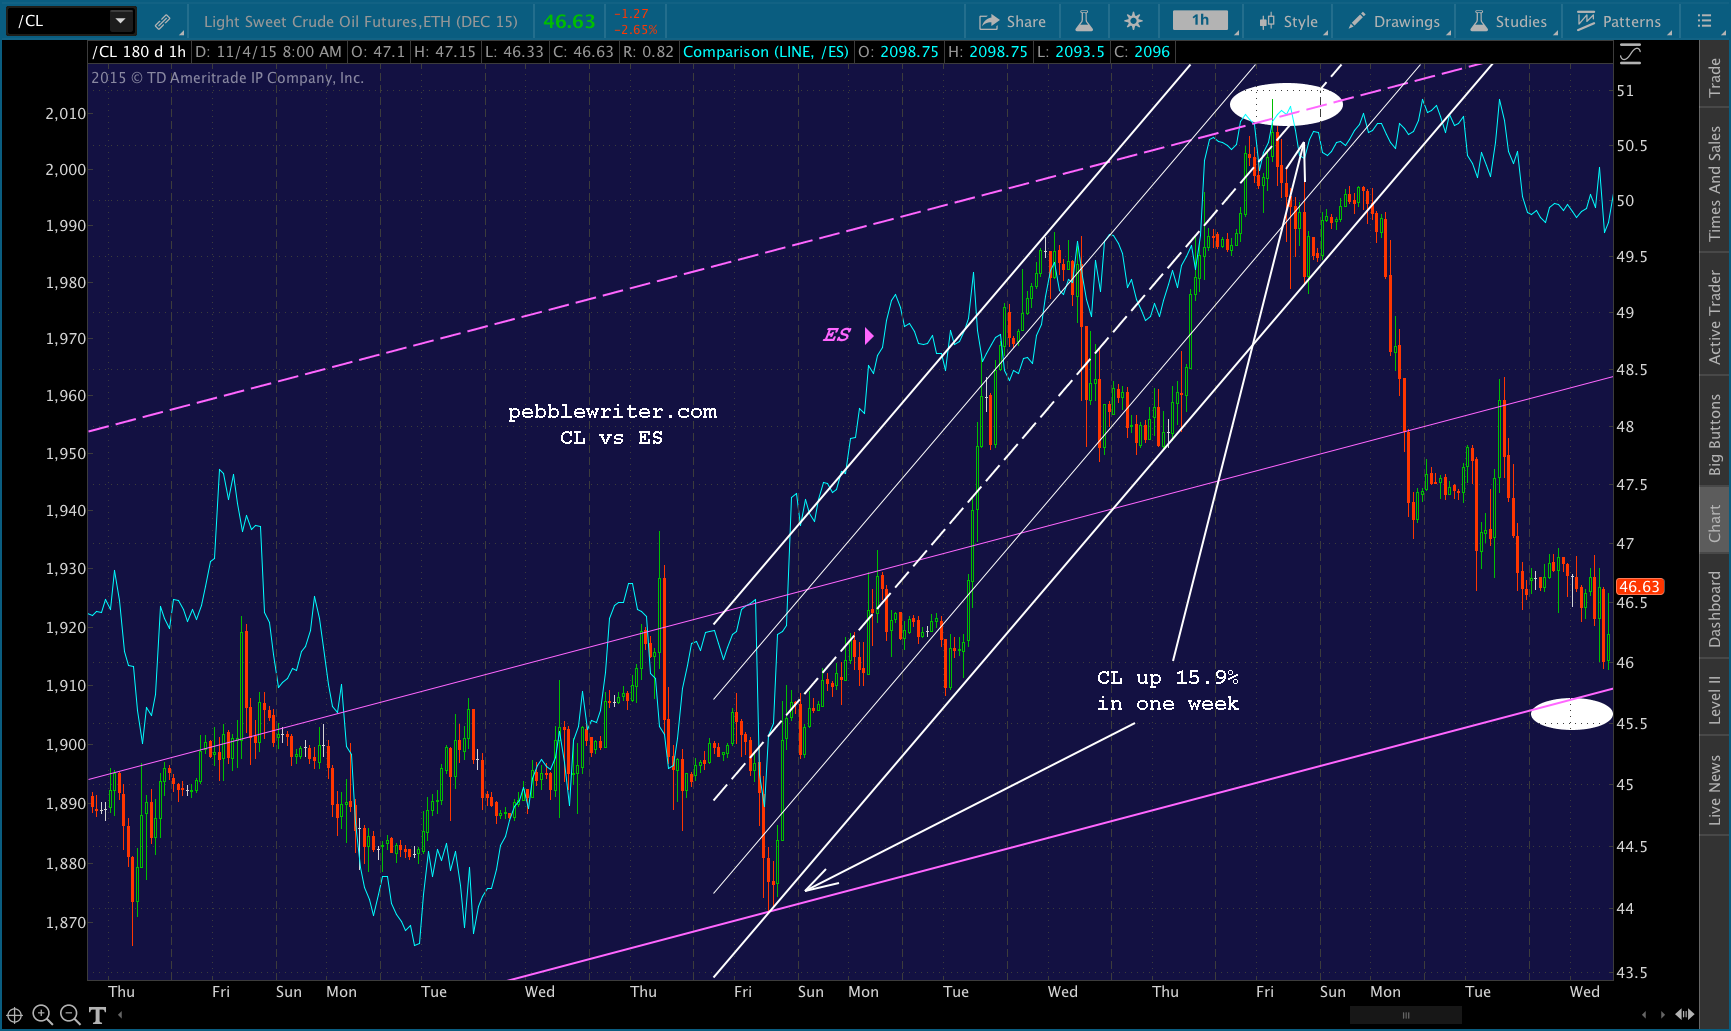 Stocks paid attention. ES rallied 125 points (6.5%) during that same week, coming within 3 1/2 points of the .618 by the time CL was finally given a rest and fell out of the steep, white channel.
Rather than drift lower, CL plunged back to the bottom of the larger purple channel it had been riding since its Aug 24 lows. It dipped below it on Oct 15 and bounced, but by Oct 20 it was done with the purple channel — falling away at a precipitous rate.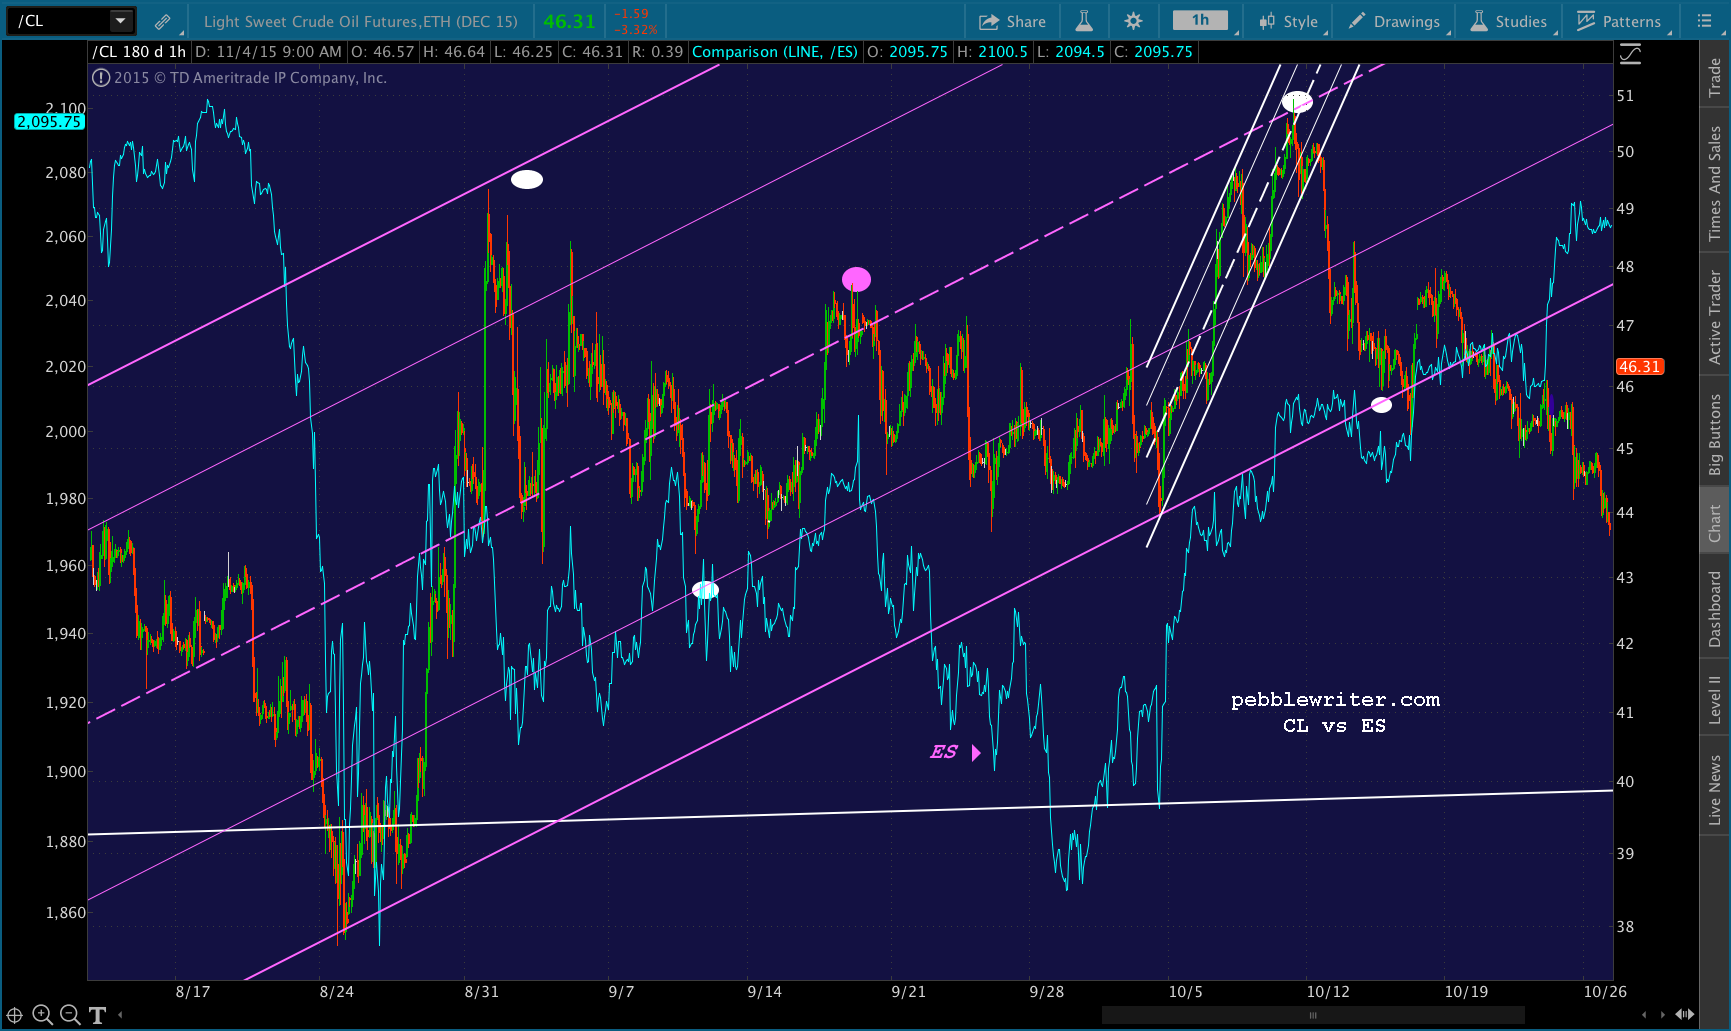 It’s demise wasn’t a problem, though, because USDJPY bottomed out on Oct 15 and began a stunning rebound back above, in succession: the Pennant Pattern bottom, the key Fib at 120.11, the top of the Pennant Pattern and the SMA200. Just today, it nearly tagged the SMA100 as well.
It formed a channel that was every bits as clean and precise as was CL’s. And, by Oct 22, it had carried ES all the way to its channel top and SMA200 as discussed above.
It seemed it might stop there, because USDJPY itself had reached the top of its Pennant Pattern. It even reversed late that night, falling away from the Pennant top and through the rising white channel’s midline.
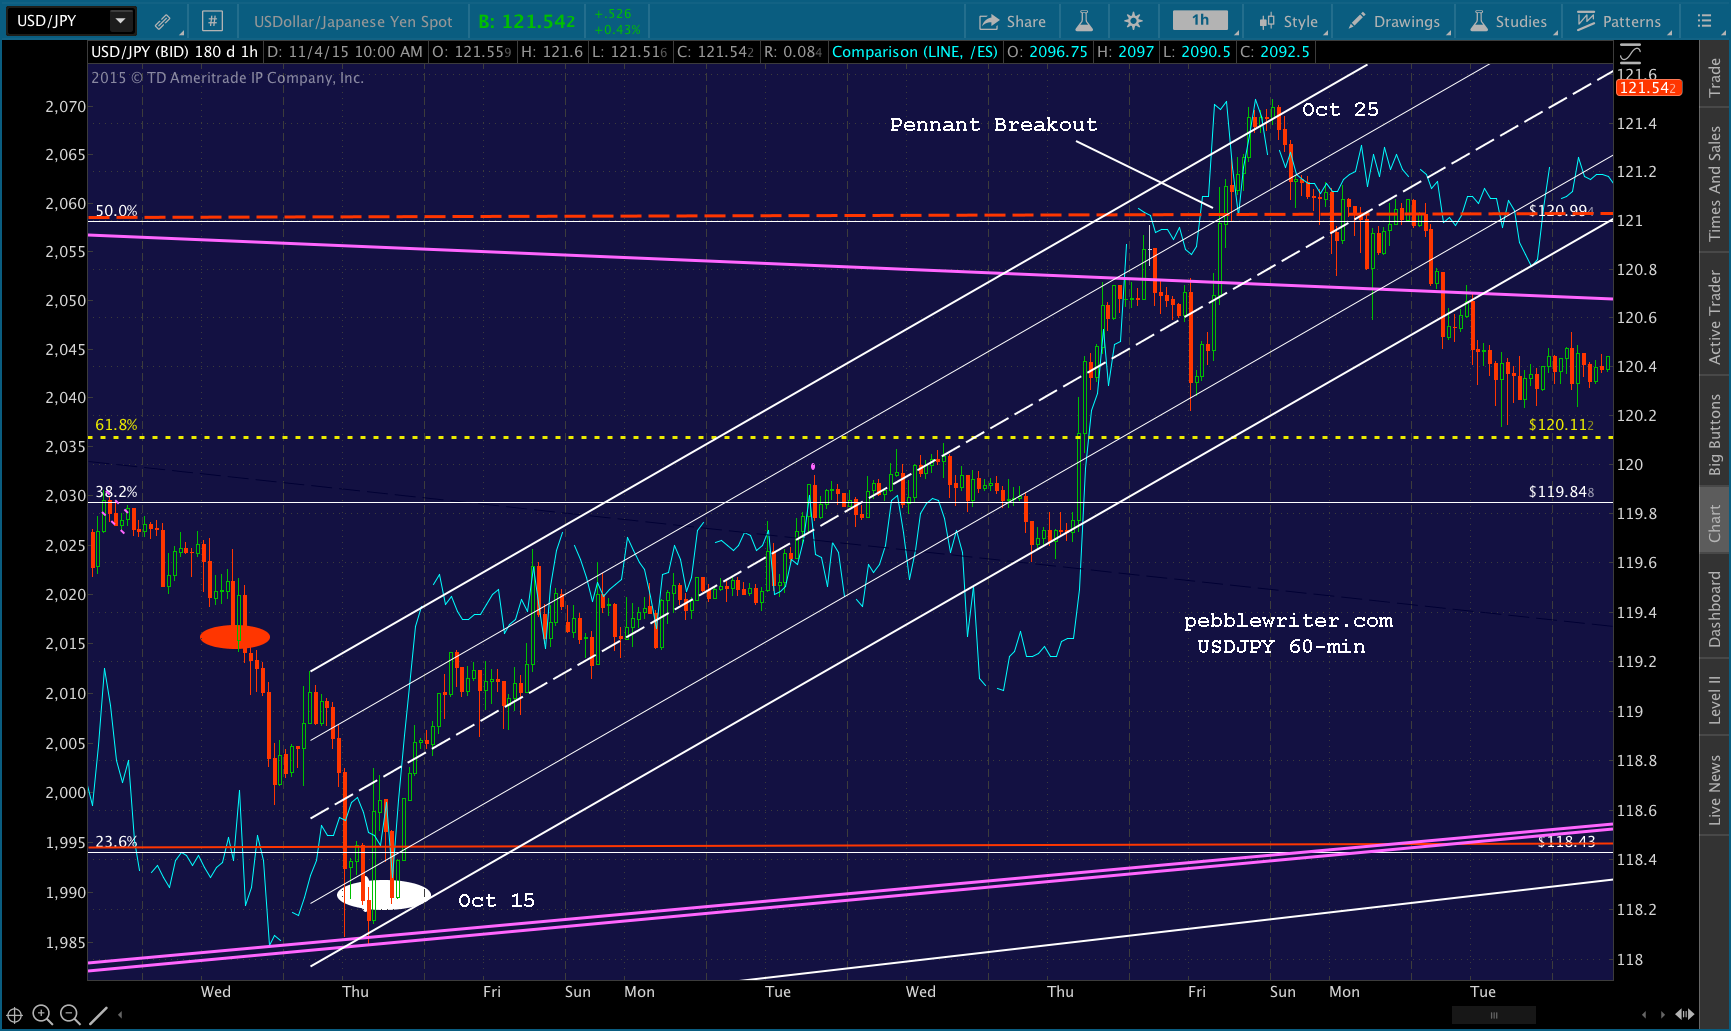 But, it bottomed out at 3am. By the time stocks opened the following morning, it had spiked back above the Pennant top and the SMA200. ES, which had been off by 8 points that night, posted an 11-pt gain by the time the cash market closed.
It was a nice enough reversal; but, the key was that it popped above the channel top and the SMA200 without a hitch. Following a brief backtest, it has been easing higher ever since [as of yesterday, ES and SPX had climbed back to within 1% of their May all-time highs.]
The funny thing is, though, that USDJPY ran out of gas once again (after ES had topped its SMA200, of course.) This was deliberate. If there’s one thing the algos like more than a breakout, its a successful backtest after a breakout.
Because USDJPY was allowed to backtest the yellow .618 Fib (120.11) over the next three sessions, ES and SPX were able to backtest their SMA200’s and channel tops. At the exact same time, CL suddenly stopped declining and started racing higher. But, we’ll get to that in a moment.
The remarkable thing about USDJPY is that it was driving stocks higher without really making any progress itself. The chart below shows how. The hours between 8am and 4pm have been highlighted to illustrate the fact that, in every session since Oct 20 — when ES and SPX first tested their SMA200’s and channel tops — USDJPY has rallied sharply.
The rallies tend to start around 5 AM, 90 minutes before stocks open, and generally run through 4 PM when they close. Within a few hours after the close, USDJPY settles back down, ready to pull the same stunt the next day.
 Note that today’s session #10 sees USDJPY barely higher than it was in session #2. Yet, ES has risen 50 points (2.4%.) Much of the benefit came from this ratcheting action in USDJPY. The rest came from CL, which was staging its own algo fest.
Since Oct 27, the day that ES and SPX completed their backtests of their channel tops and SMA200s, CL has soared over 13.5%. It’s not quite as spectacular as the 15.9% spike in early October, but it’s impact has been amplified by its concurrence with USDJPY’s action as described above.
 Two days ago, I pointed out that ES and SPX had completed Bat Patterns — a tag of the .886 Fib retracement of the drop between May and Aug. Since neither had had much of a retracement since Sep 29, and we had an excellent point B on Sep 19, a Bat Pattern reversal was a very good possibility. This is the chart I posted on SPX in Beware the Bat.
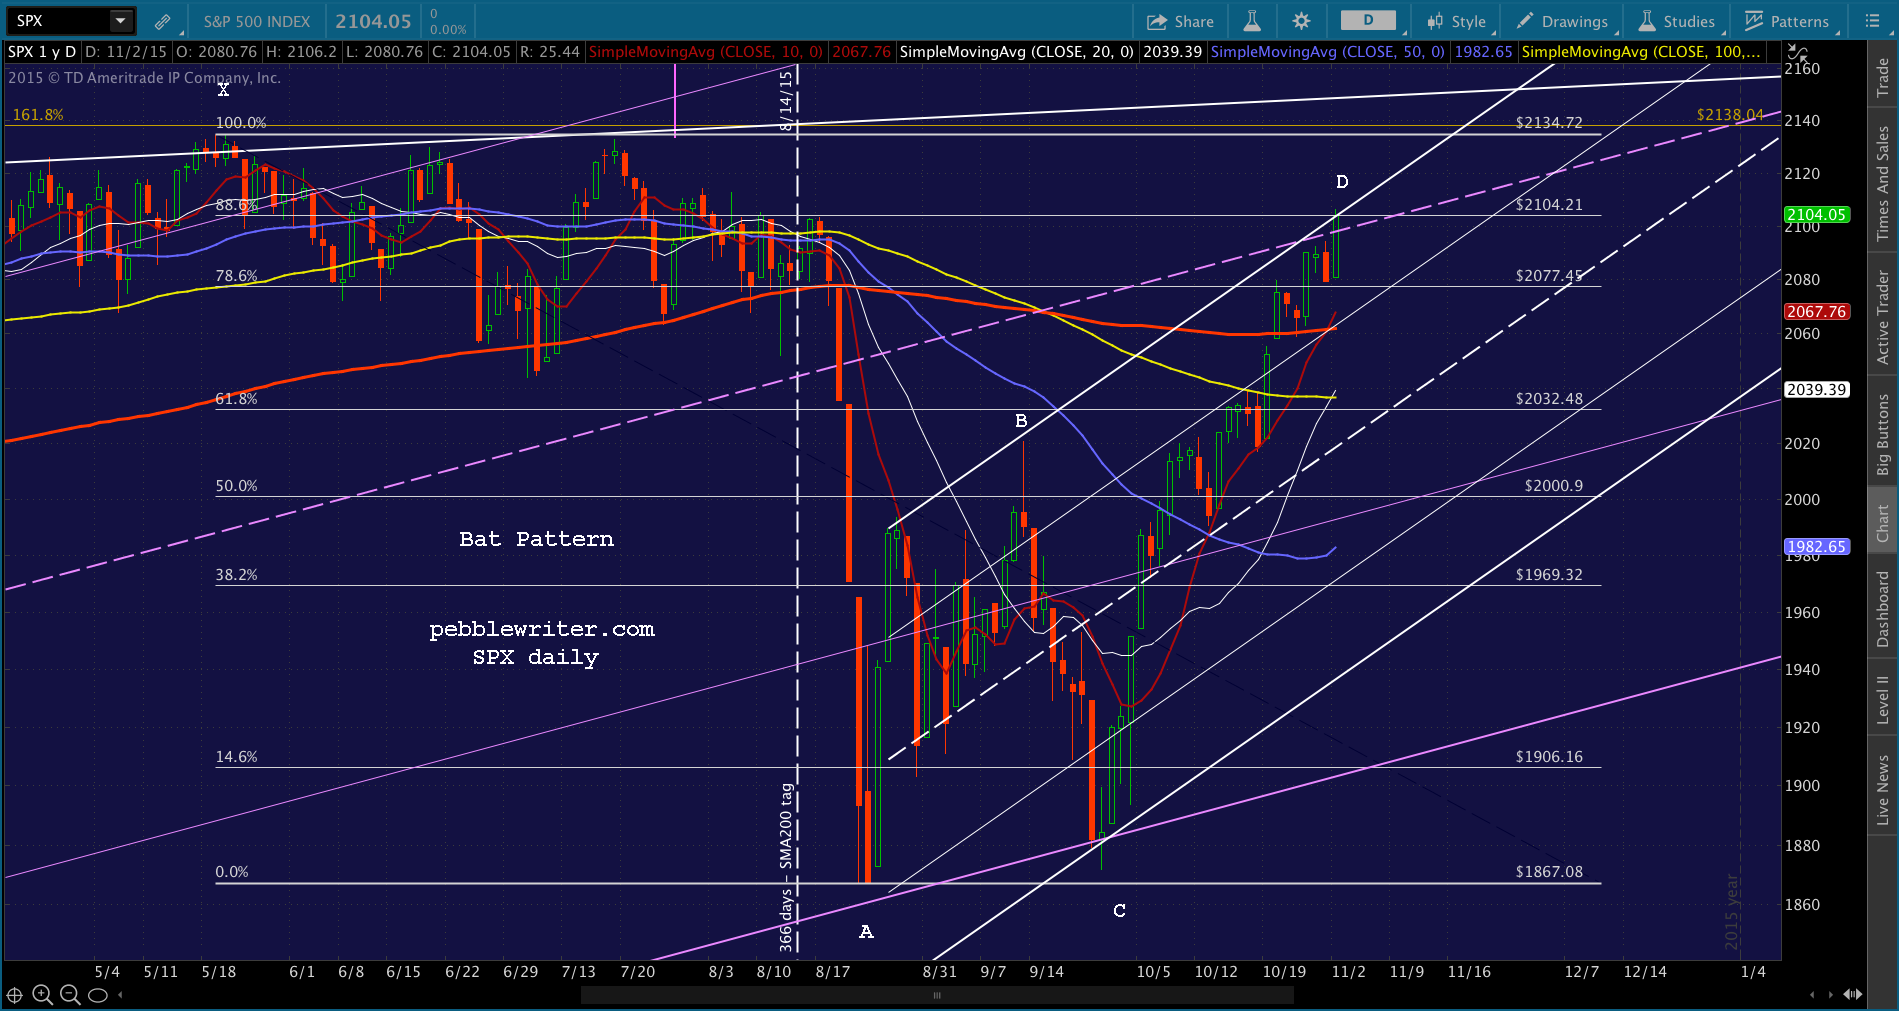 Any reversal that might or should have occurred that day was waylaid by CL’s impressive 5.1% spike above the red, dashed neckline of an Inverted H&S Pattern and USDJPY’s sudden spike back above its SMA200 (sessions #9 & 10.)
Today’s effort was hampered by USDJPY running into its SMA100. So, they’re letting the air out, no doubt for another try after a “reset.” Note that CL not only didn’t follow through on the completed IH&S, but it has fallen back below the prospective neckline where it is seeking support at a trend line off recent lows.
Now What?
Having put most of you to sleep long ago, I’m going to hold off answering that question just yet. Suffice it to say that the past 5 weeks have amply demonstrated TPTB’s ability to shoehorn the “markets” higher.
The implications are, of course, quite alarming. If a guy sitting in a windowless room at 131 E. Dearborn in Chicago can push a couple of buttons and prop up stocks every time they start to slide, then we no longer have a market, do we? Price discovery is kaput, and there is little value in worrying about direction.
Except…we did have a 12.5% correction between May and August that did a lot of damage to a lot of folks. Several hedge funds were in the headlines as having suffered their worst quarters in years, and even more announced plans to wind down.
I suspect most of these had long ago given up on actually hedging, and were simply holding a leveraged long portfolio and hoping for the best. It’s hard to blame them, given that most every shorting opportunity over the past four years — including the latest — has been a bear trap.
But, the fact remains that it is possible to outperform the indices if one is nimble enough to not only avoid, but take advantage of, the occasional downturn. For me, it requires seven monitors, 10 hours a day, and lots of caffeine. Maybe you’ve got a better method. The key is in understanding and recognizing the games utilized by TPTB to stop declines cold in their tracks and to force stocks up through resistance.
Today, it’s USDJPY and CL. Tomorrow, it might be something different. I fully expect that the guys pushing the buttons will lose control one of these days as exorbitant debt levels and limitations on currency manipulation collapse the yen carry trade.
When that happens, I’d like to be prepared. Better to jump unnecessarily at a few shadows than to be mugged by the same guys who nearly bankrupted the financial system just seven years ago.
* * * * *
How safe is the financial system? Has it really been fixed? For a shocking look
at how little progress has been made, see: The Wipeout Ratio — an Update.
Memberships are currently on sale at up to 50% off.
For access to daily market commentary, including
intraday long/short recommendations, CLICK HERE.


 With the massive NFP beat on Friday, bears thought they just might have a fighting chance. The odds of a rate rise in December have clearly risen.
 And, TPTB were quick to seize on the USDJPY strength (+1.15%) it produced. What happened after that was a testament to the degree of control they still exert over currency markets and, hence, the equity markets.
  The net result was a drop in SPX that was couldn’t even reach the next lower Fib level. But, that was Friday. Today’s another story.