

Another OPEX, another overnight ramp job – this one courtesy of Mario Draghi who, not so surprisingly, is prepared to do whatever it takes to blah, blah, blah… ES rallied 11 points off the overnight lows, while USDJPY has been working to put a damper on things. Could it have anything to do with max pain being way down at 2050 today?
continued for members…
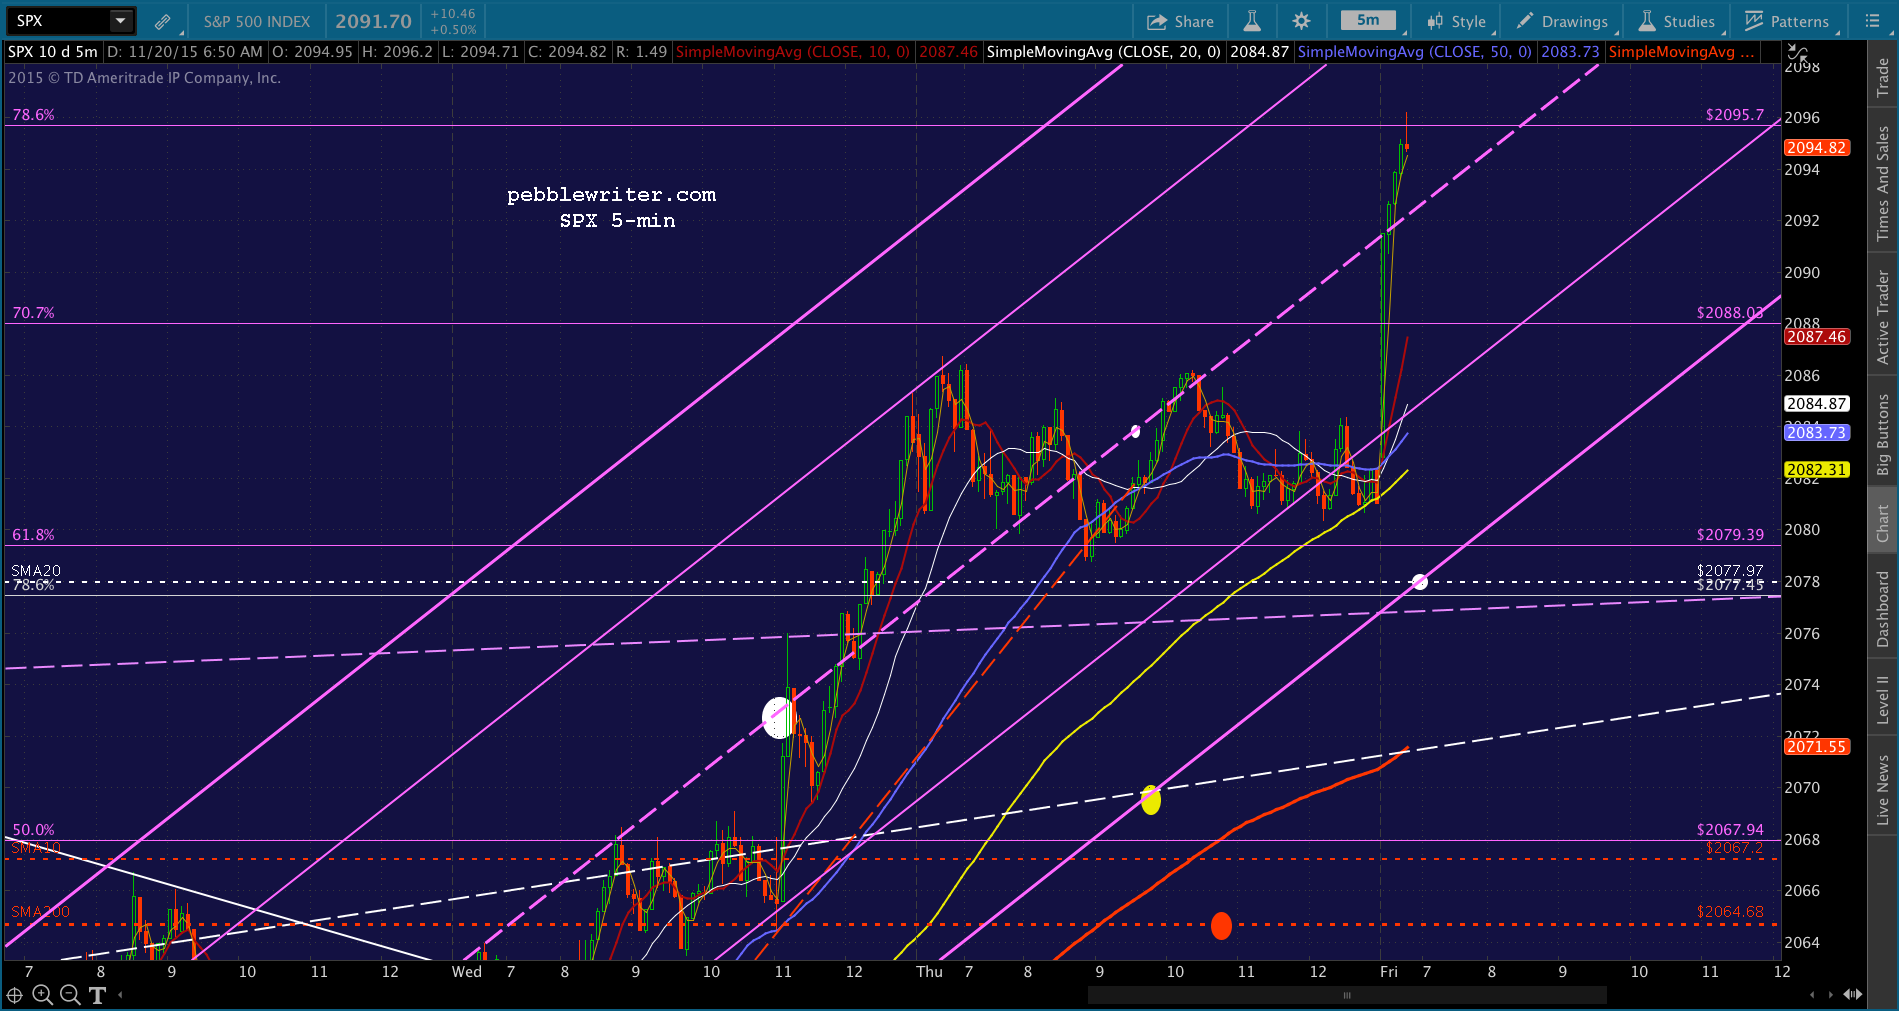
With ES up 8 points, the safe bet is that SPX will reach at least the .707 Fib on the open. Whether it makes it up to the .786 is a good question.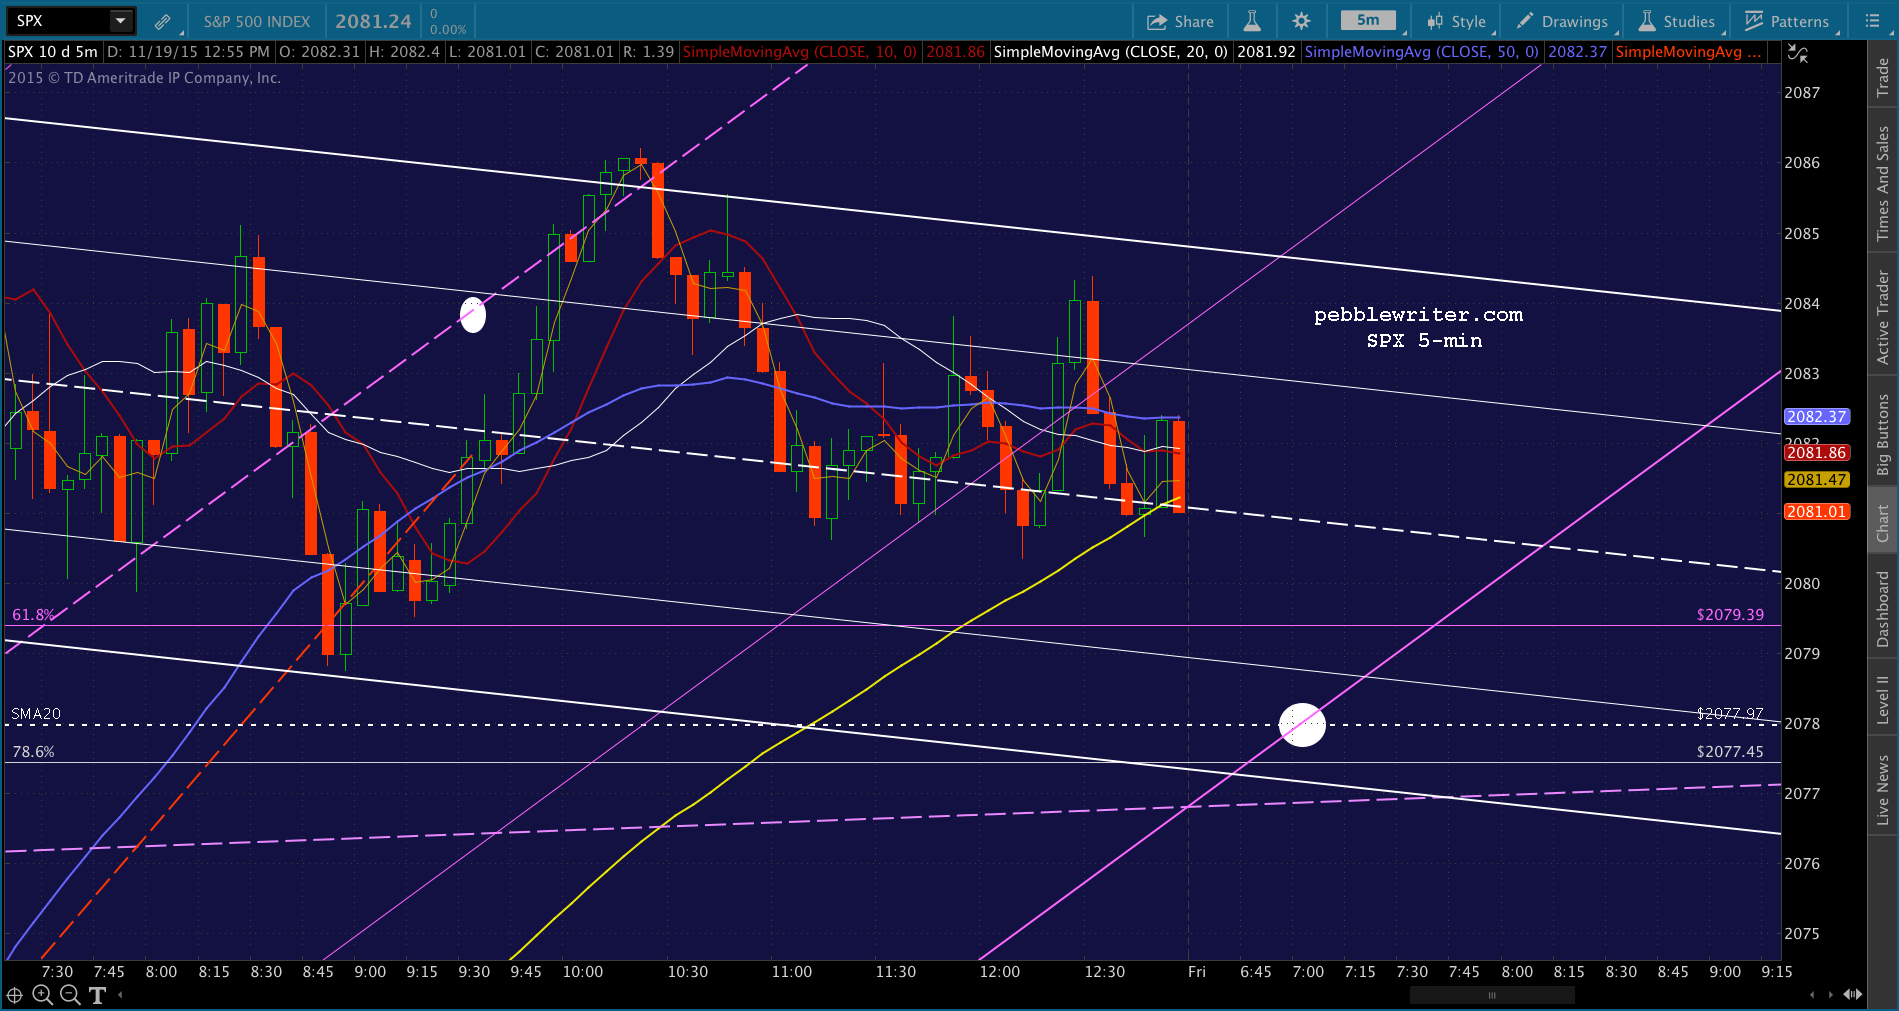 The purple channel and relevant Fib levels:
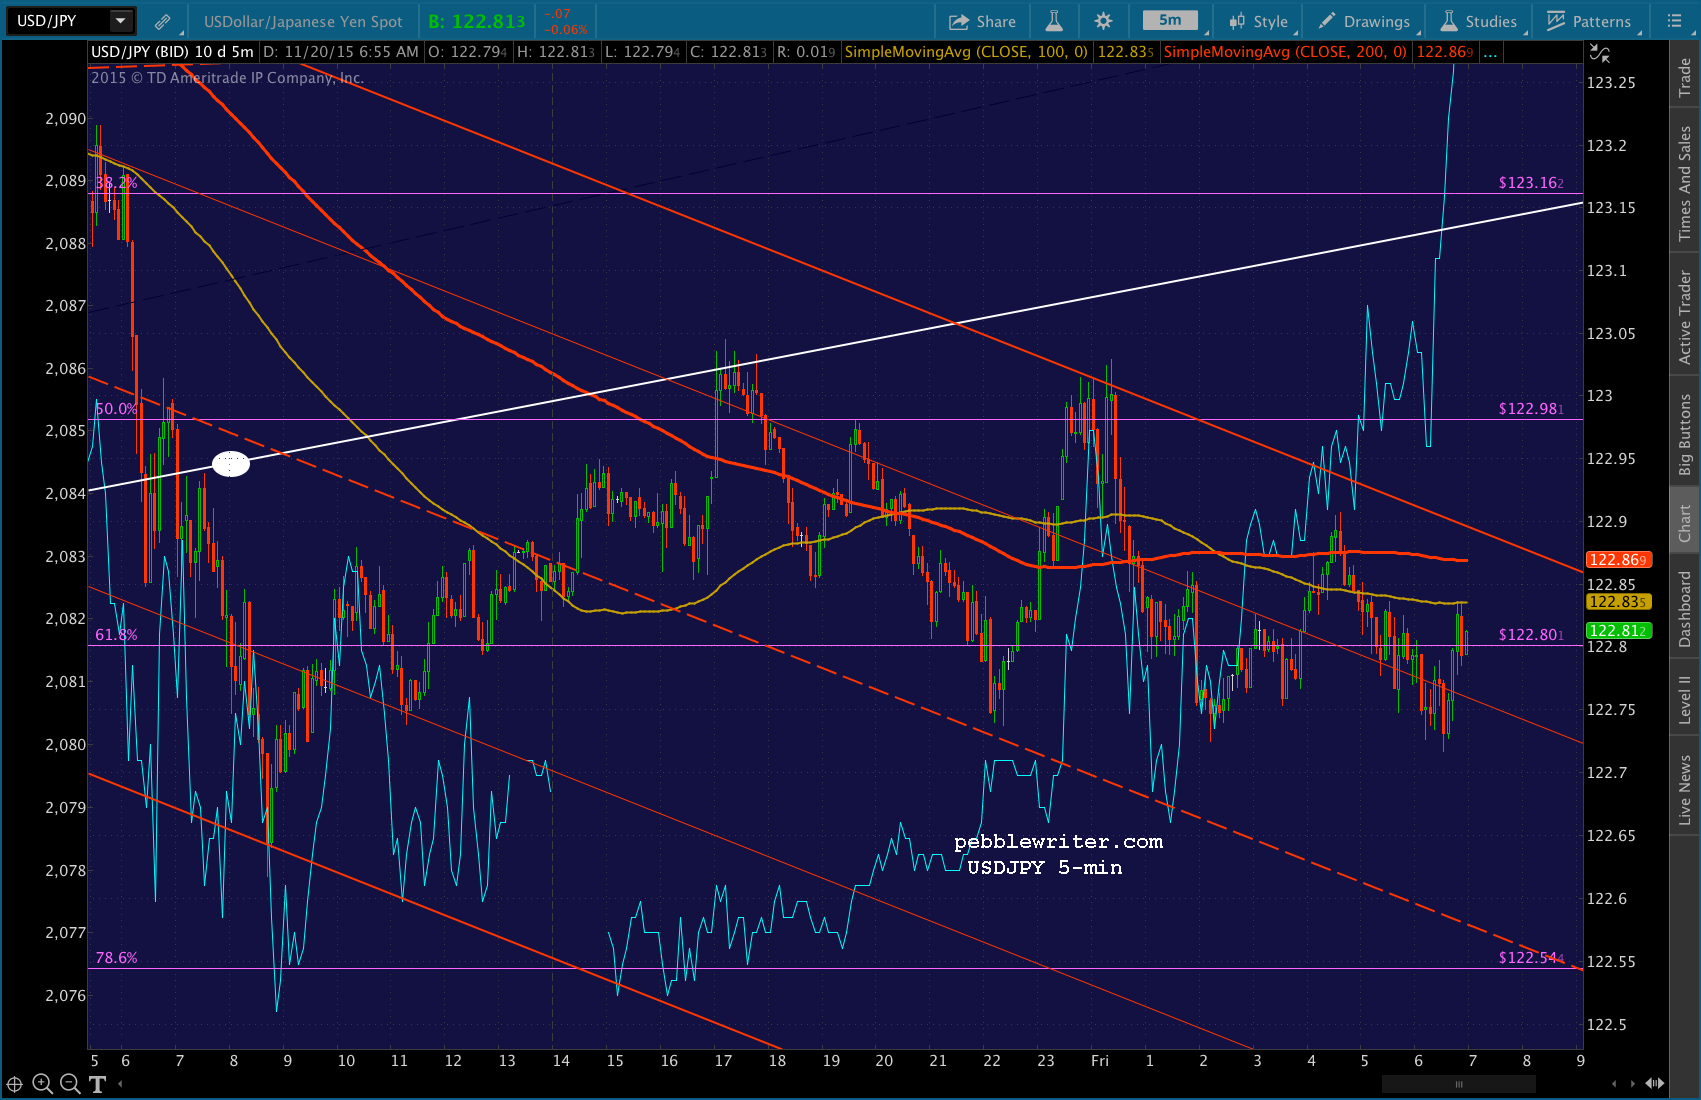
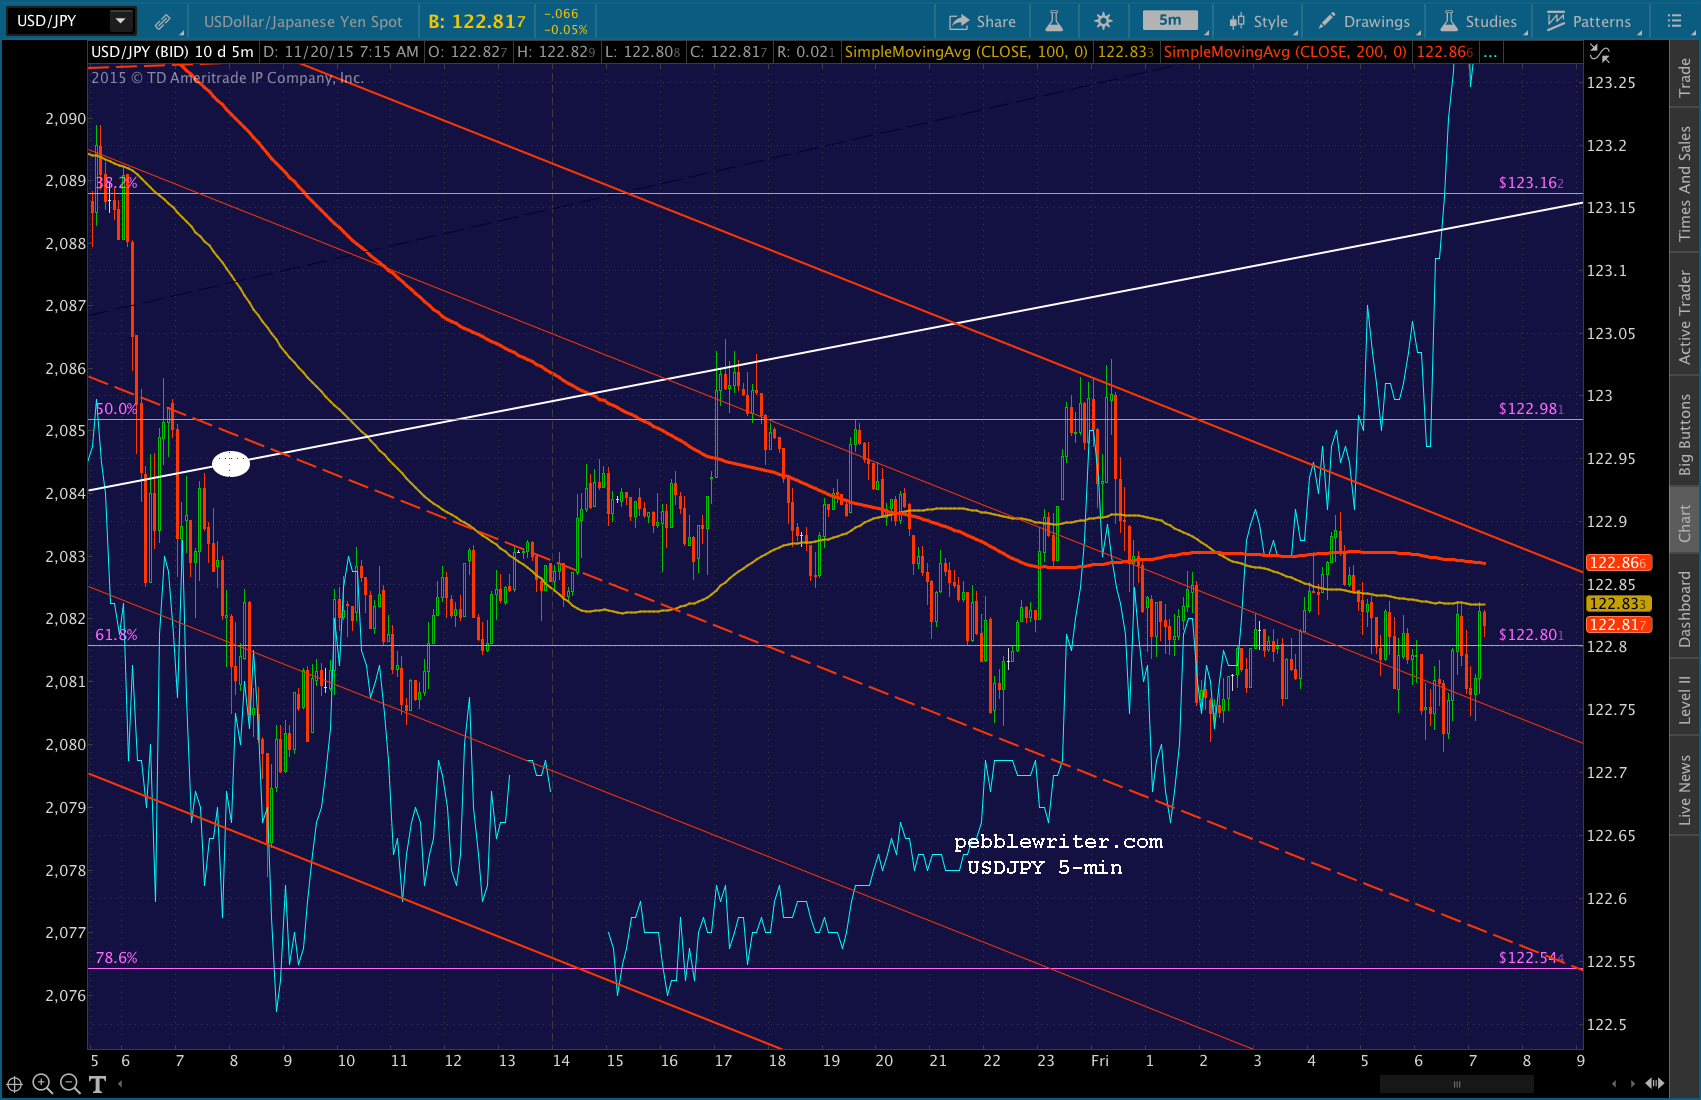
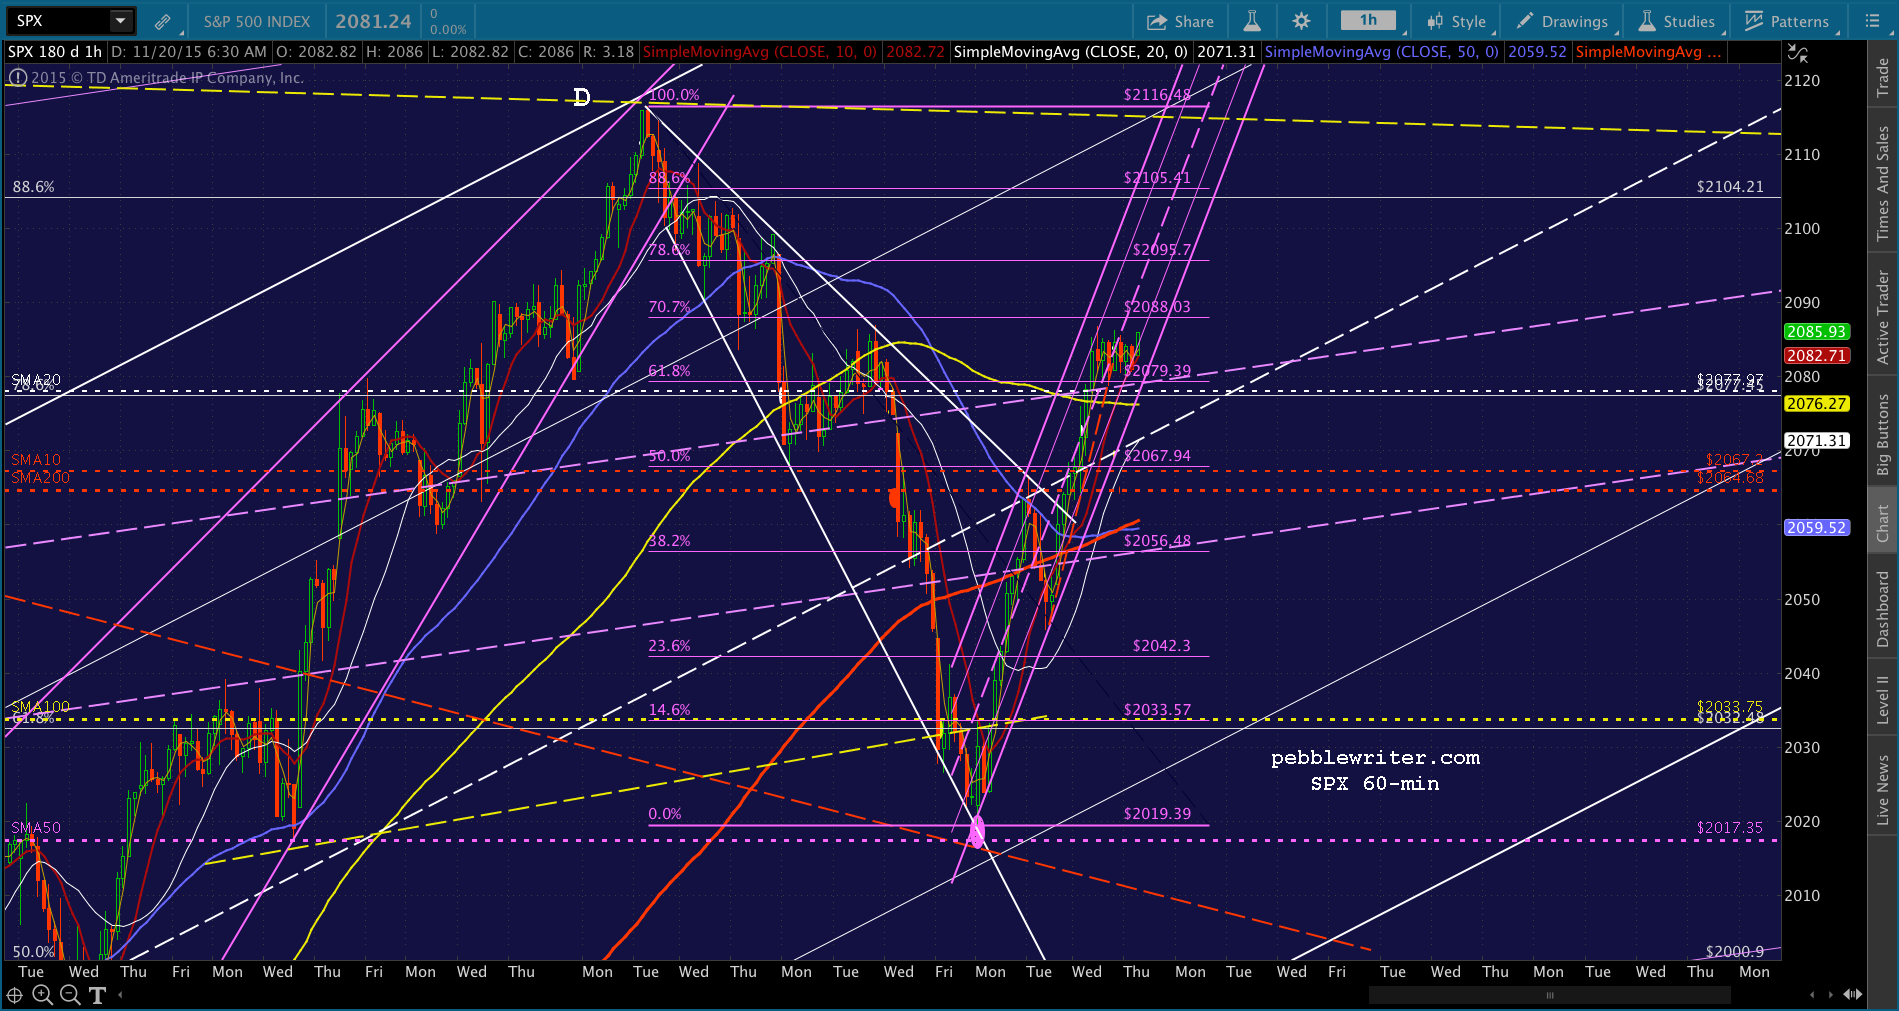 USDJPY is agitating for lower prices, having clearly departed from the rising white channel…
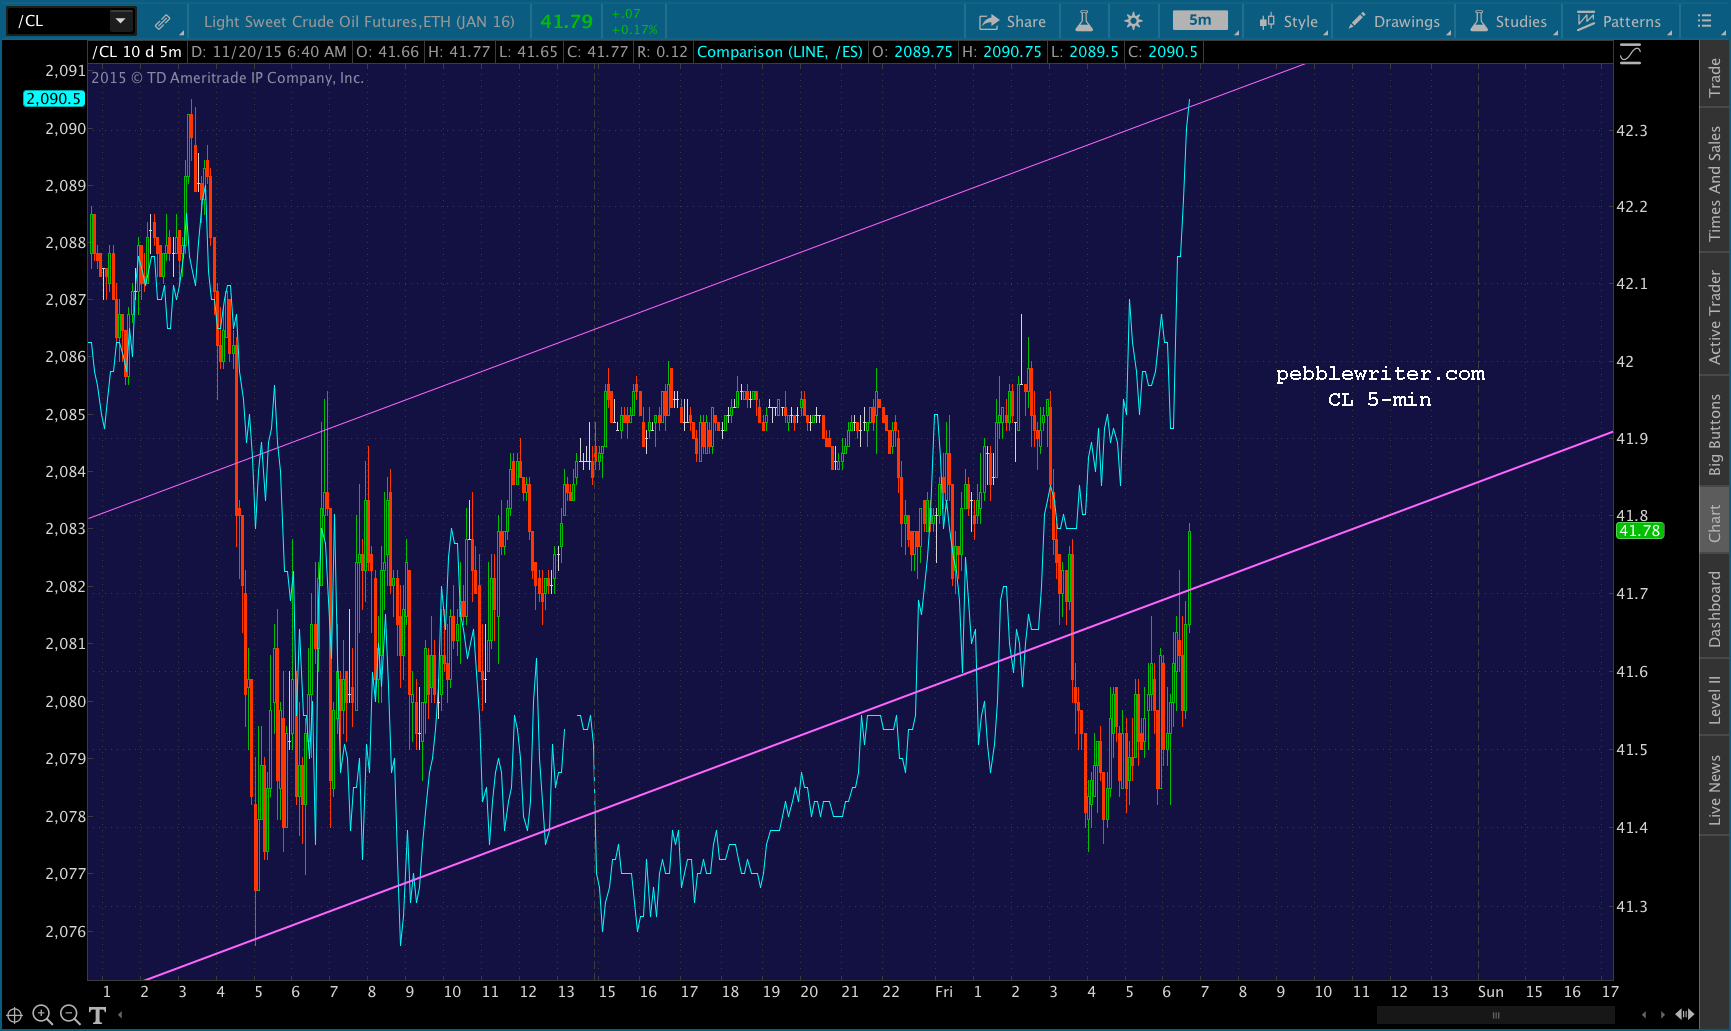
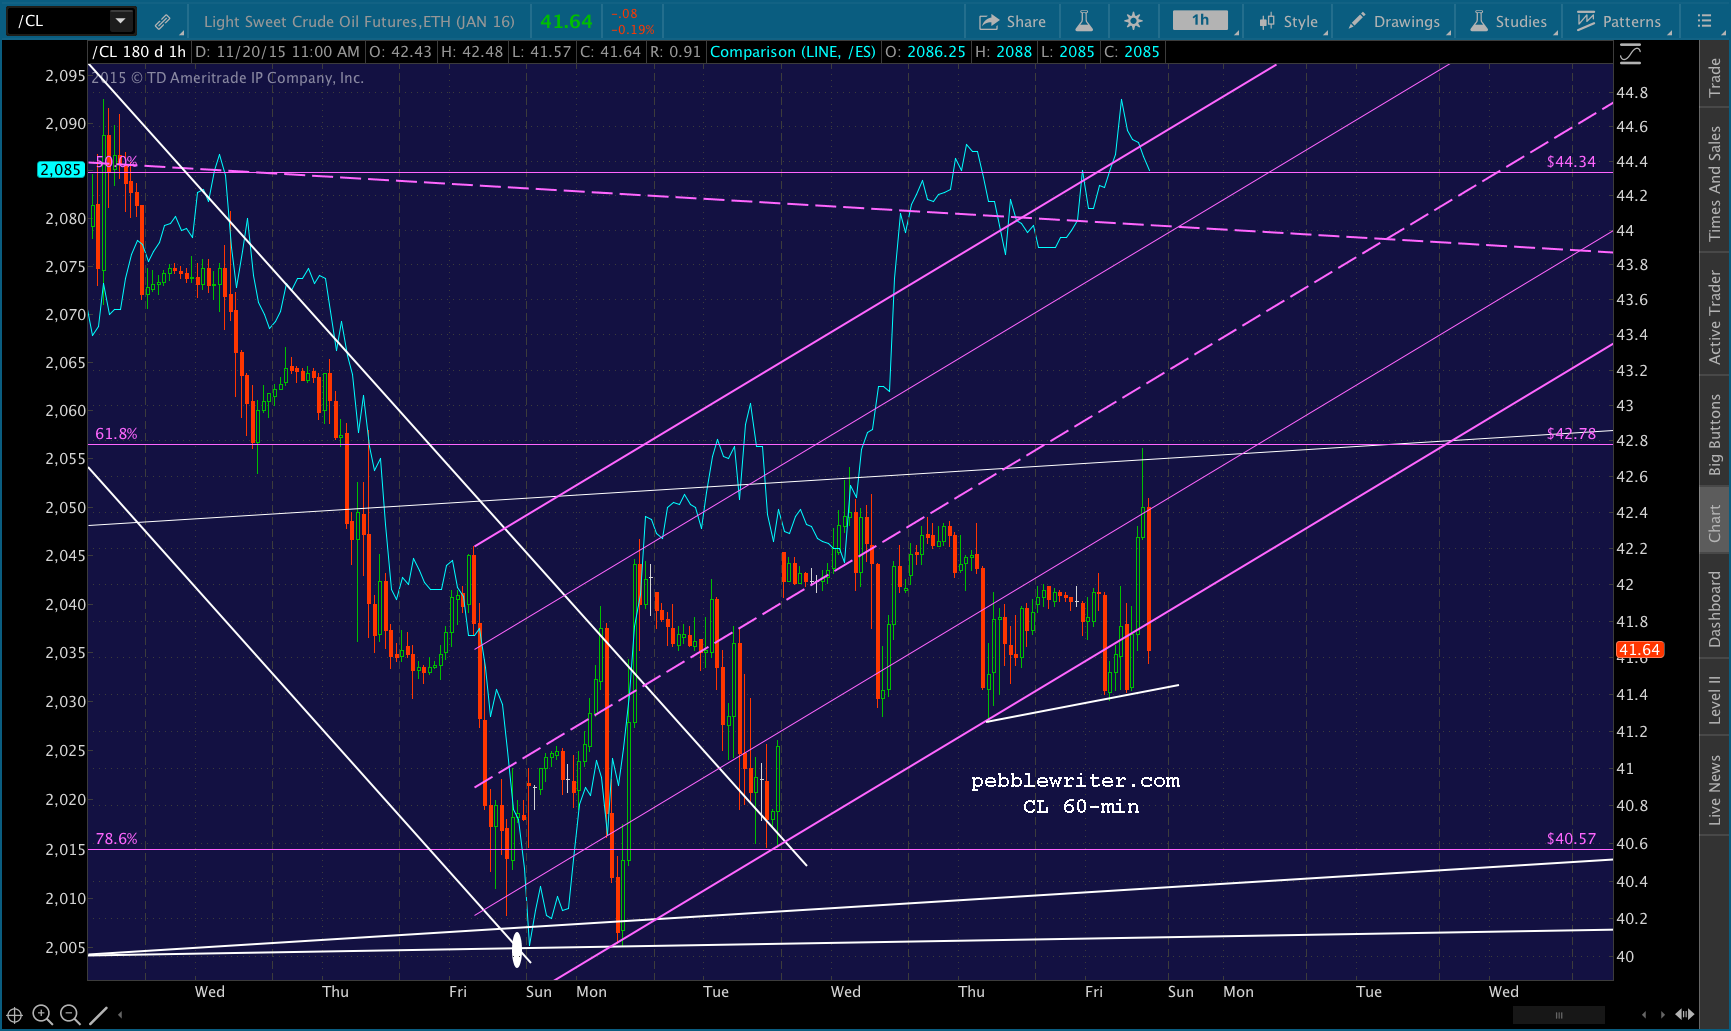
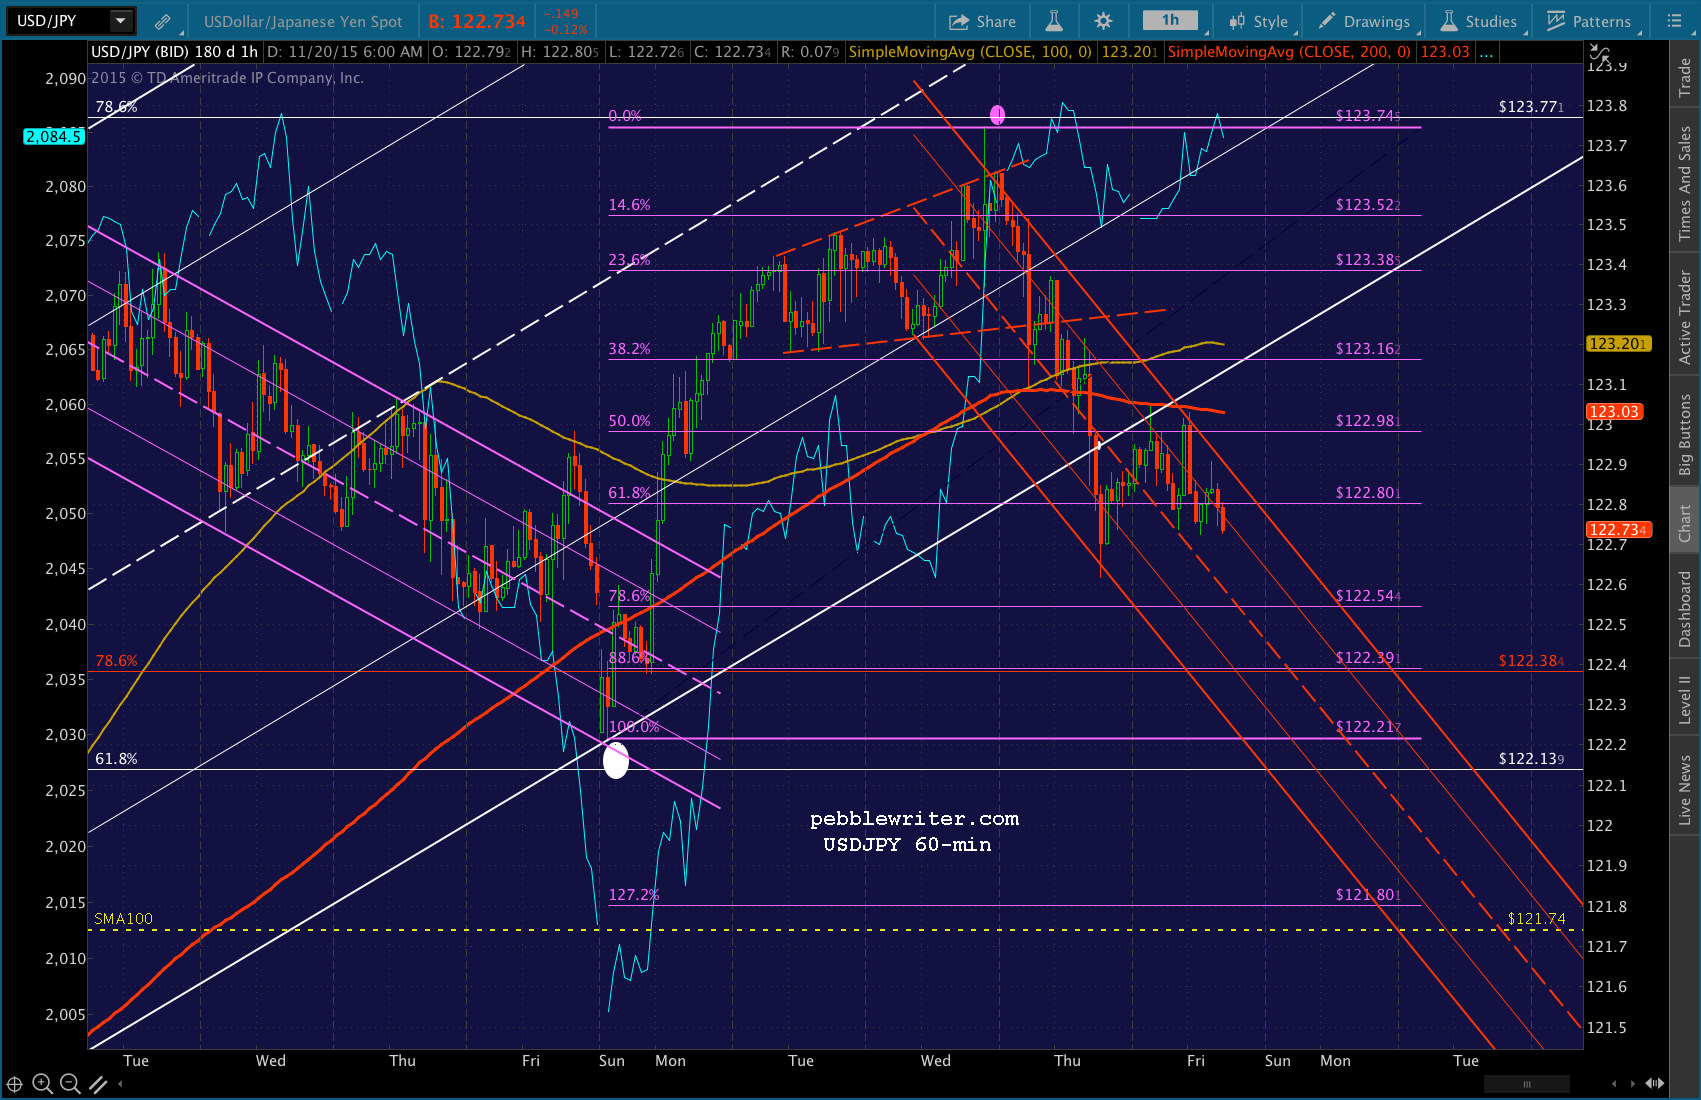 CL is doing the same, though a rebound later in the session would surprise exactly no one.
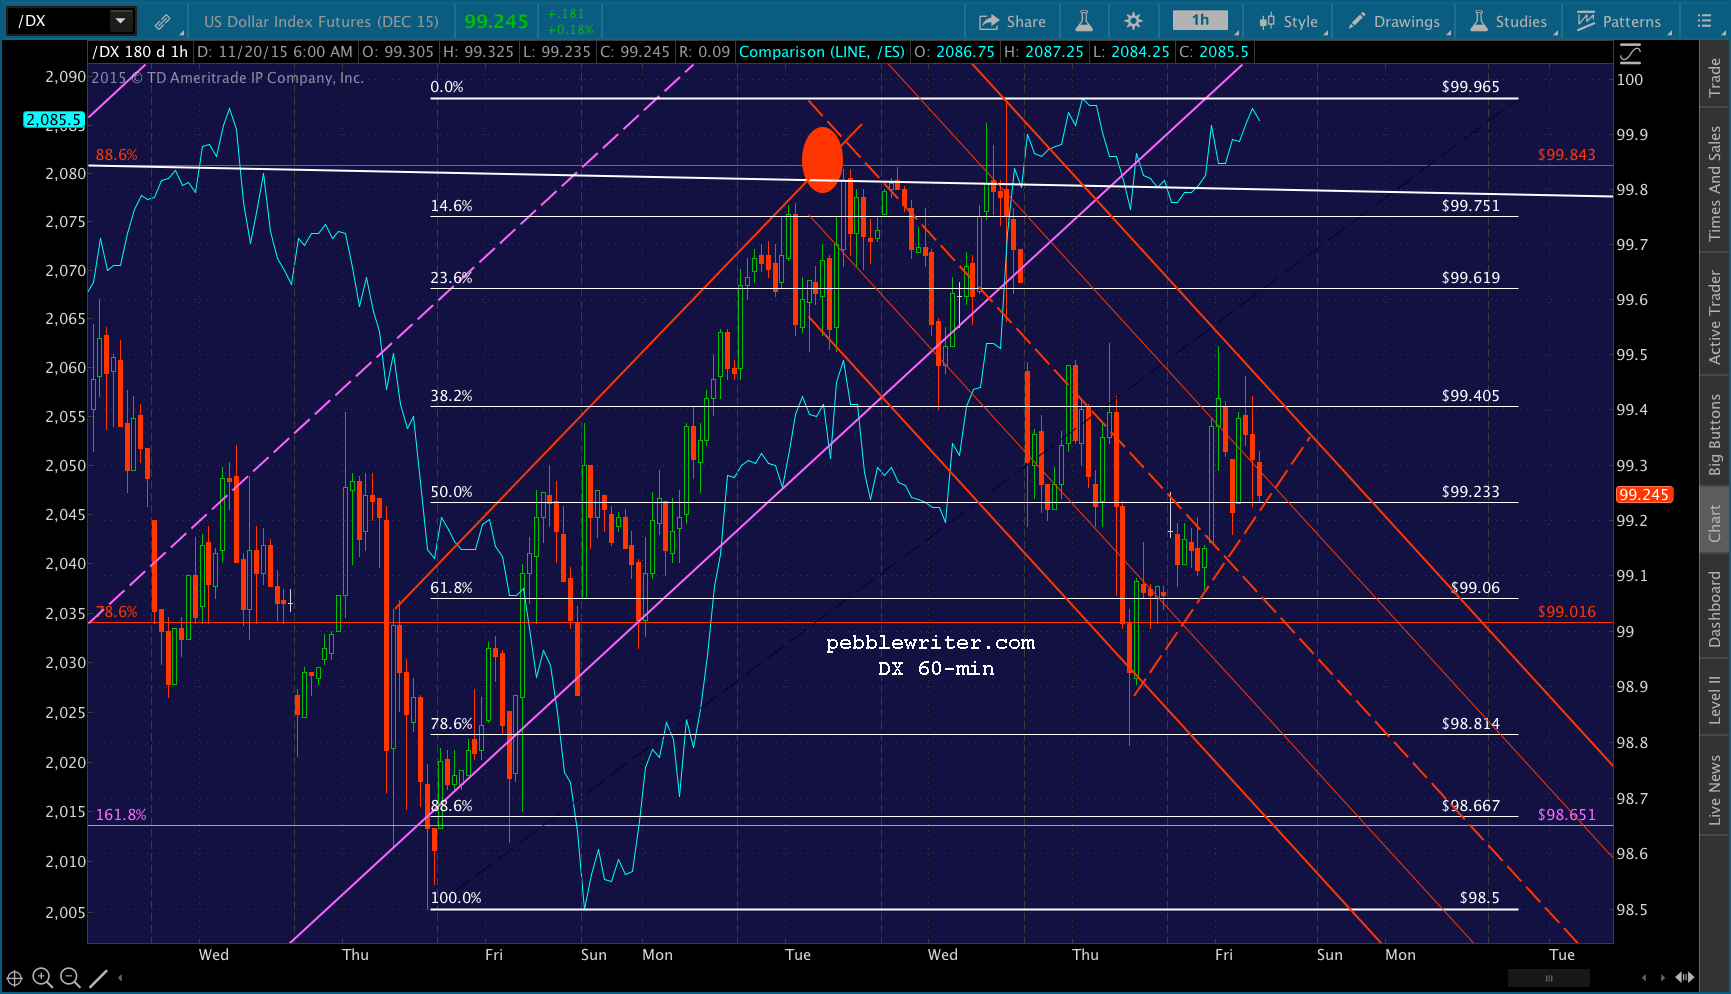
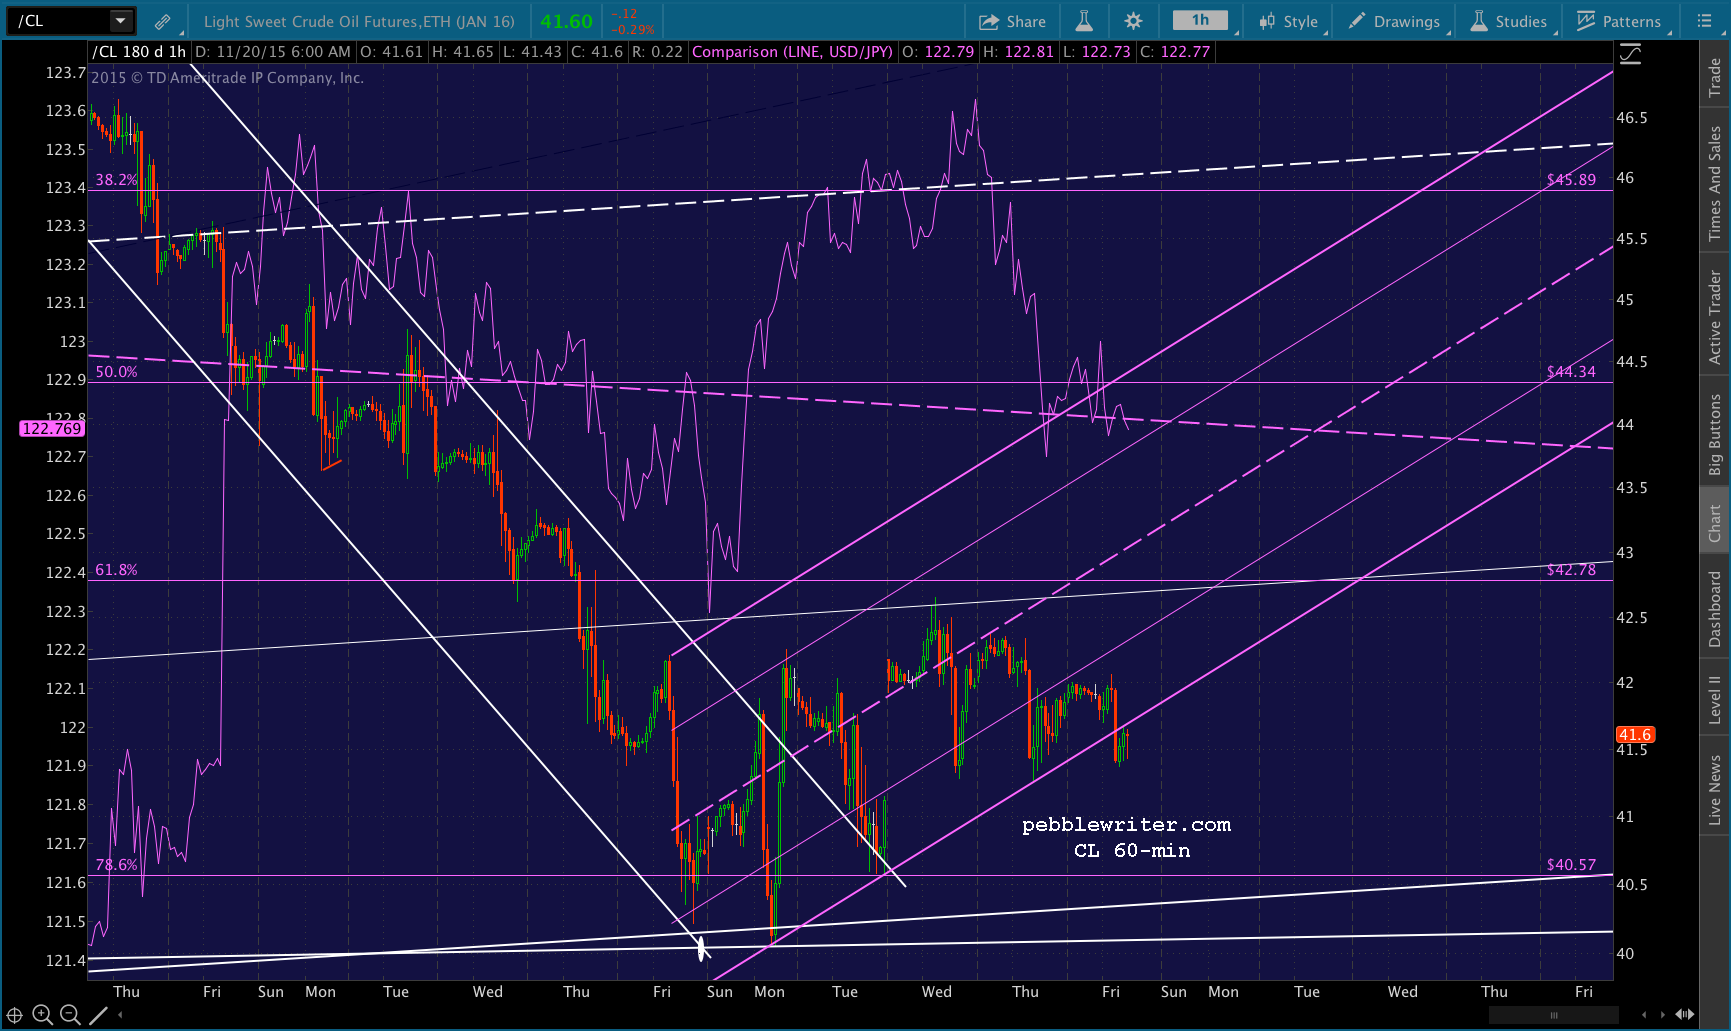 I’ll be keeping an eye on DX, which lost its rising purple channel yesterday, but is finding support at a random TL off yesterday’s lows.
 All I know is it was nearly impossible for SPX to sell off yesterday. It couldn’t even manage another few points to backtest the nearest moving average – the SMA20, now at 2077.97. Maybe today…but, the futures sure aren’t suggesting it.
In general, I’d stay long as long as ES can maintain the rising megaphone pattern and VIX can cling to the bottom of its rising red channel.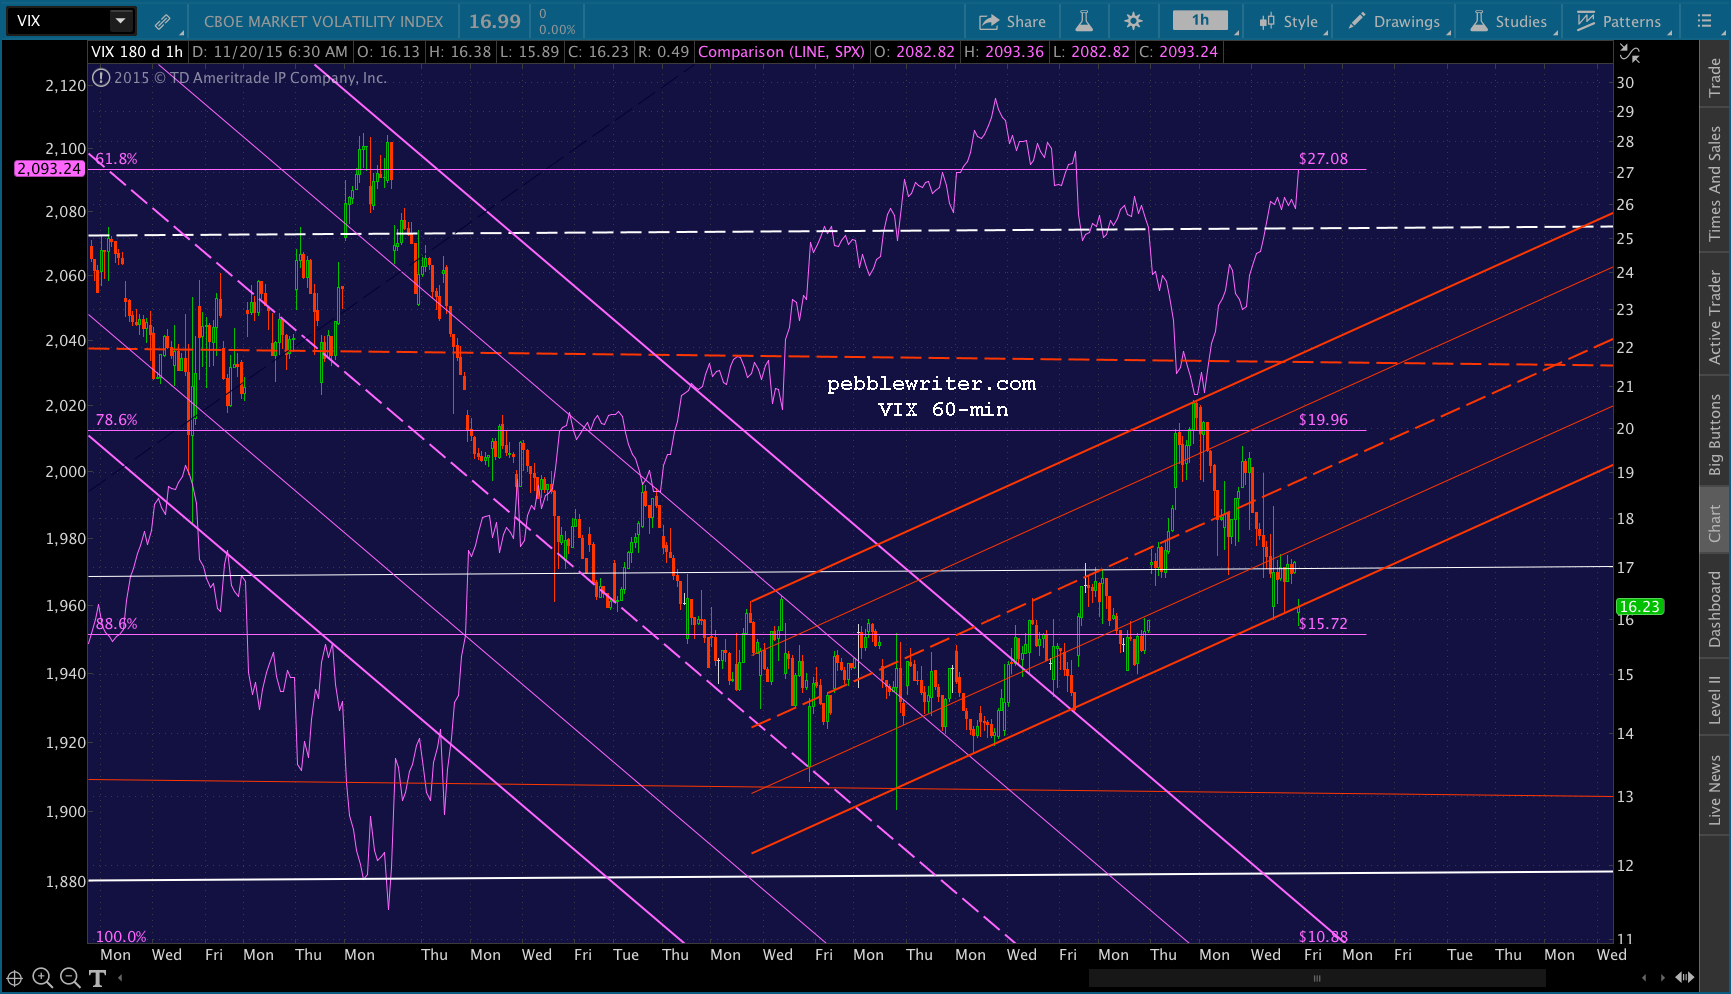 And, I wouldn’t think about shorting until CL backs off this morning’s ramp — which is how we’ll know when the algos have SPX where they want it.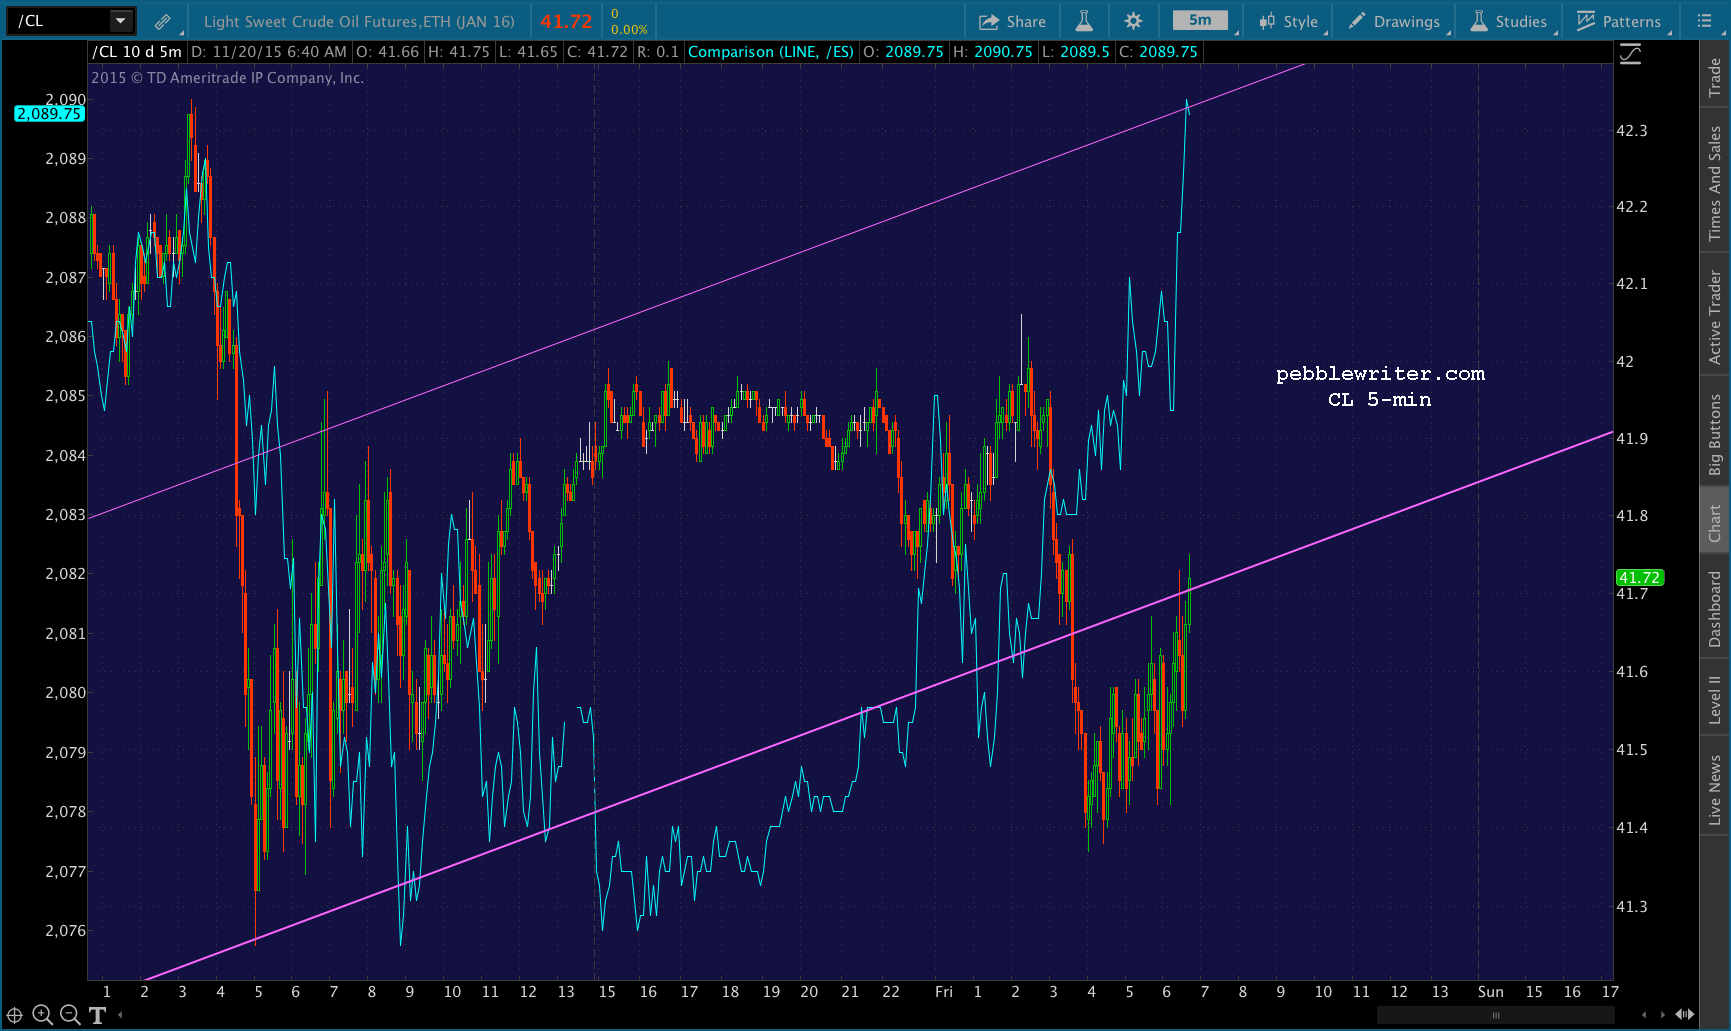
 There’s a very good argument to be made for completing a Bat Pattern today at the .886 (2105.41.) It certainly fits within the sharply rising purple channel. I’m more focused at the moment on the .786. I suspect SPX will top out just shy of it.
UPDATE: 9:51 AM
SPX just reached 2096.04. I’ll try a short position here, but will keep it on very tight reins just in case CL isn’t done.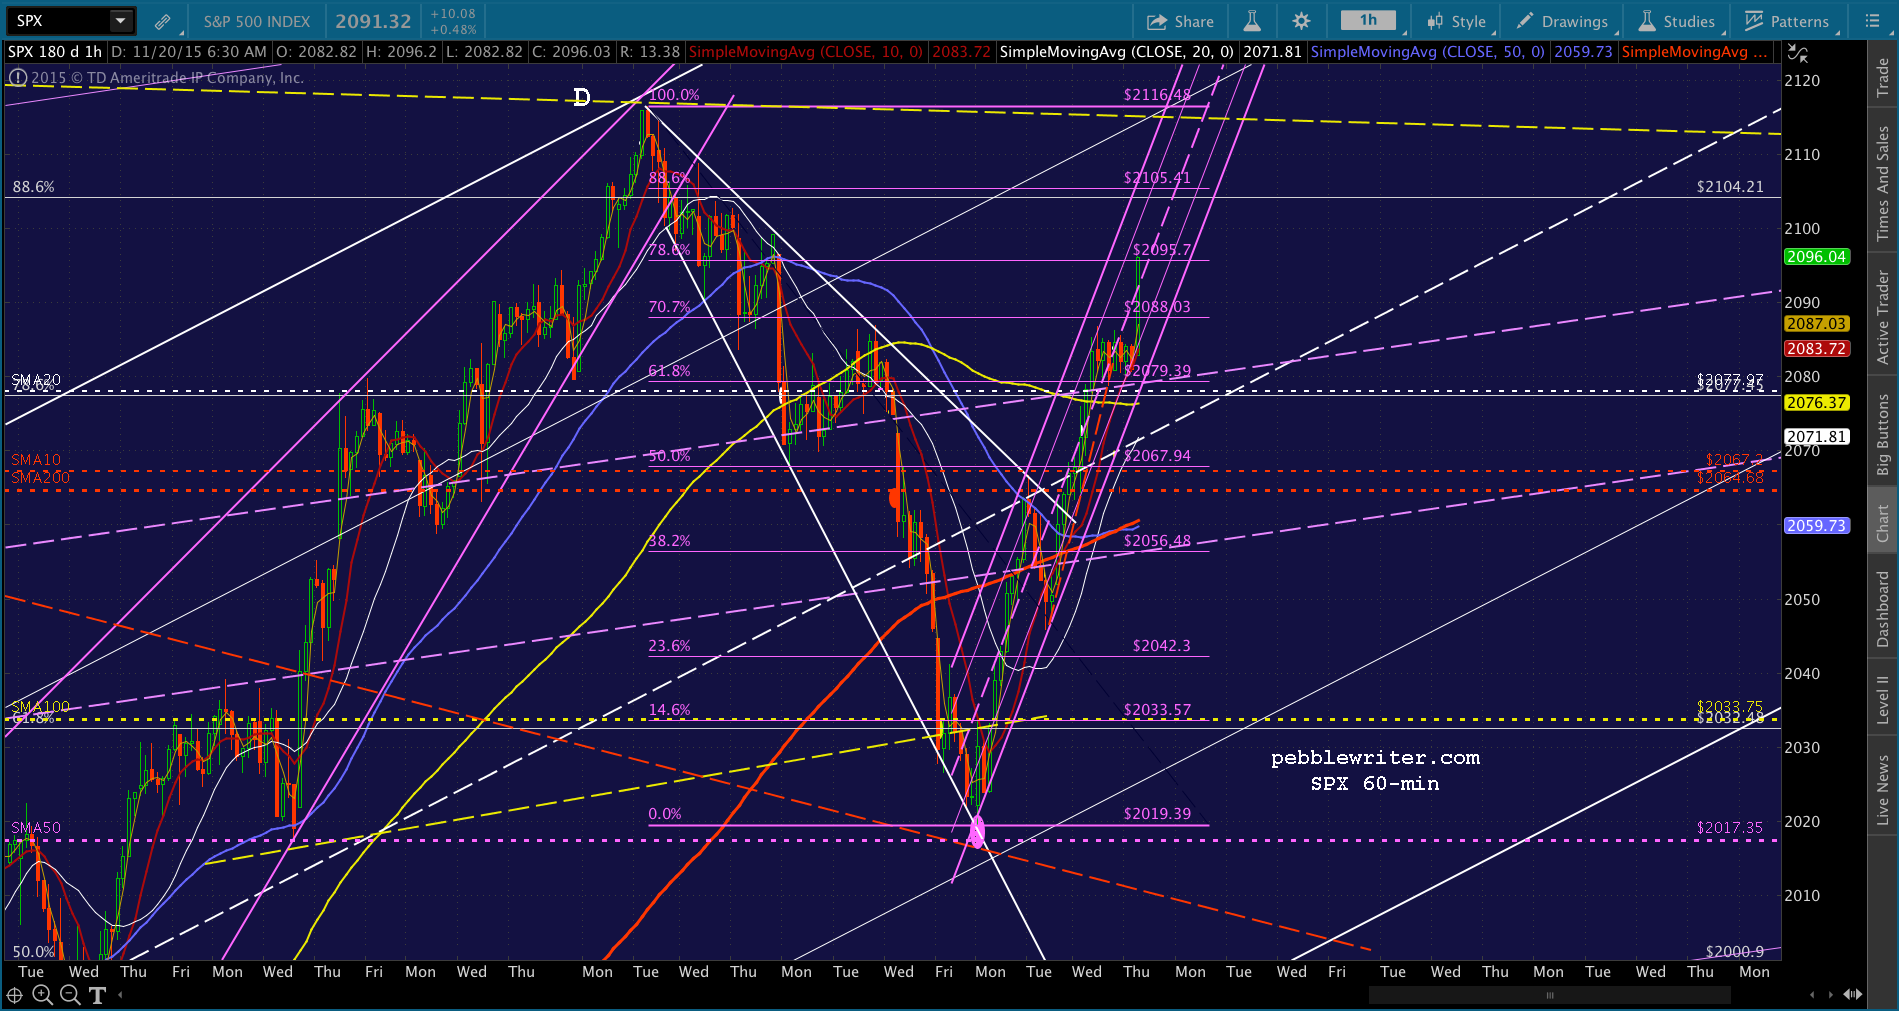 USDJPY and CL are backing off a bit, but no broken trends just yet.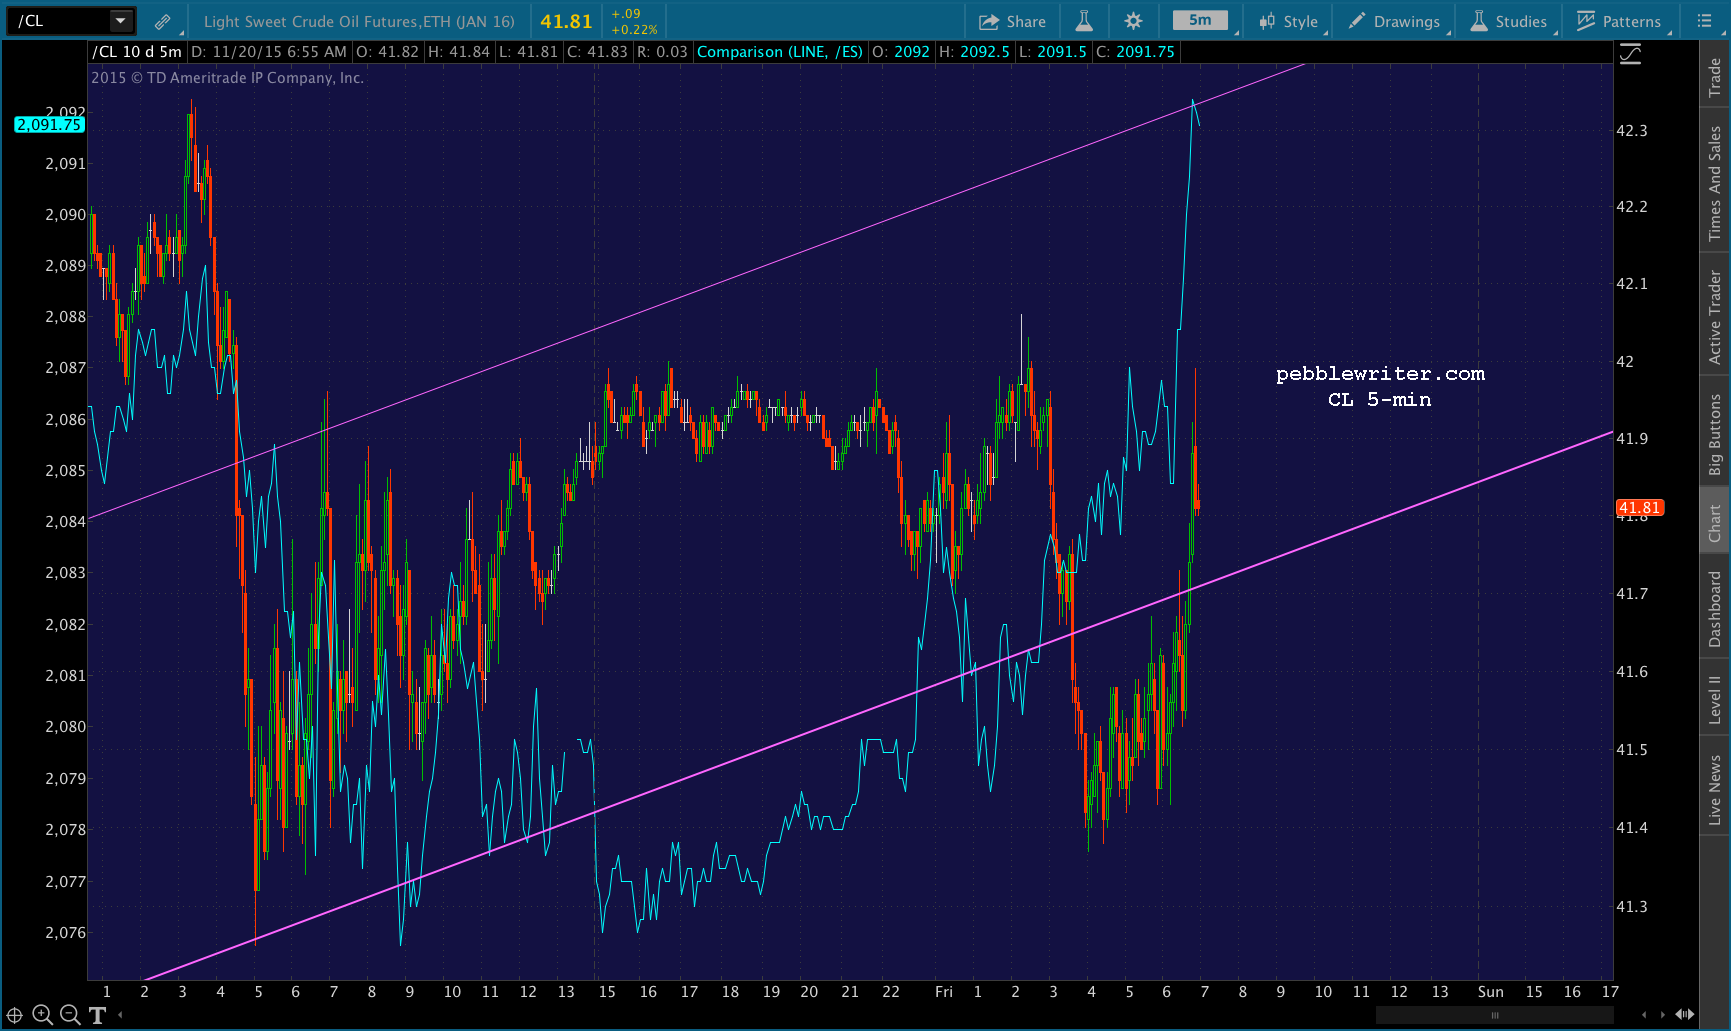
 UPDATE: 10:16 AM
I’m ditching the short position here and reverting to long. I suspect they’ll run it up to ES’ .886 at 2099.46. Note that it’ll happen about 3 points shy of SPX’s .886. Play along at your own peril, as this could also be a head fake.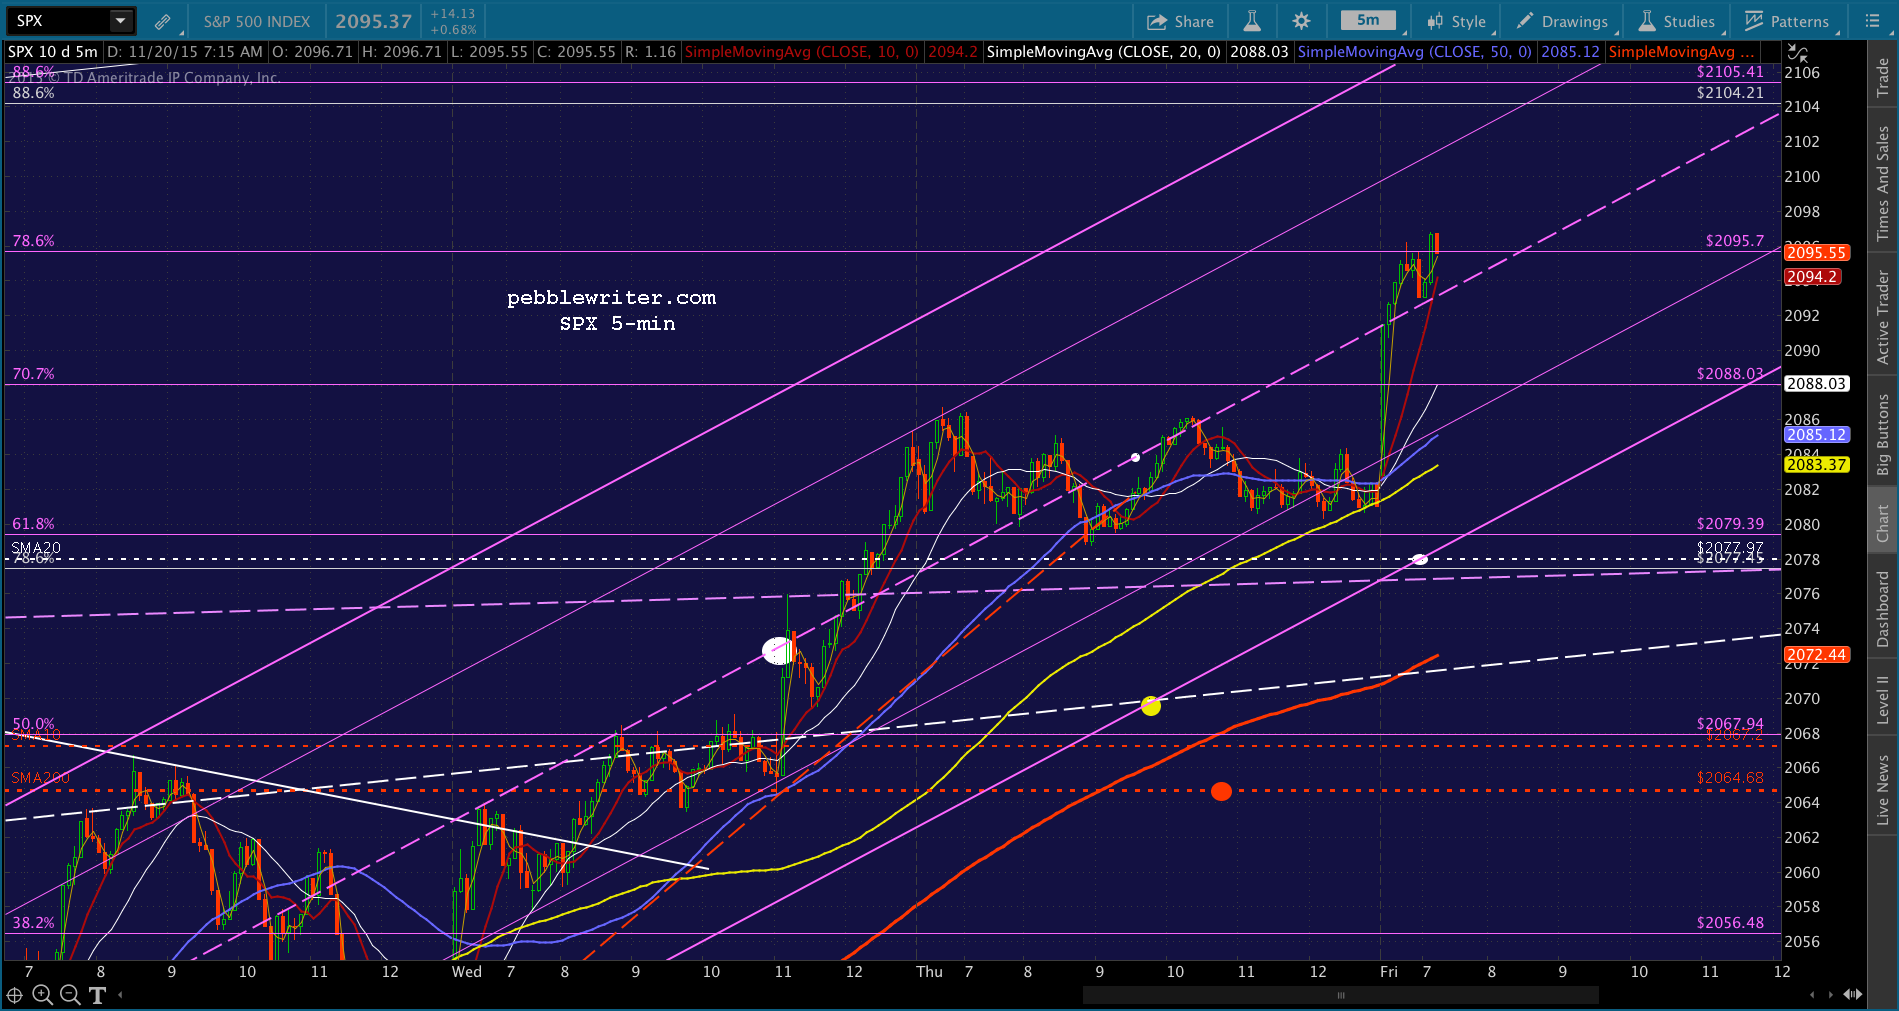 USDJPY is stuck below its SMA100 on the 5-min, and shows no signs of breaking out.
 This could be another one of those days, like yesterday, where the meltup just doesn’t stop, and there are no meaningful dips.
I’m under the weather, today, with a splitting headache. So, I’m not really up to monitoring each 2-3 point squiggle. I’m going to sign off, take some aspirin, and work on some other charts. Long with trailing stops is probably a safe stance to take for the remainder of the day — with the 5-min SMA10 (red) as a good guide for long/short decisions.
UPDATE: 2:56 PM
Just a quick update on where things are… After the 10:00 AM head fake, SPX has followed a well-defined channel lower. It’s been largely controlled by USDJPY and CL (no surprise) which have oscillated higher and lower in order to keep it in line. 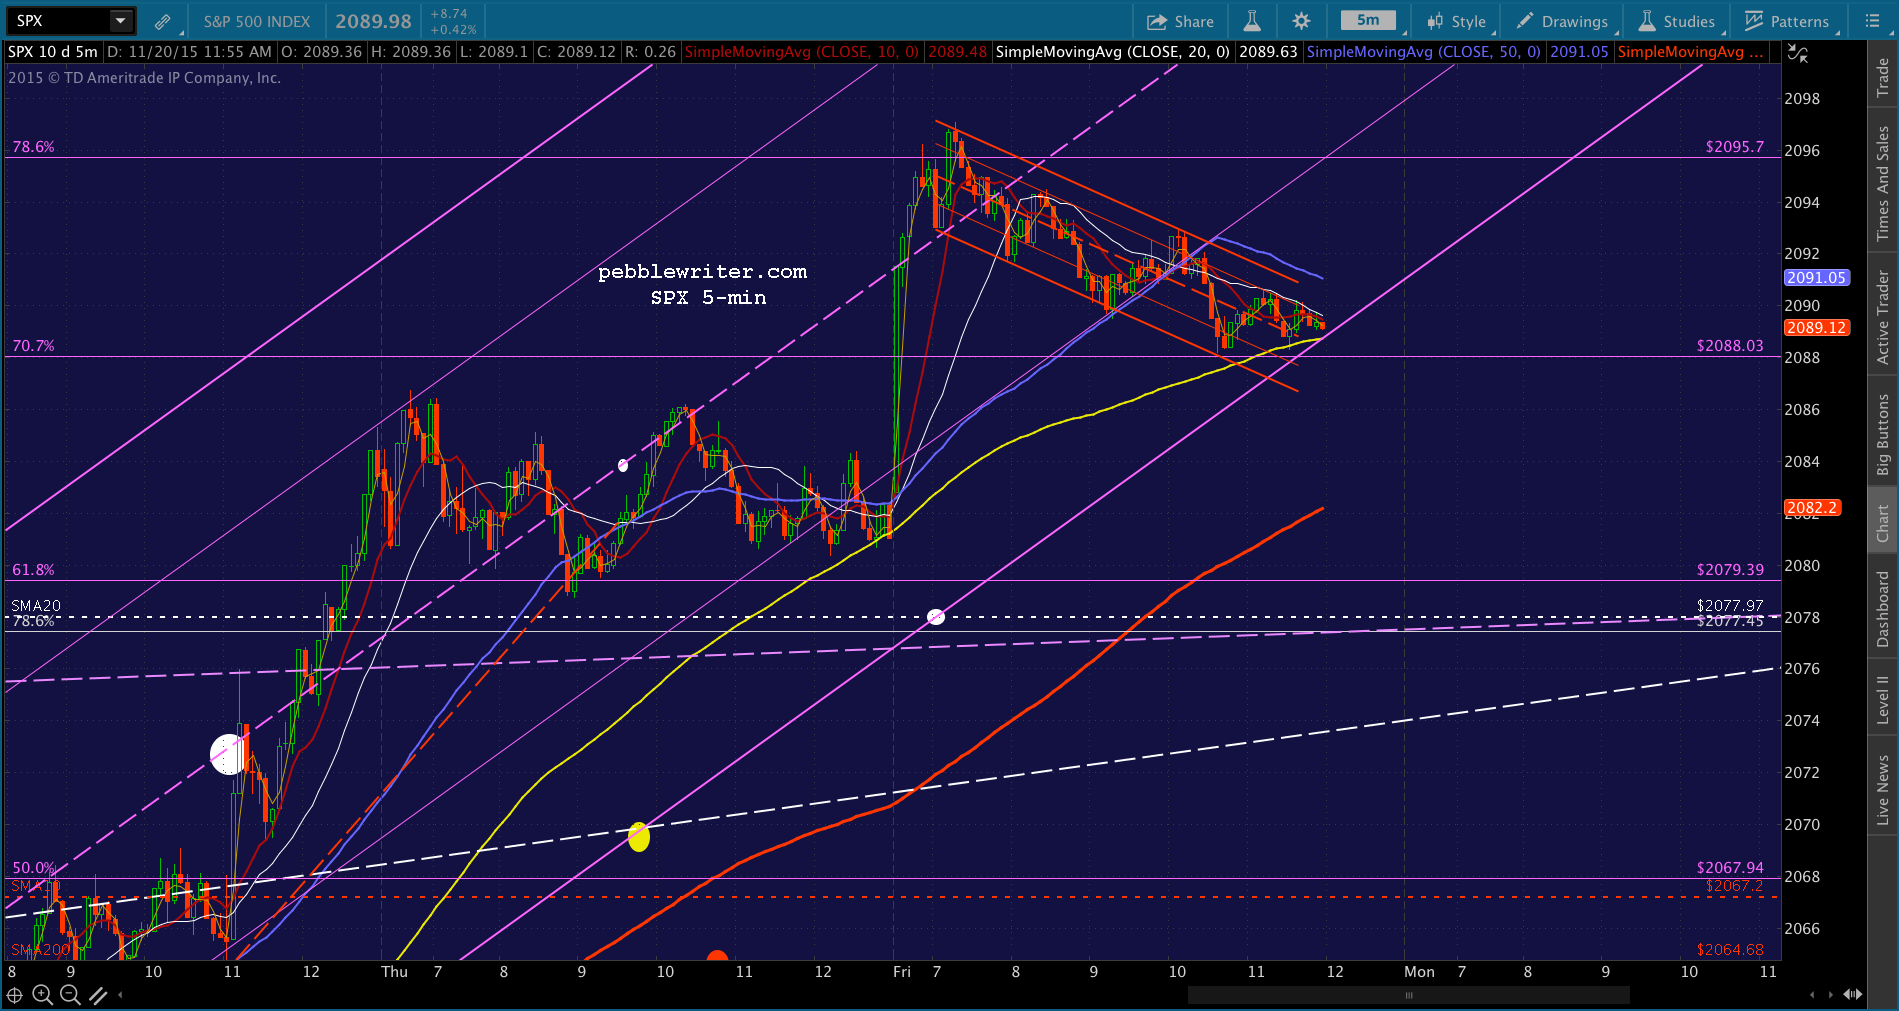
If the rising purple channel breaks down here, then there is support at the channel bottom (2086ish, the best target), followed by the 5-min SMA200 at 2082, the purple .618 Fib at 2079.30 and the SMA20 at 2078. It would be unusual for that kind of close on OPEX, but not unheard of.
If the channel holds, then a return to the .786 at 2095.7 would be the most likely result, followed by a meltup in the last hour to 2100-2105.
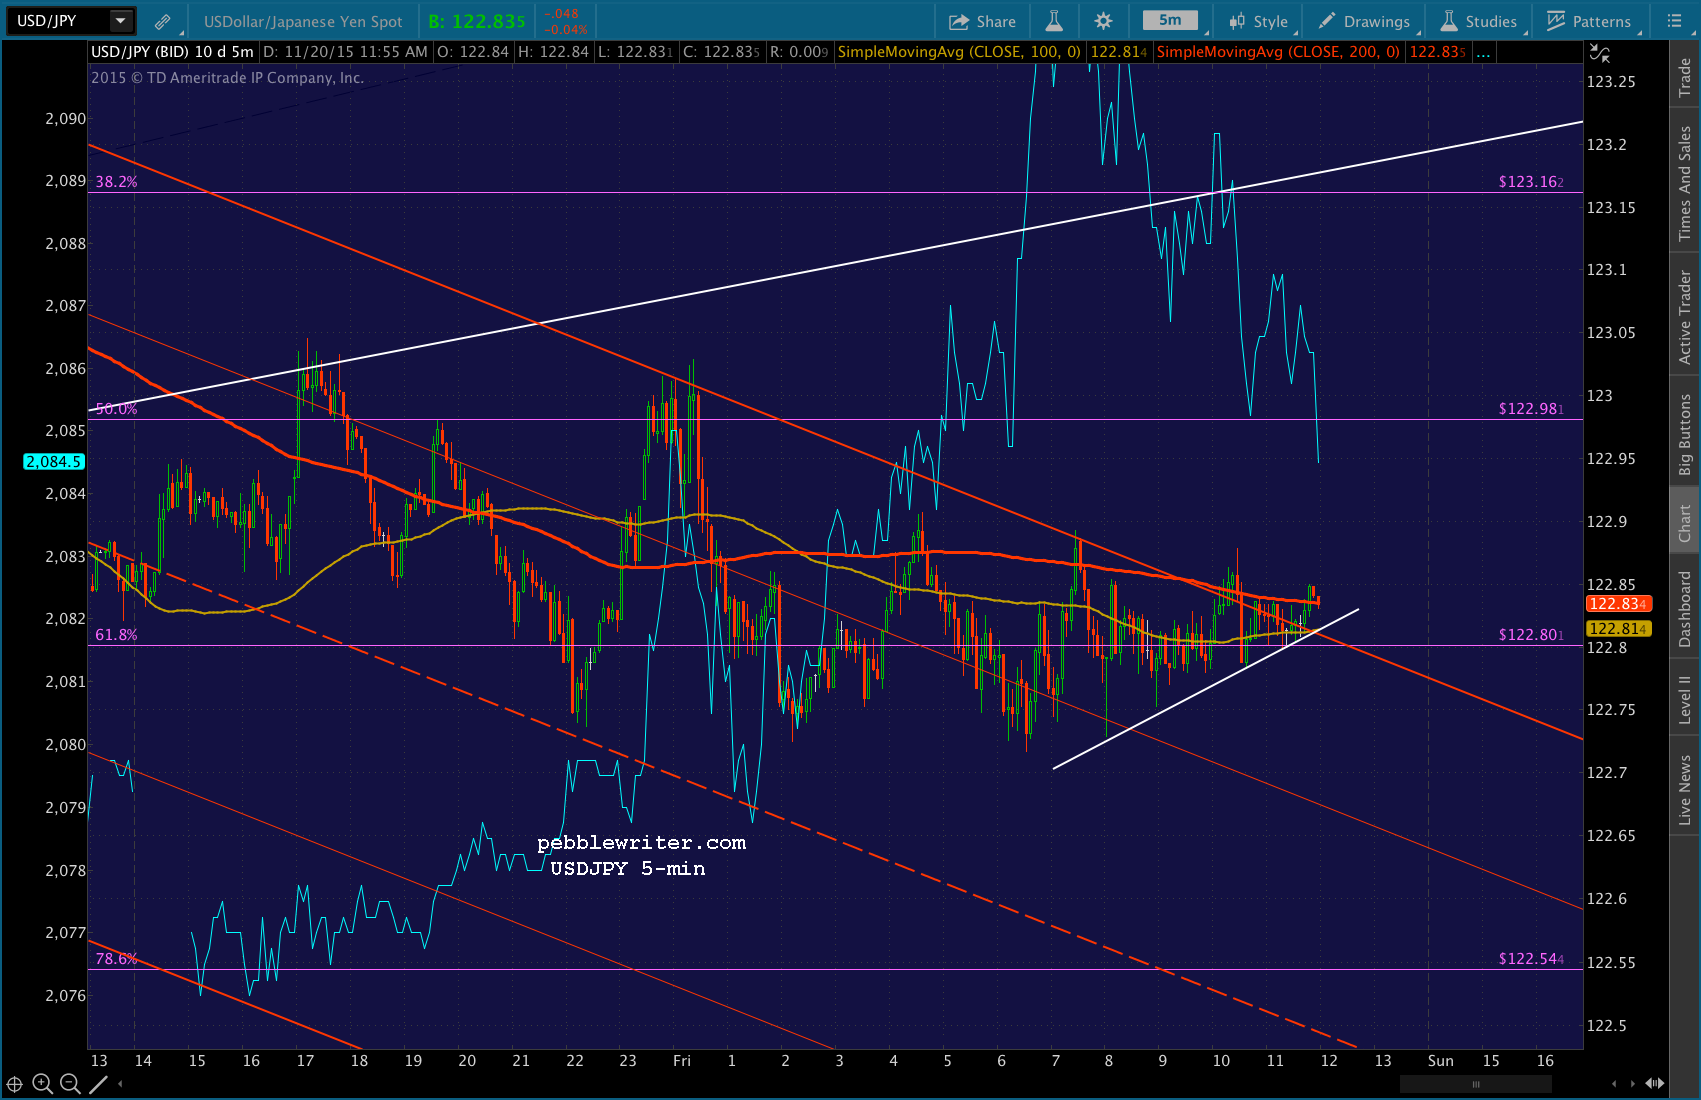
 I’m going to sign off again, but will post more later.
Comments
4 responses to “OPEX Friday”
how is spx and nikkei able to disconnect from usdjpy when its going down and reconnect with usdjpy whenever its going up?
Good question. In general, USDJPY’s declines come outside of SPX trading hours. ES is easily propped up or ramped higher after-hours due to its very low volume. I’ve written about this a lot in the past. Here are a few articles:
https://pebblewriter.com/what-really-drives-stock-prices/
https://pebblewriter.com/how-they-did-it/
https://pebblewriter.com/ratcheting-stocks-higher/
As for NKD, the futures trade at very low volume. Anything over 1,000/hour is unusual (ES routinely trades 200K per hour when the market is open.) It’s easily propped up when necessary, and frequently instigates spikes higher on pathetically low volume.
Where can we see max pain?
There are a number of websites that calculate it. I have no affiliation with any of them, but this one seems to be pretty widely followed: http://maximum-pain.com/stock/SPY.aspx