

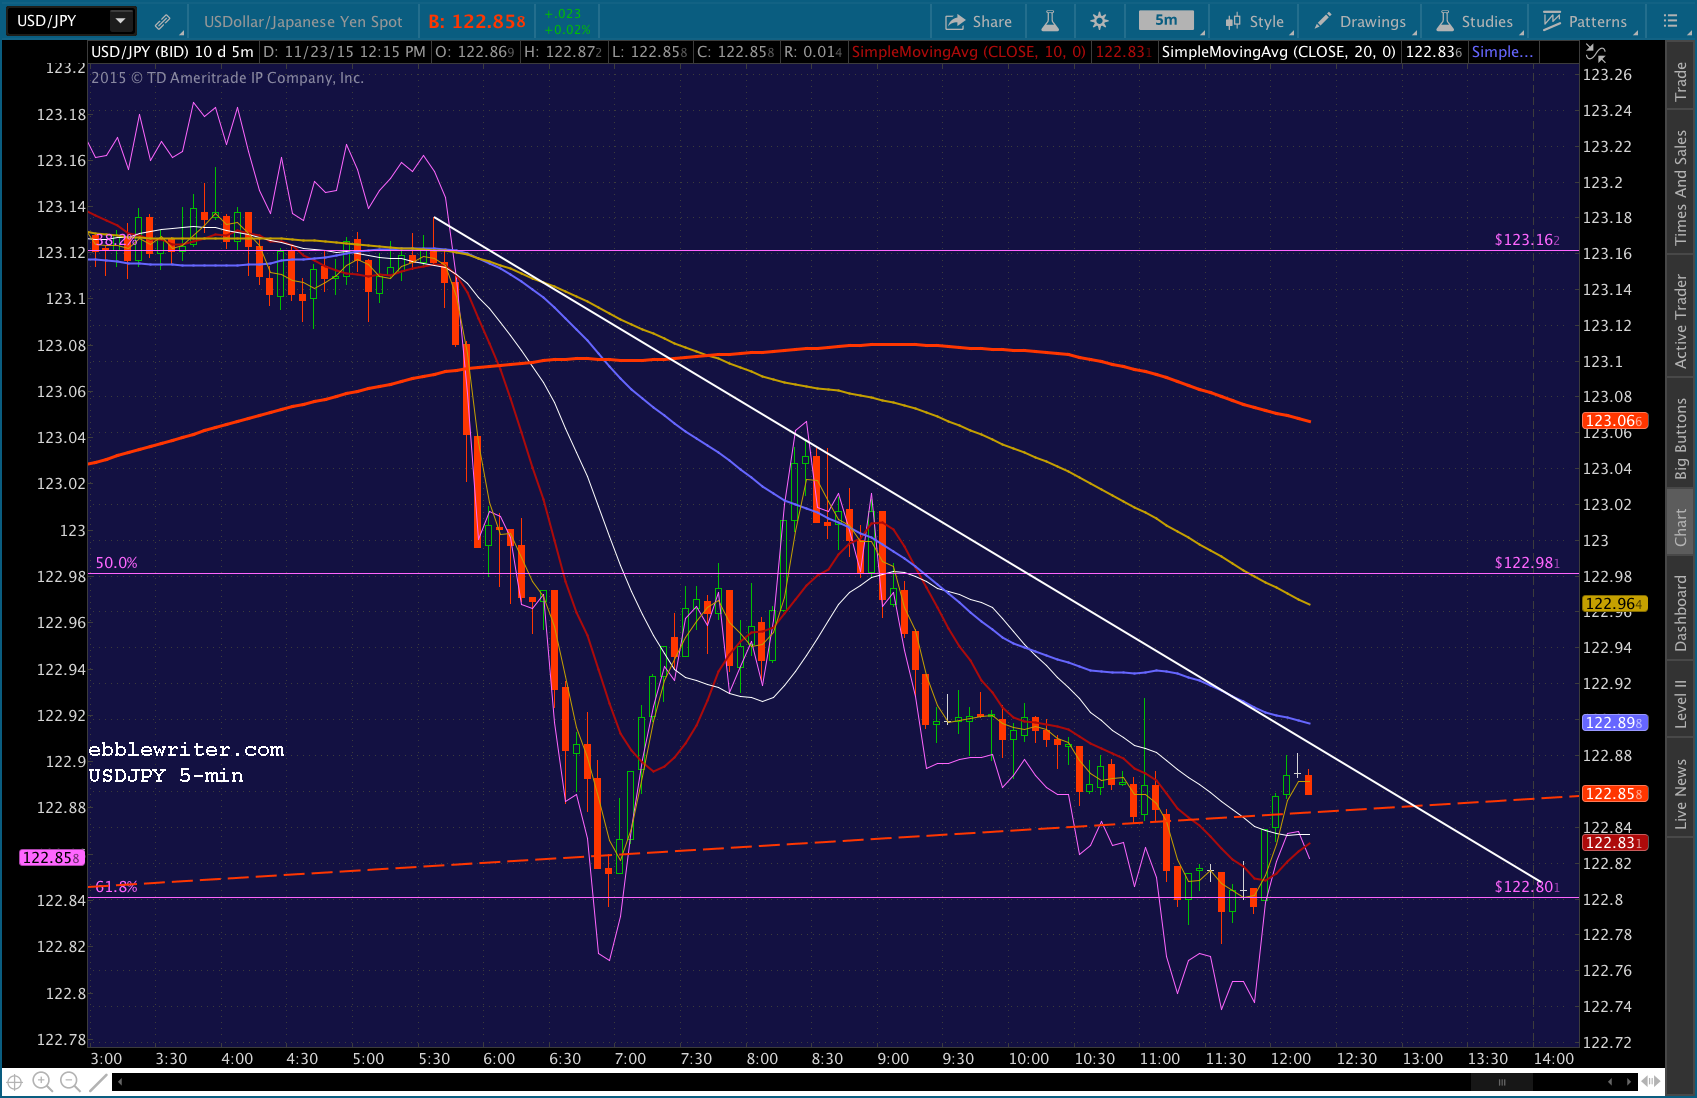
Since SPX completed a Bat Pattern on Nov 2 [see: Beware the Bat] it fell a normal enough 97 points to just below the .618 Fib. Though, as I recently pointed out, the bulk of those points came in gaps lower in the opening minutes and were, thus, only available to futures investors or those willing to hold short overnight — a dangerous game for many years, now. They also came almost entirely courtesy of a carefully controlled decline (purple channel) in USDJPY which merely took it from the top to the bottom of a steeply rising (white) channel. So, we took notice last week when the channel that’s guided USDJPY higher since Oct 15 finally broke down.
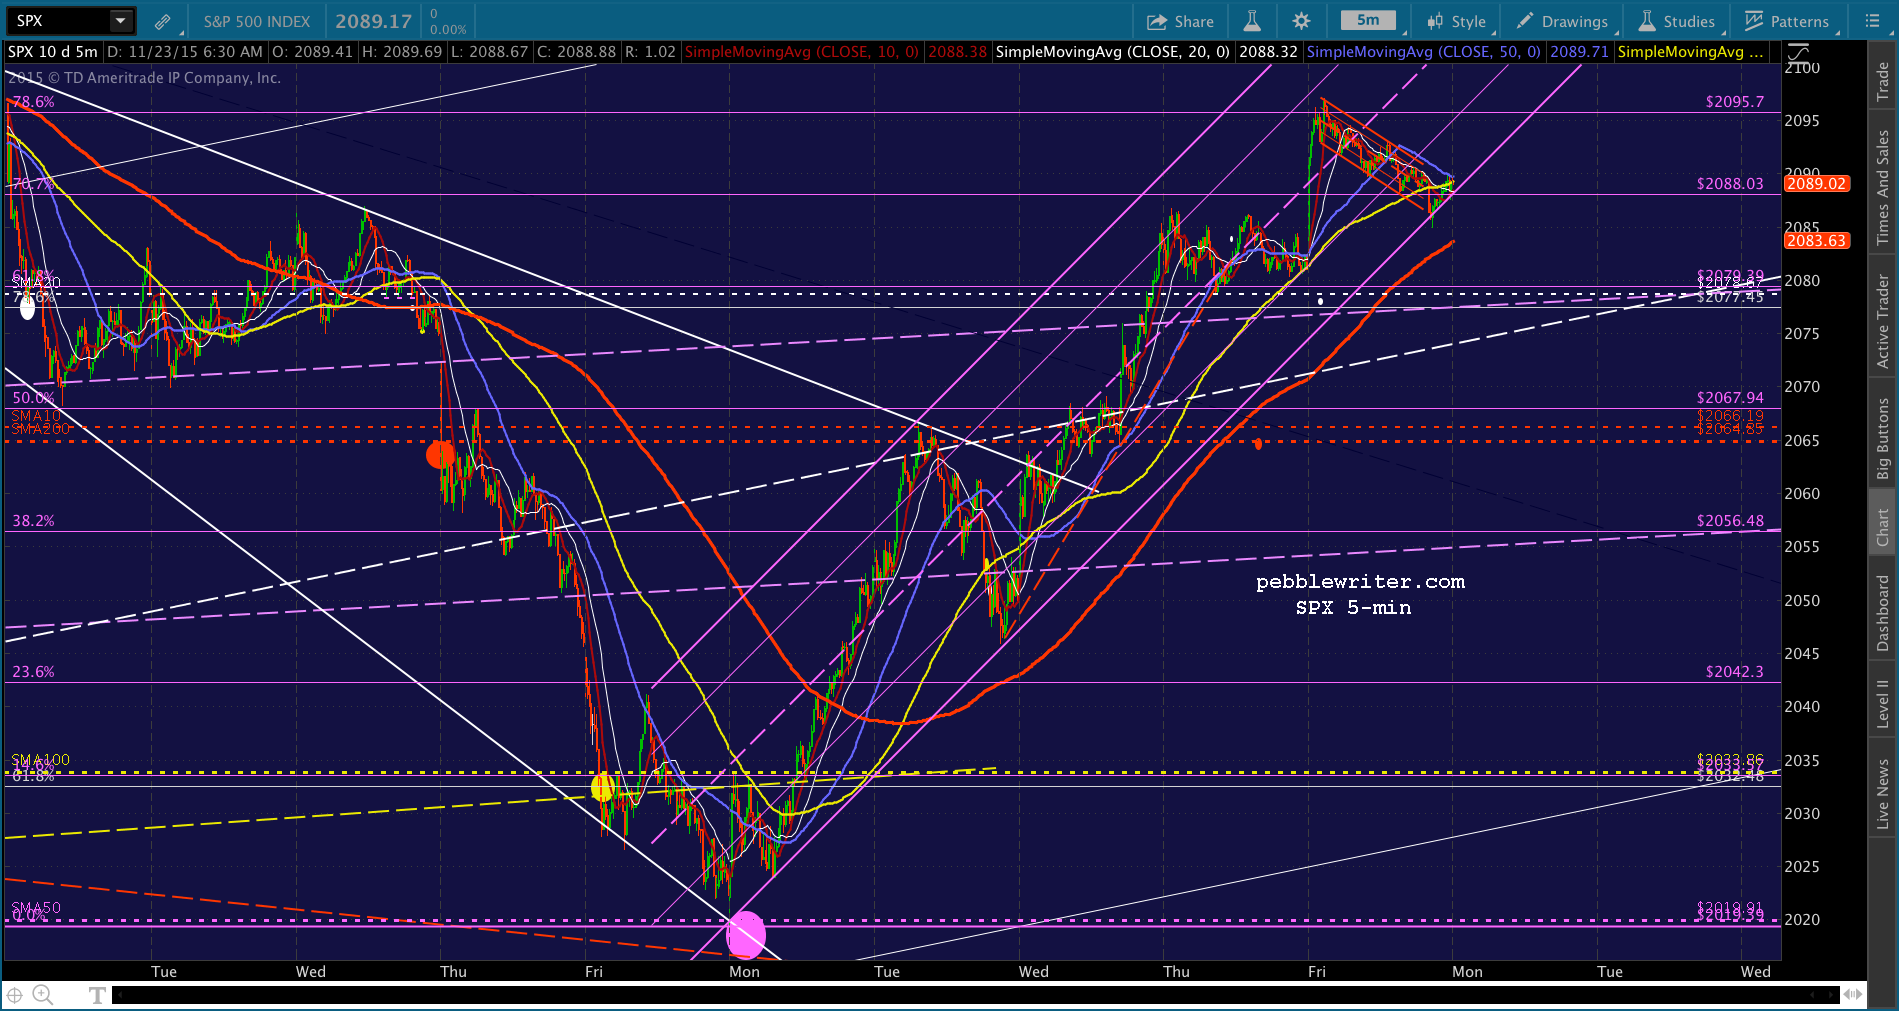
 Surely, it would precipitate an overdue drop in equities — or, at least make a dent in the acceleration channel that’s guided the 77-pt rally since the Nov 16 lows. But, that’s not what TPTB had in mind at all.
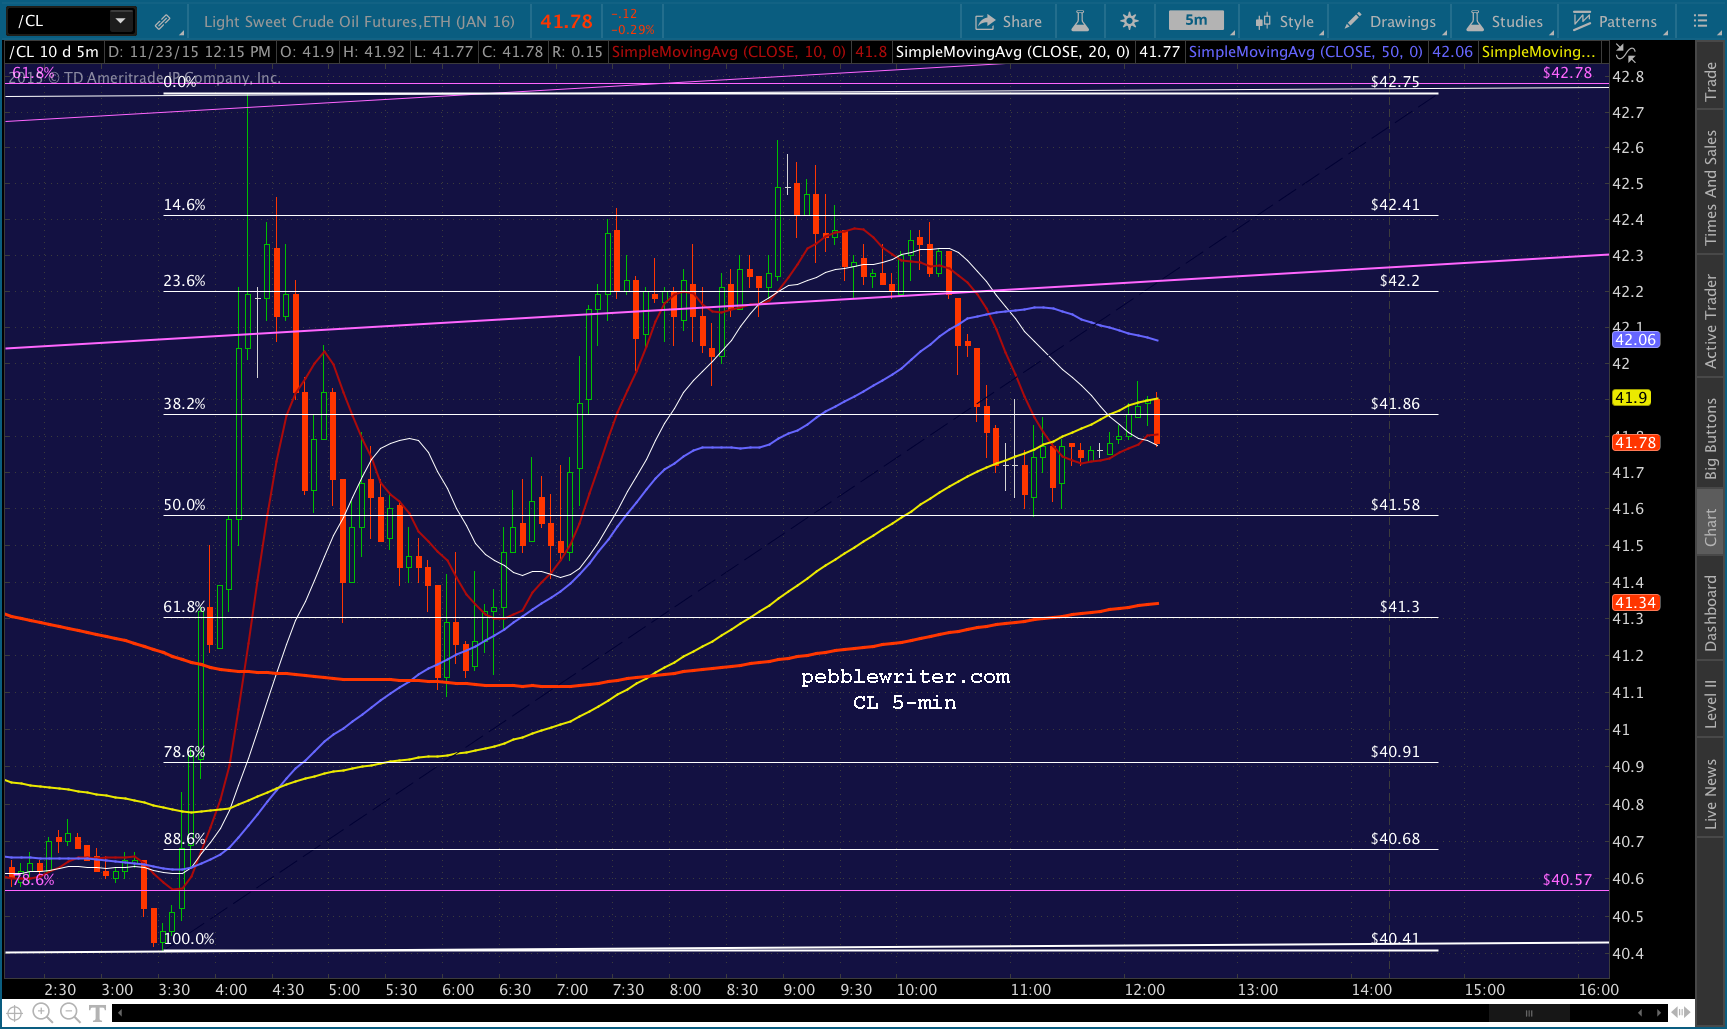
As we anticipated on Nov 13 [see: Why Oil Should Bounce Here] CL bottomed out and began a vigorous 7% bounce that, combined with well-timed USDJPY ramp jobs, produced just enough reason for the algos to stay happy. Thus the melt-up was spared any unsightly divots.
continued for members…
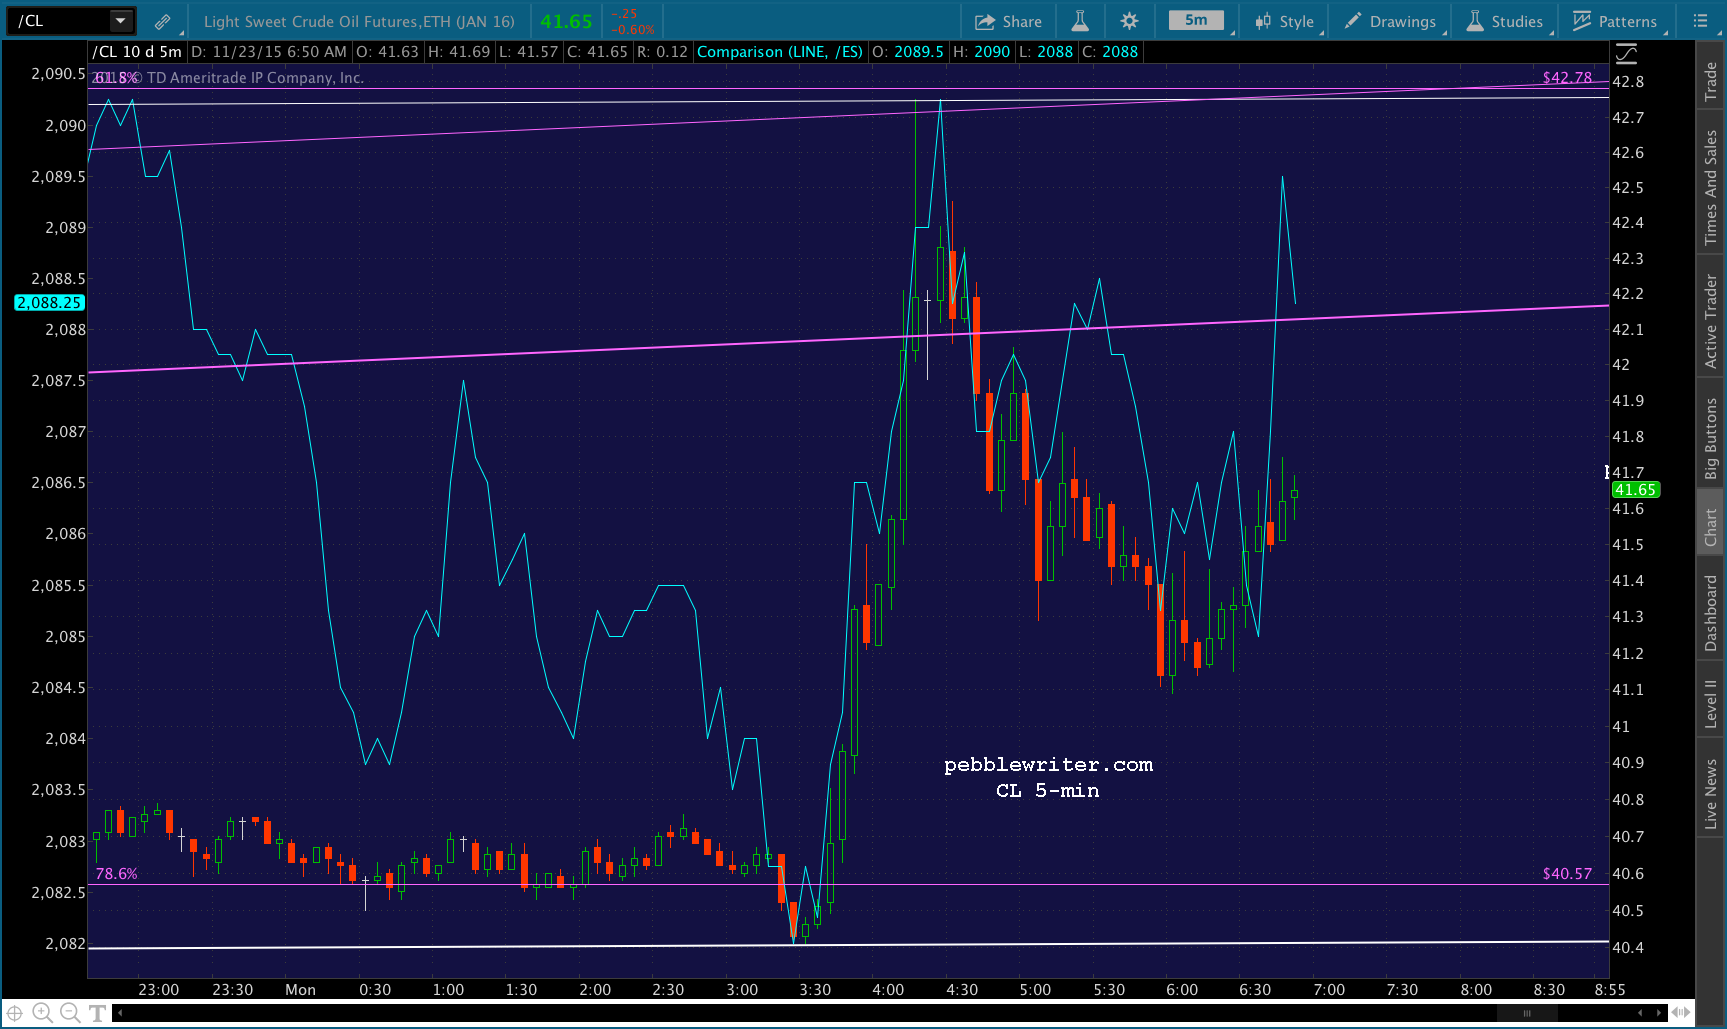
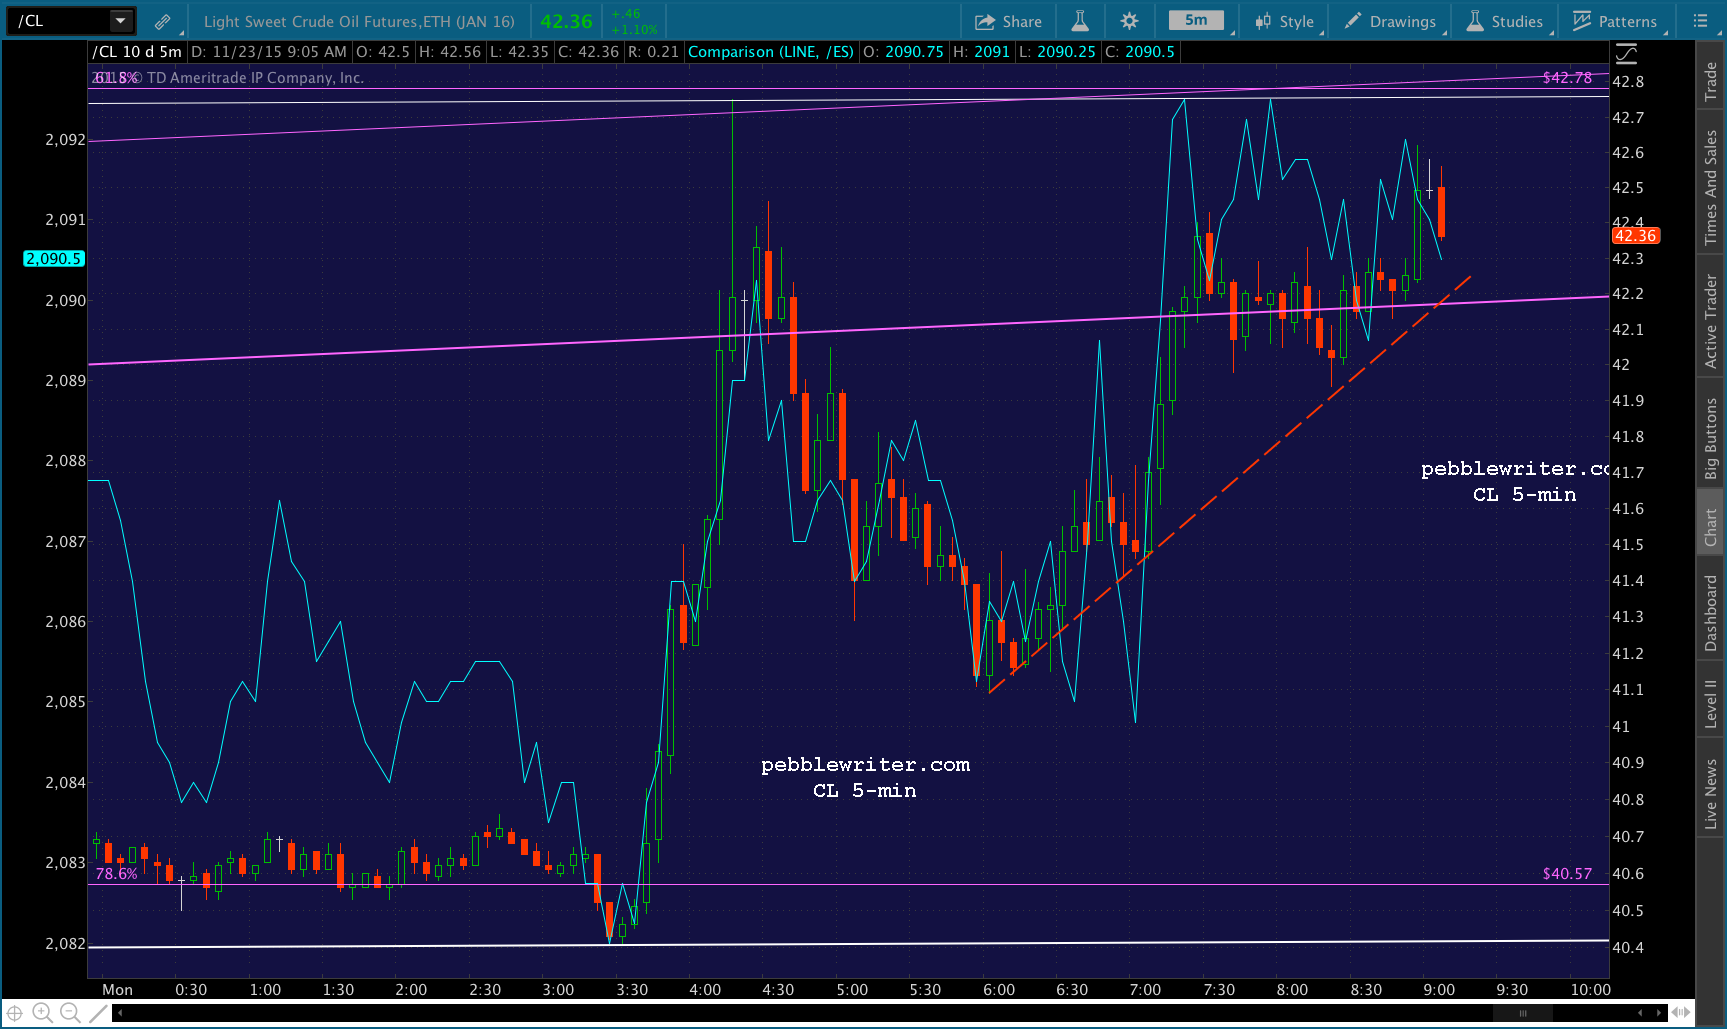
 What CL gives, however, it can just as easily take away. Note that the rising purple channel broke down over the past few days. Only by Saudi Arabia’s Draghiesque insistence that they’ll do whatever it takes to support oil prices has CL held the same channel bottom support that provided the Nov 16 bounce.
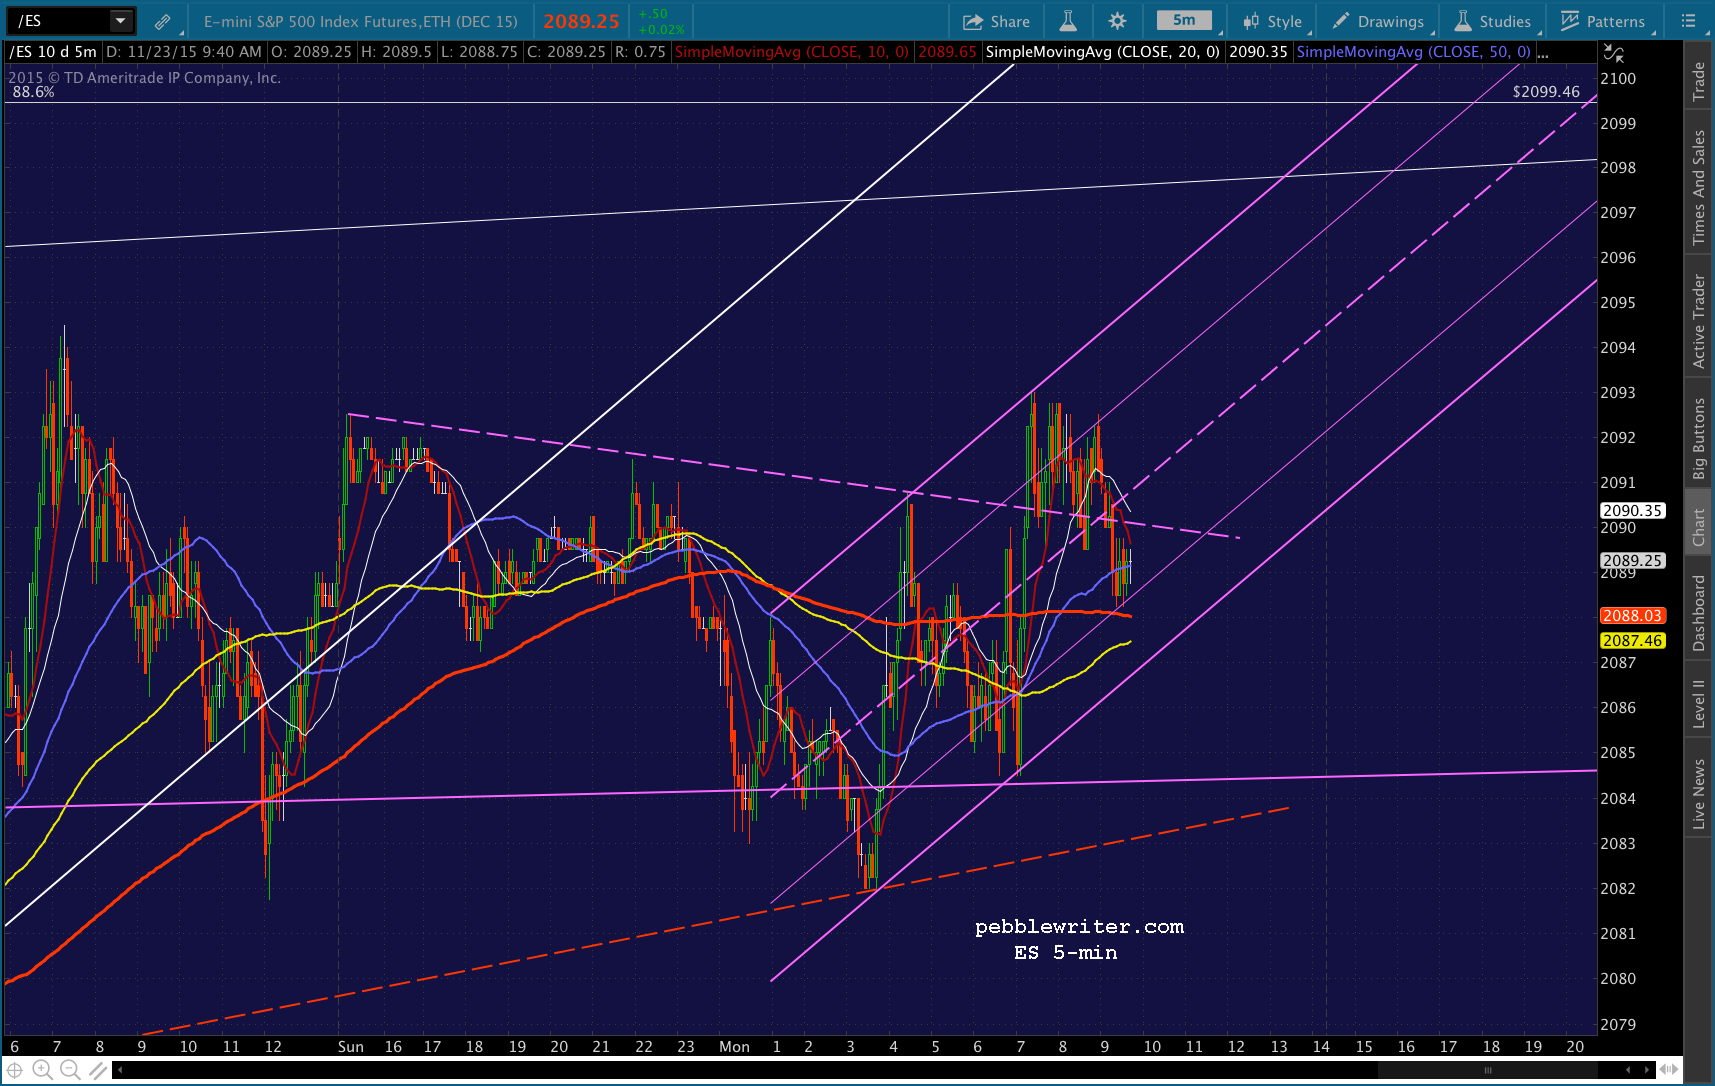
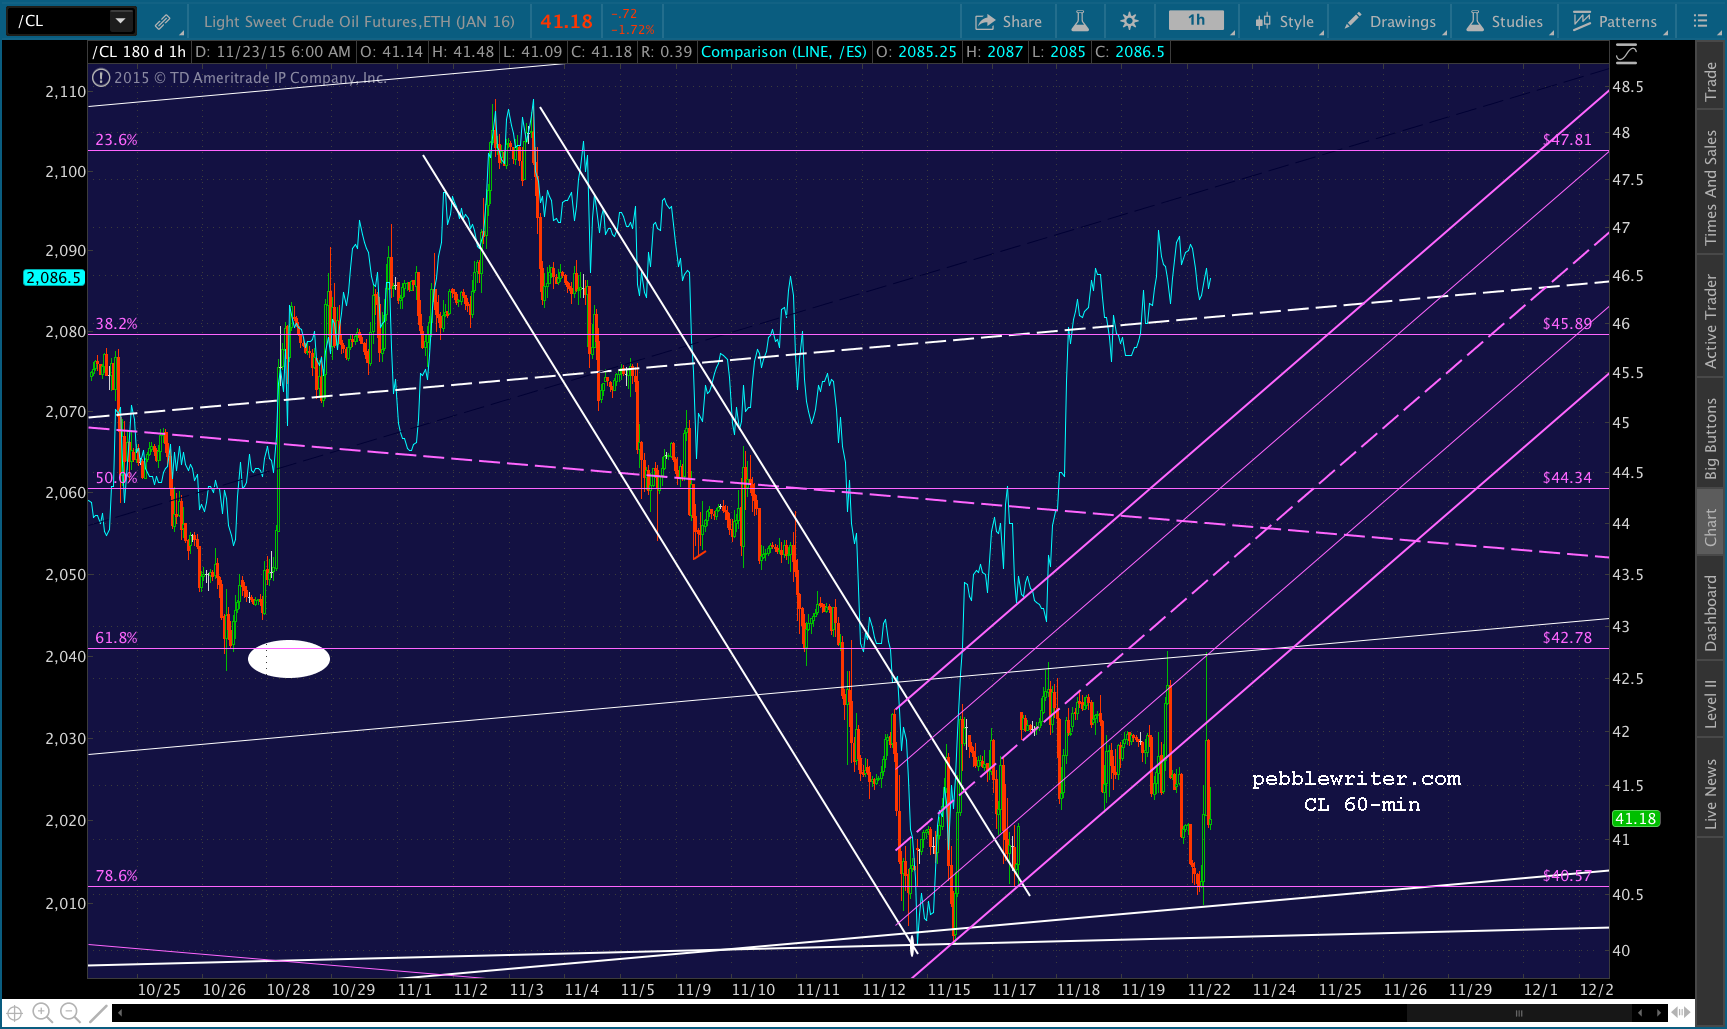 It knocked the futures for a loop earlier, but they’ve recovered to a 2-pt loss. Might this finally be the chance we get for a backtest? ES at the SMA20 at 2074.46 looks like a good possibility — though a backtest of the broken megaphone to the white .886 at 2099.46 is just as appealing.
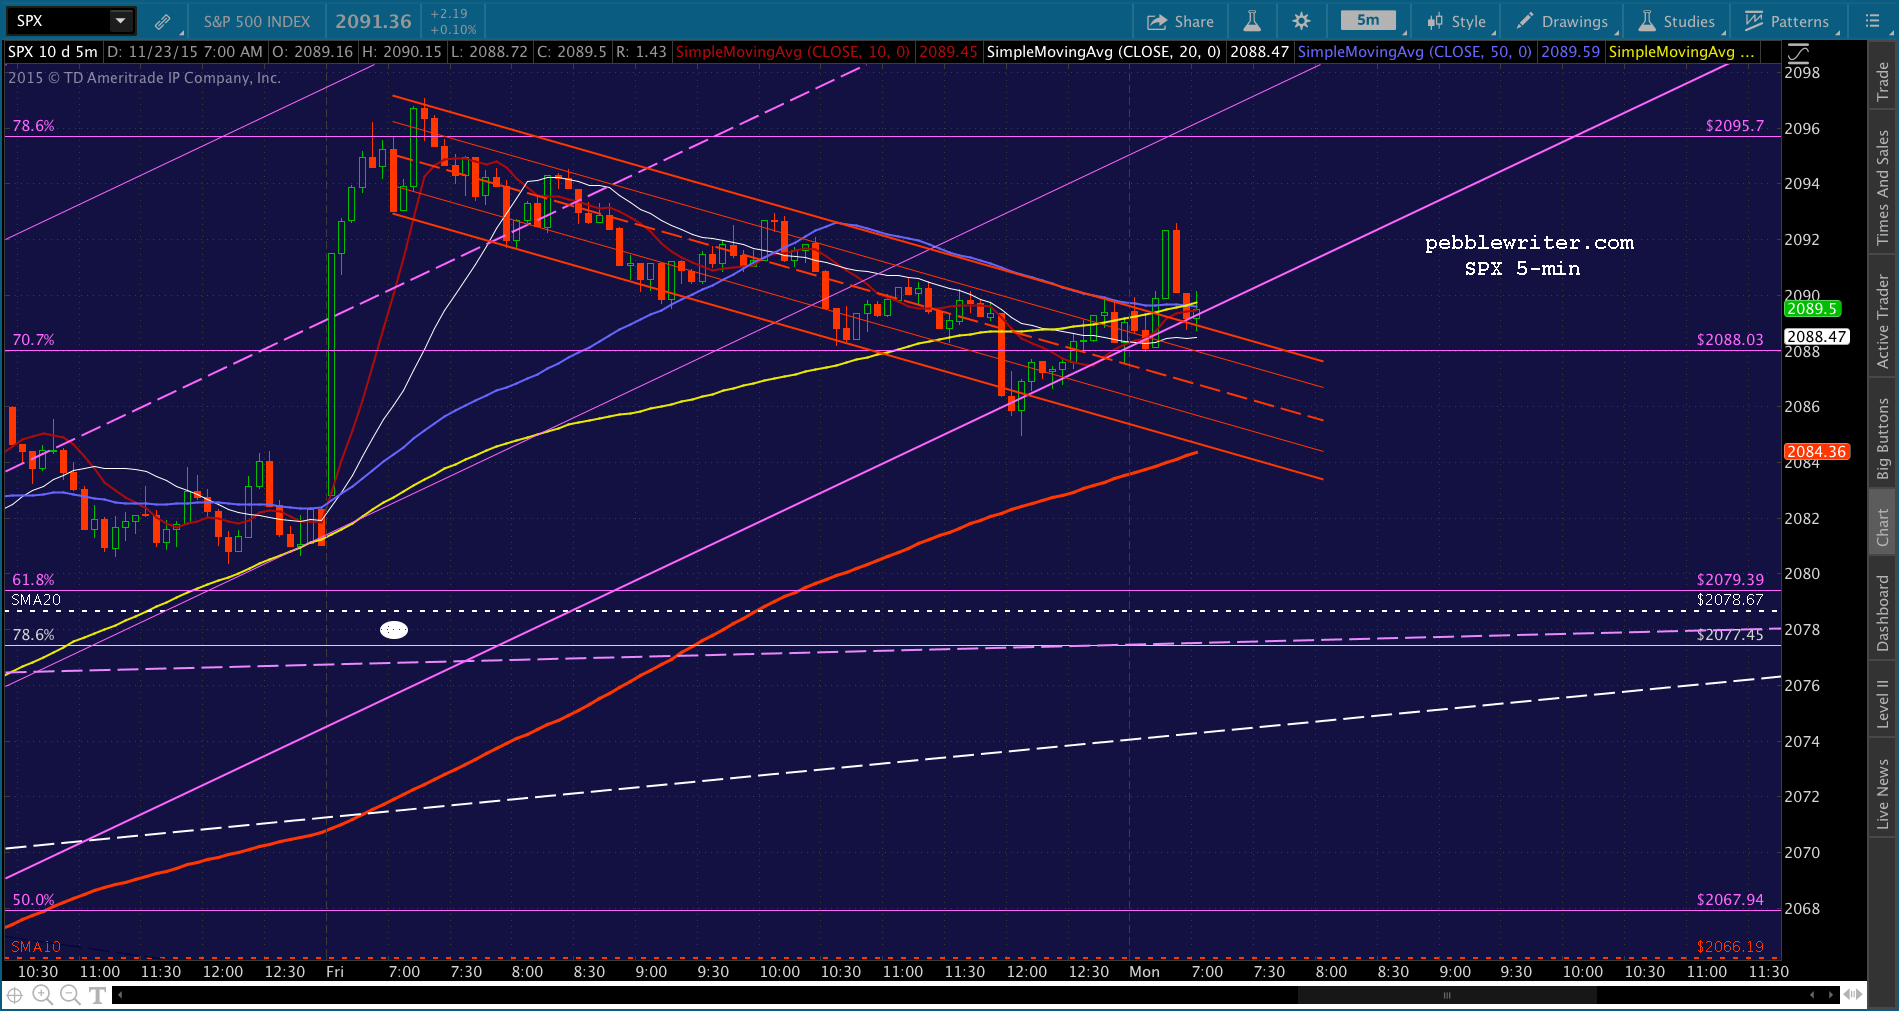
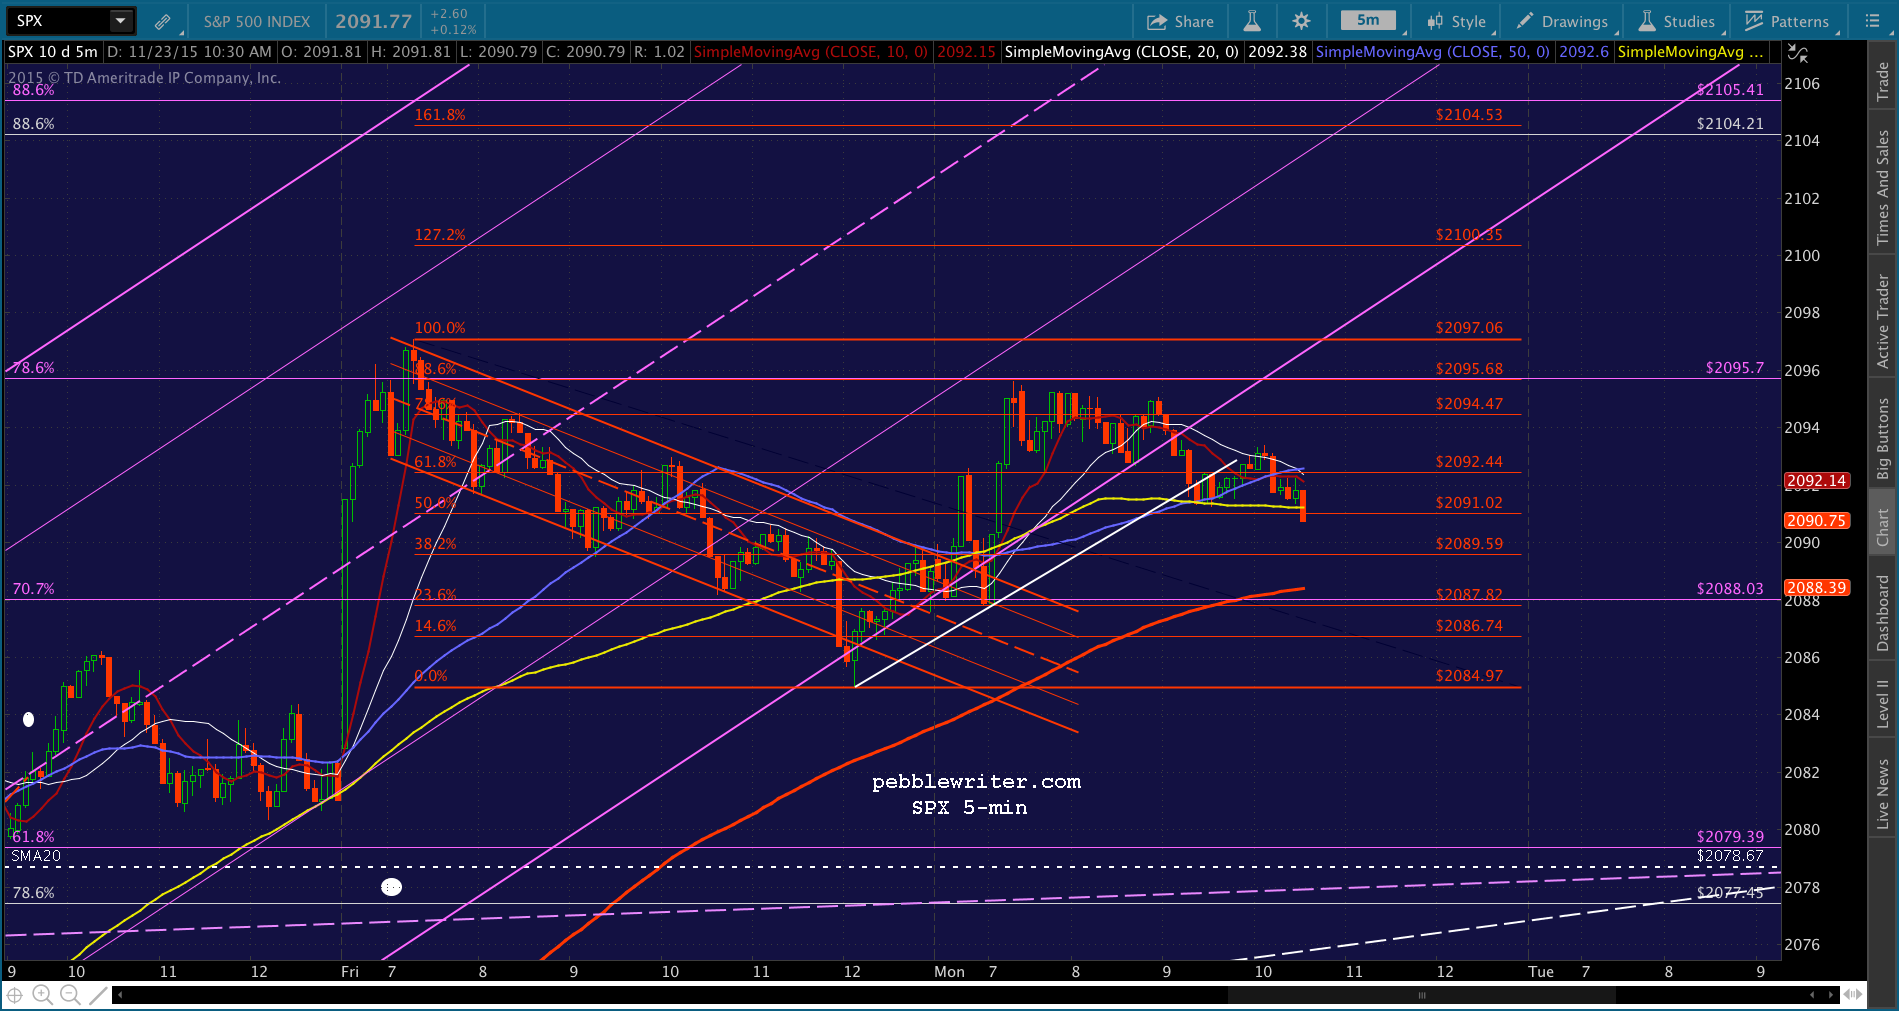
 SPX, likewise, has the potential to tag its at 2078.67. But, until its purple channel breaks down, we should assume that TPTB are aiming for a completion of an IH&S up at 2113ish (the dashed yellow line.) If it completes and plays out, it points to SPX 2372.
 The key this morning should be USDJPY which, if it drops below the red TL below, will facilitate SPX’s decline. If it bounces, nothing doing.
 I’d start the day short, and see if we can get any traction. Initial support should come at the bottom of the red channel – potentially where it intersects the 5-min SMA200 at 2084ish.
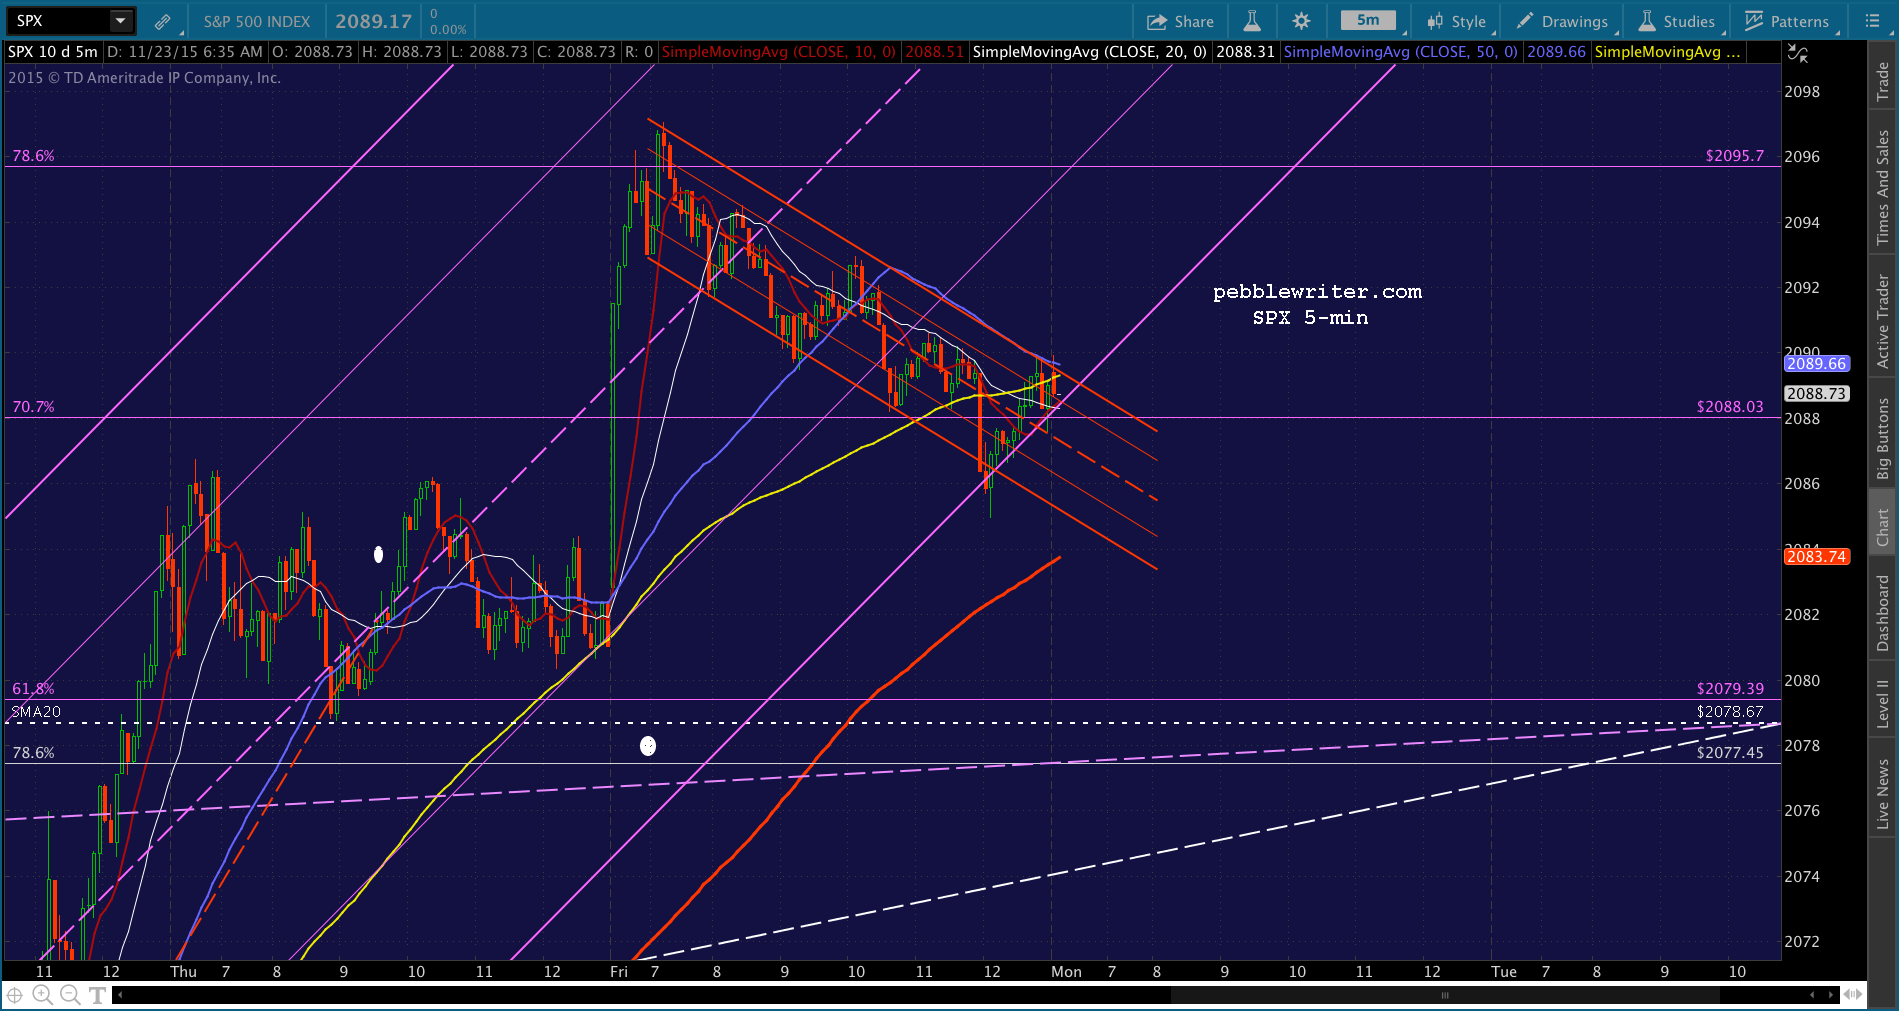 UPDATE: 9:53 AM
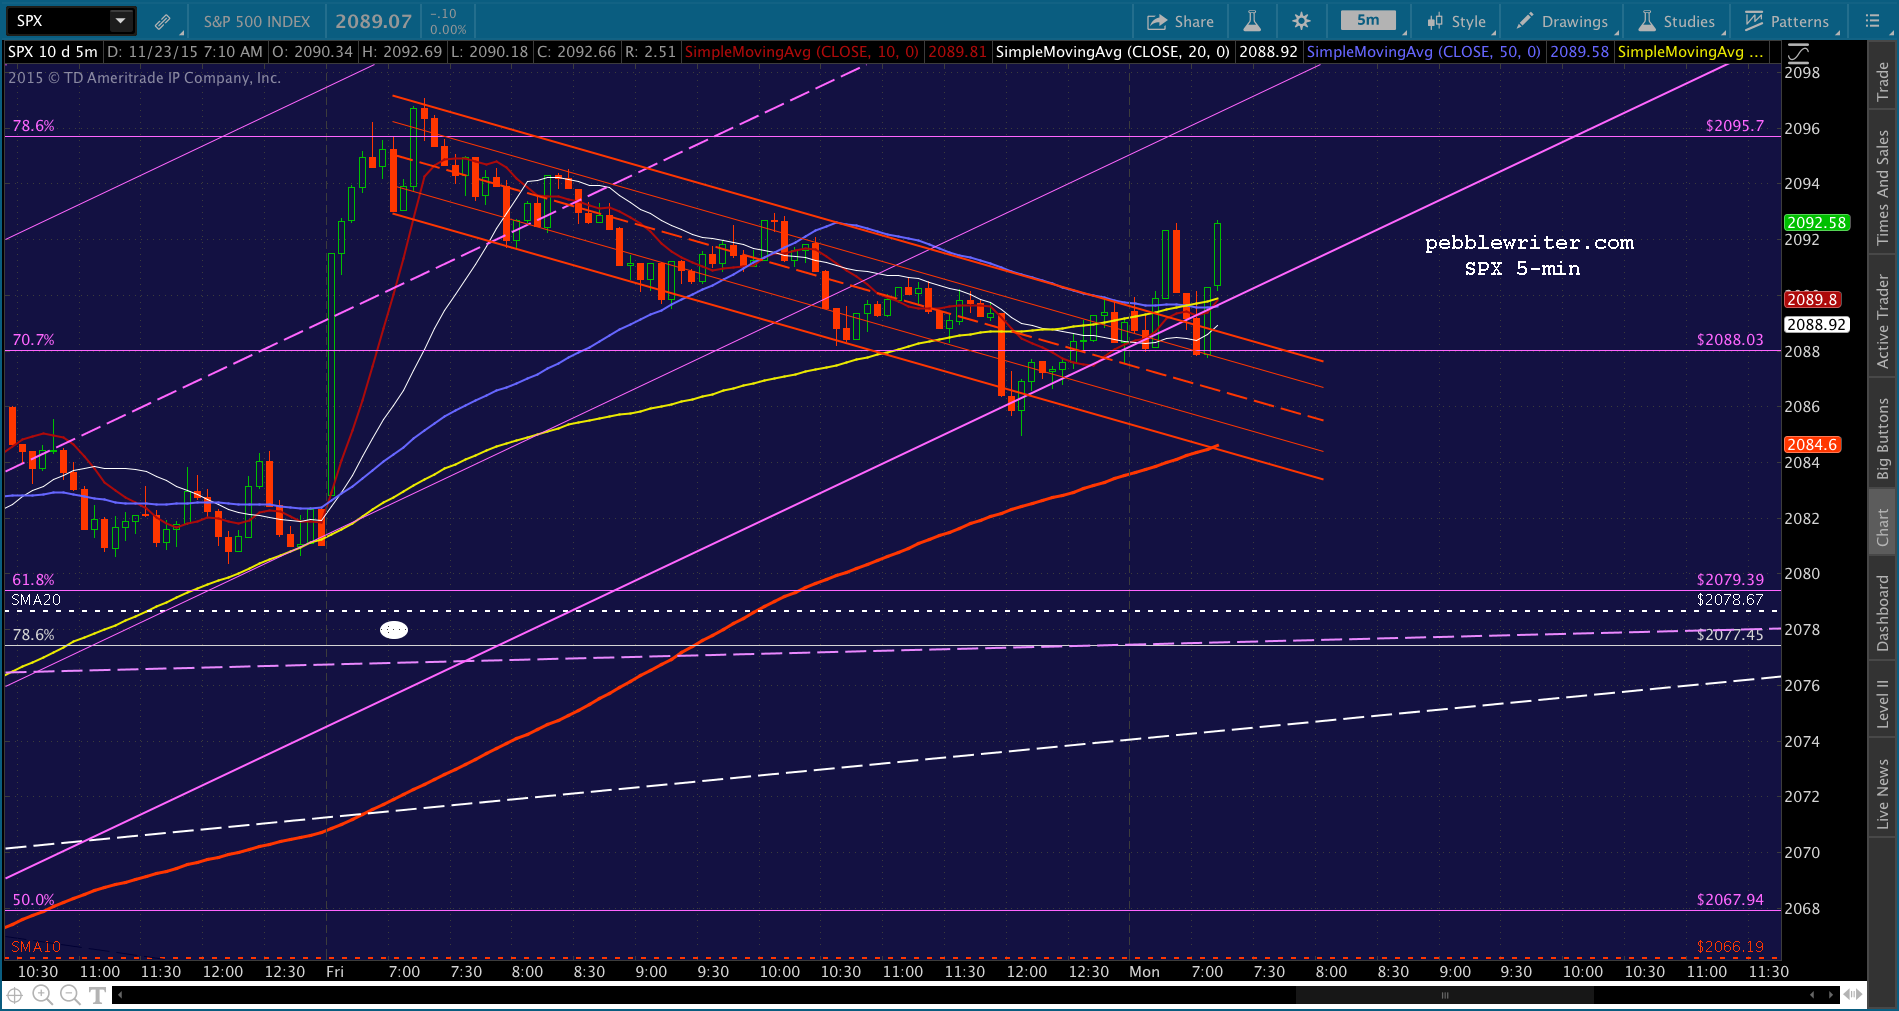
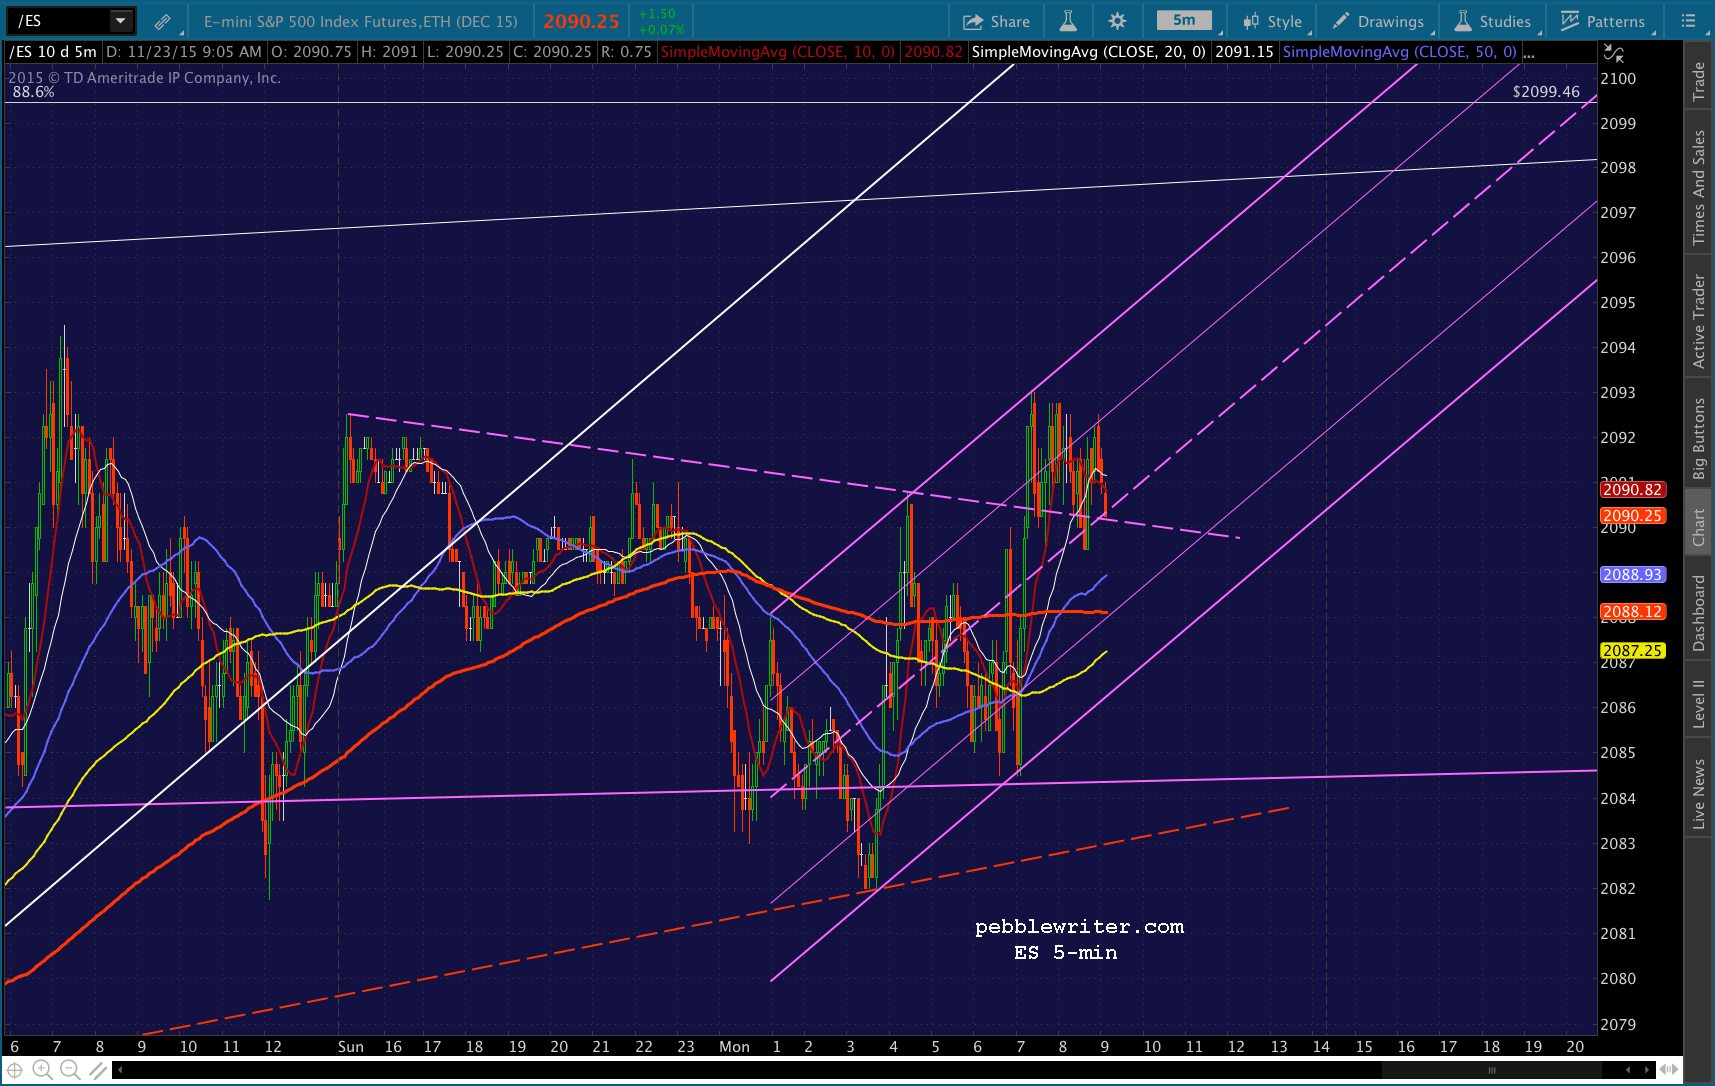
SPX broke out, and is returning to backtest the red channel as USDJPY drops below its red TL. Most traders probably assumed that USDJPY’s TL would hold. They usually do. If it doesn’t, our downside target should be good to go.

 Note that ES has set up a nice little potential IH&S that targets the .886 at 2099.46 (in addition to the traditional H&S targeting 2066.)
UPDATE: 10:00 AM
SPX trying to decide about USDJPY’s TL. It could break either way. But, the fact that USDJPY stopped at that .618 Fib line and bounced back above the TL — even for a minute — has me nervous about out short. Keep this one on a tight rein folks.
 UPDATE: 10:15 AM
SPX has broken out again, though ES still hasn’t poked above its purple neckline. I have a strong suspicion this is a head fake, as we’ve often seen early in the morning, lately. But, the safe play is to close the short and play along on the long side.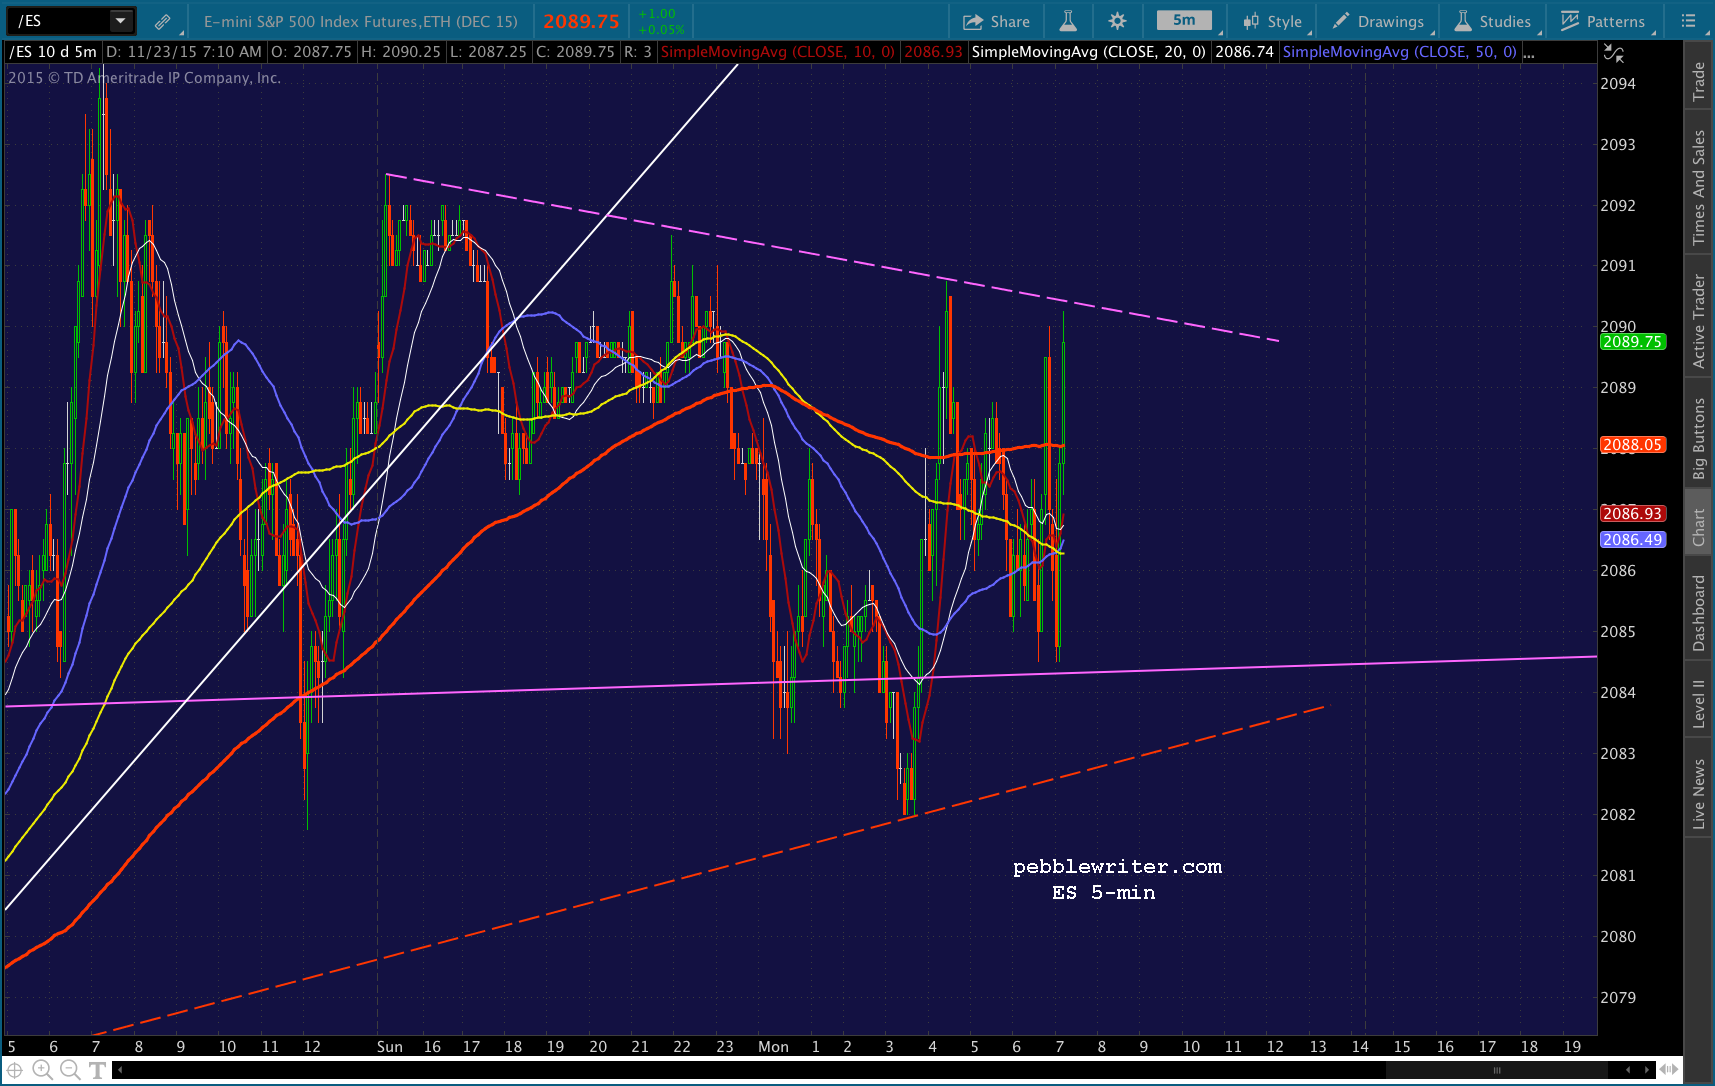
 UPDATE: 10:22 AM
If it’s just a head fake, we should see a reversal here. 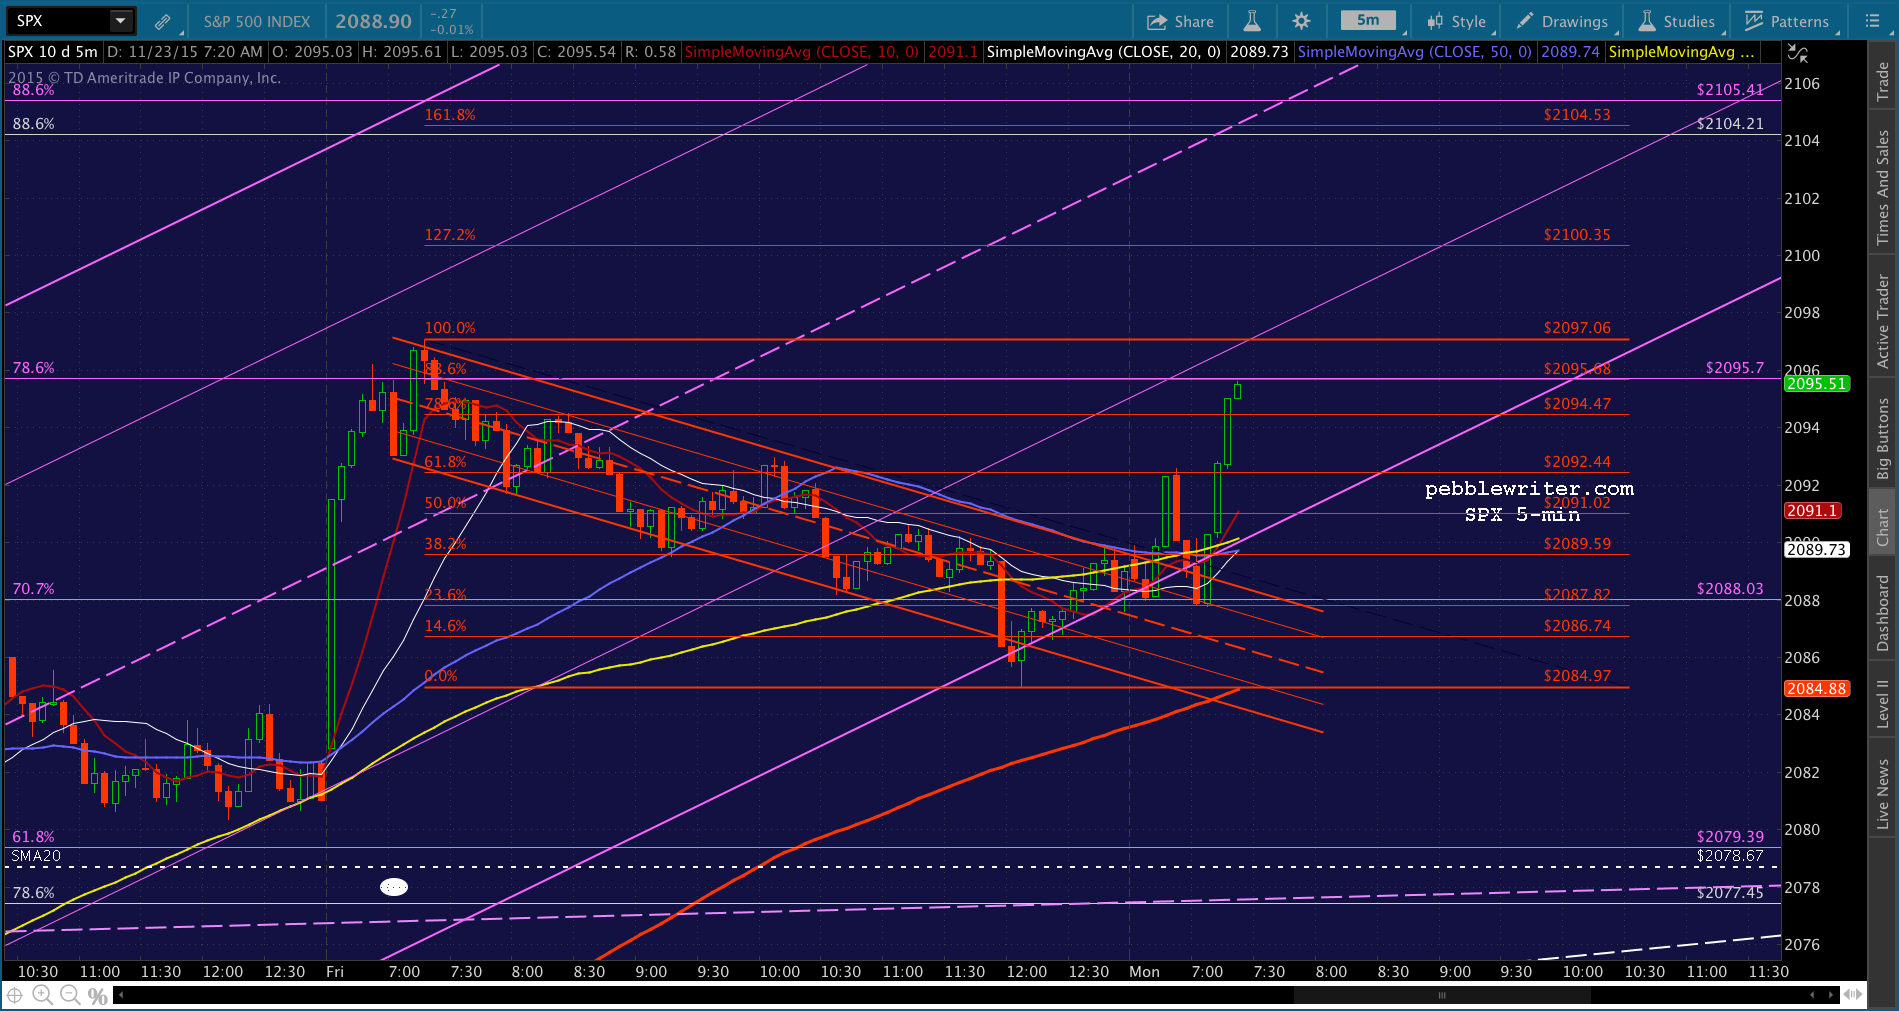 Keep an eye on ES to see if that TL holds on a backtest. If it breaks down, I’d want to get short again in a hurry.
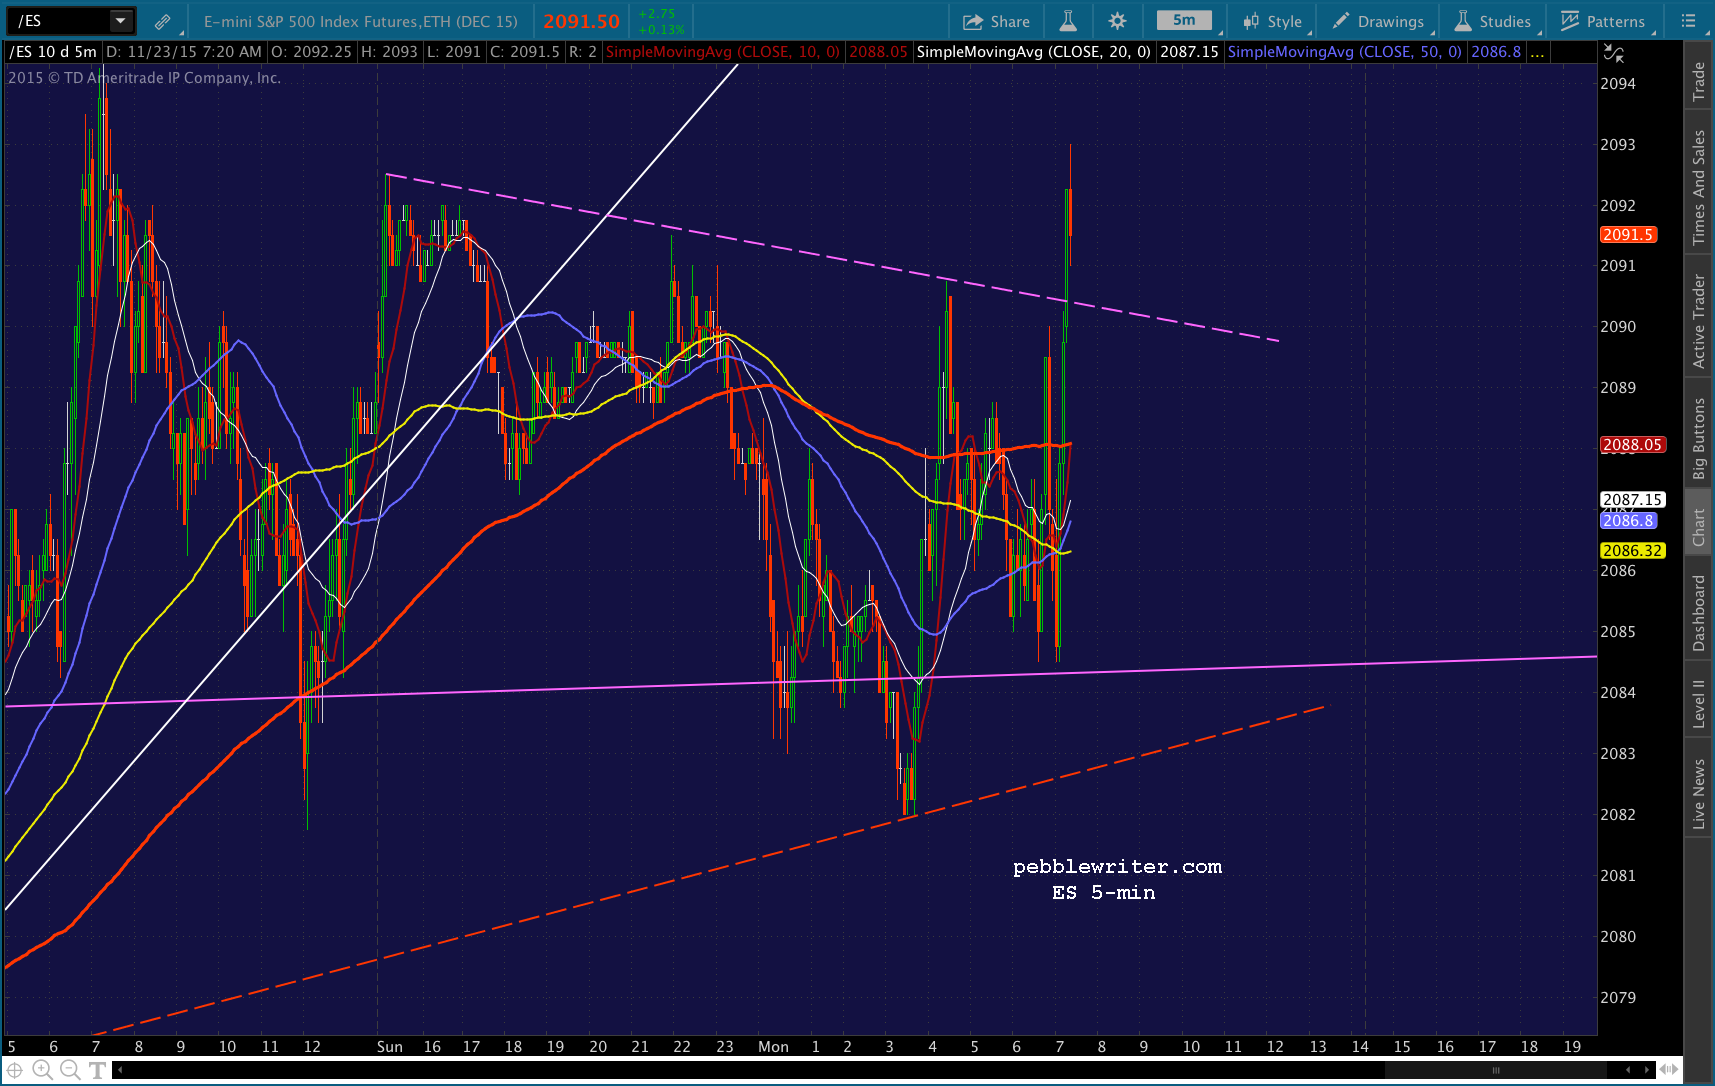 And, likewise, USDJPY — which is penned in between the 5-min SMA200 and the red TL.
 UPDATE: 12:08 PM
SPX is having trouble breaking out of the danger zone, here. Note that DX and ES are both threatening to break down. I’ll bail on the long position here and revert to cash.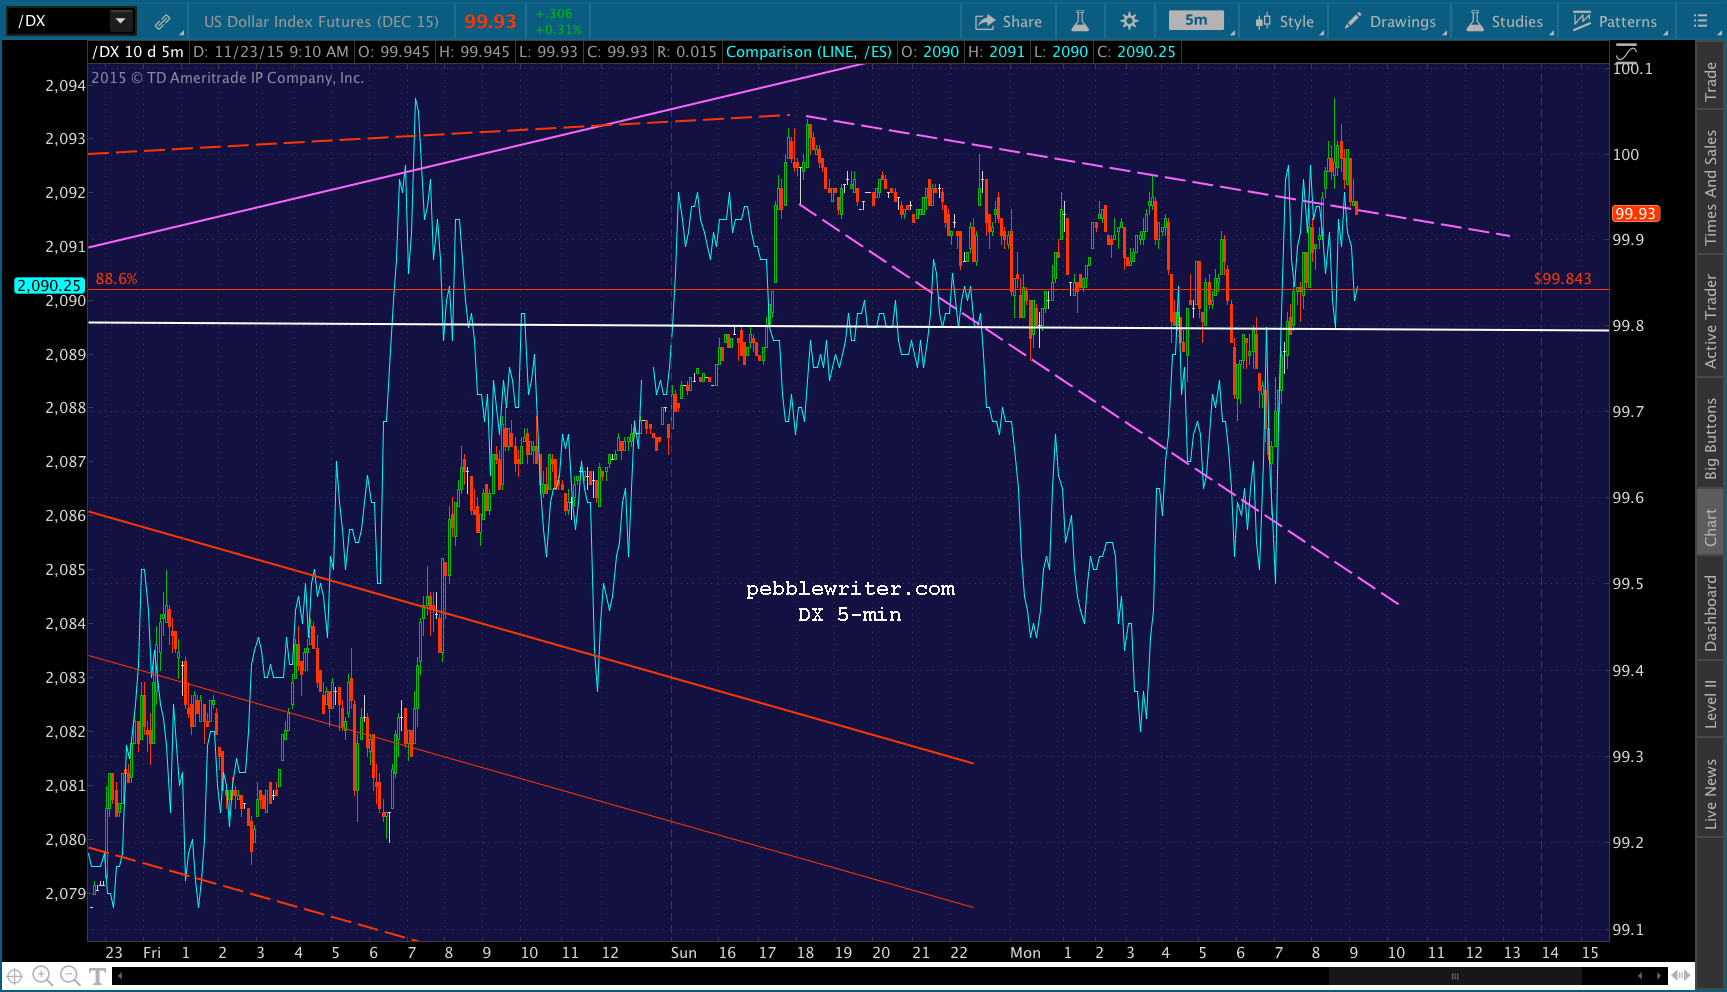

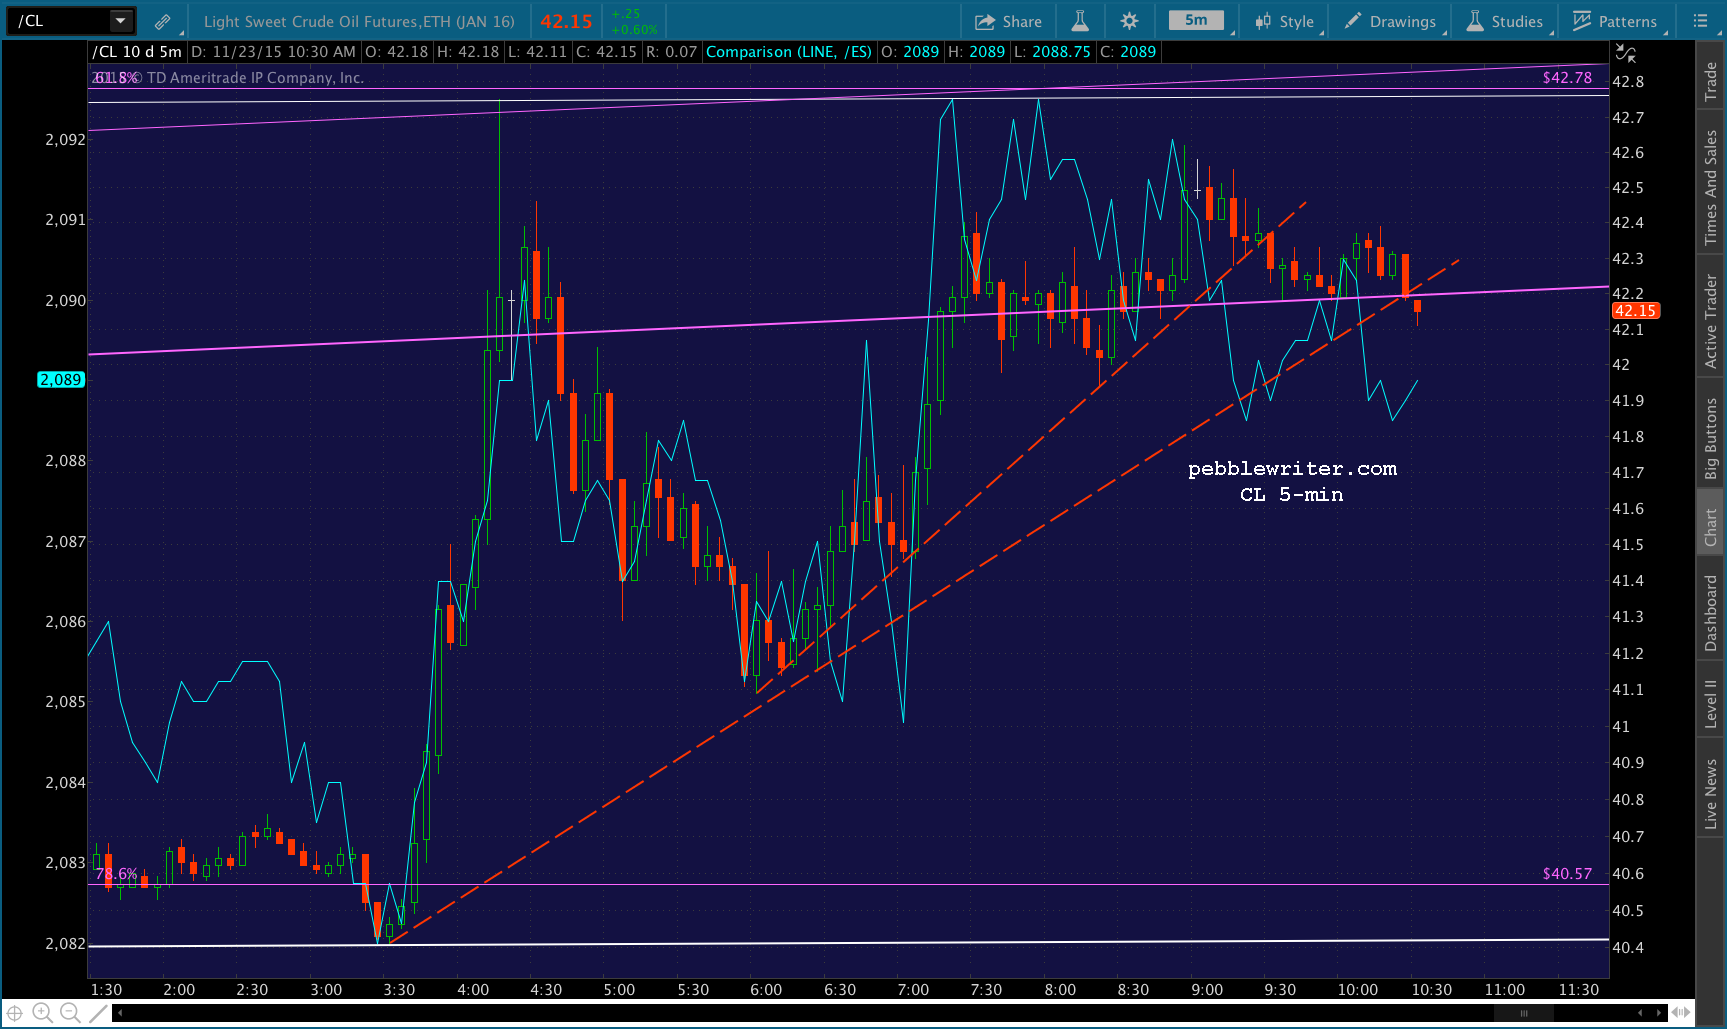
 There’s a pretty good chance SPX will dip below trend, but it could easily be limited to the 5-min SMA200 currently at 2088. With CL and USDJPY support still in place, it’s hard to justify a short here just to pick up 4-5 points. If CL and USDJPY break down, of course, then the 2078 target is suddenly a possibility.
UPDATE: 12:40 PM
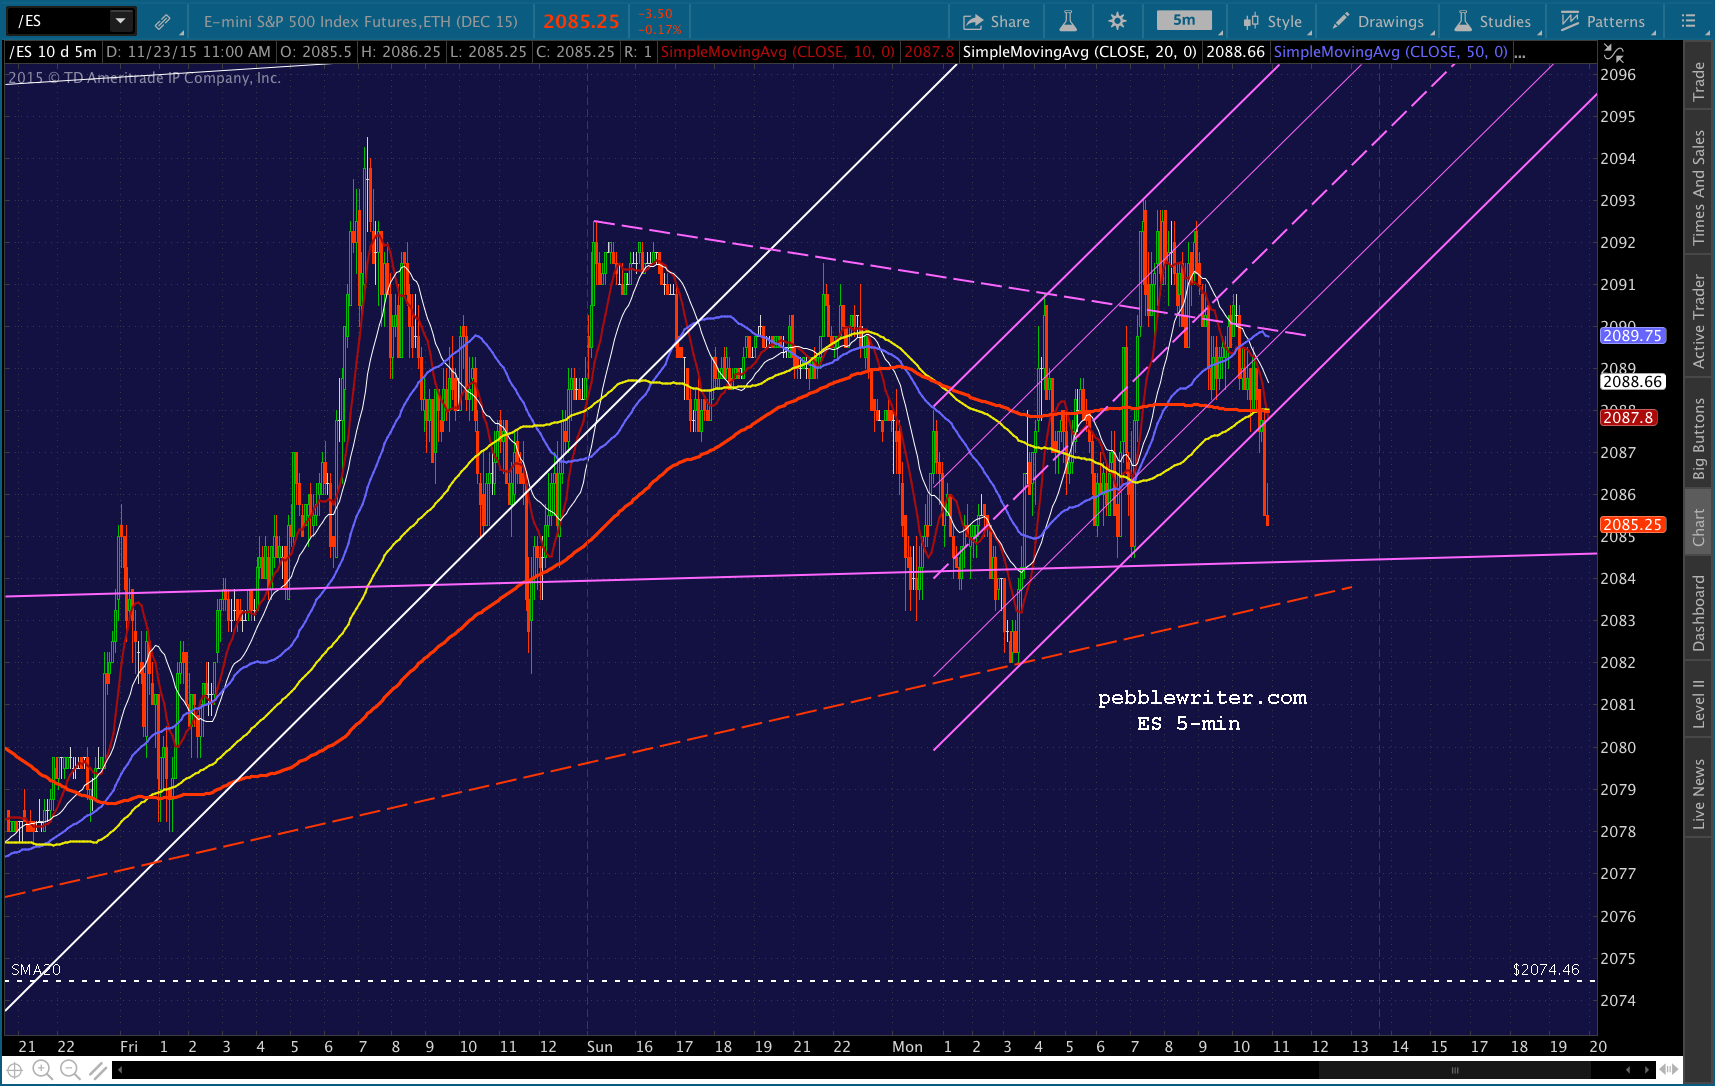
CL is below the initial TL, but the lower one is still an issue. 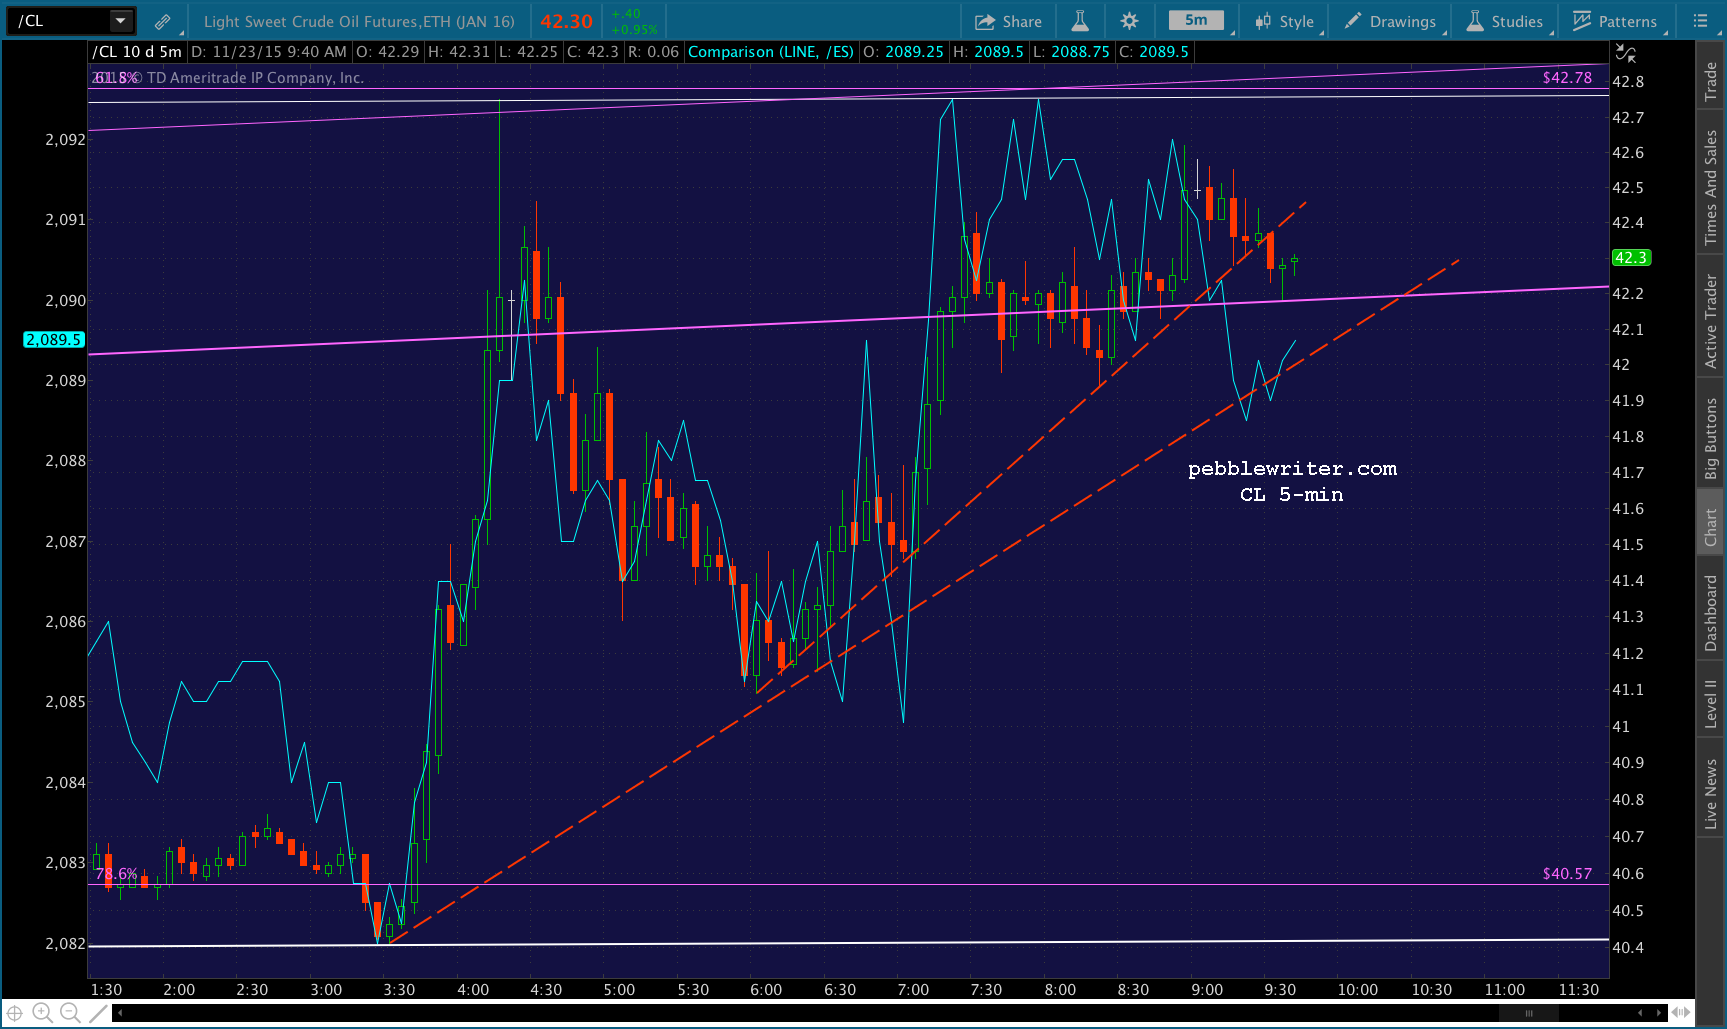 USDJPY is suggesting further weakness.
 SPX and ES have seen their SMAs roll over. If they retreat from their 5-min SMA10s, then the SMA200 starts to look better. If that breaks down, then the daily SMA20.
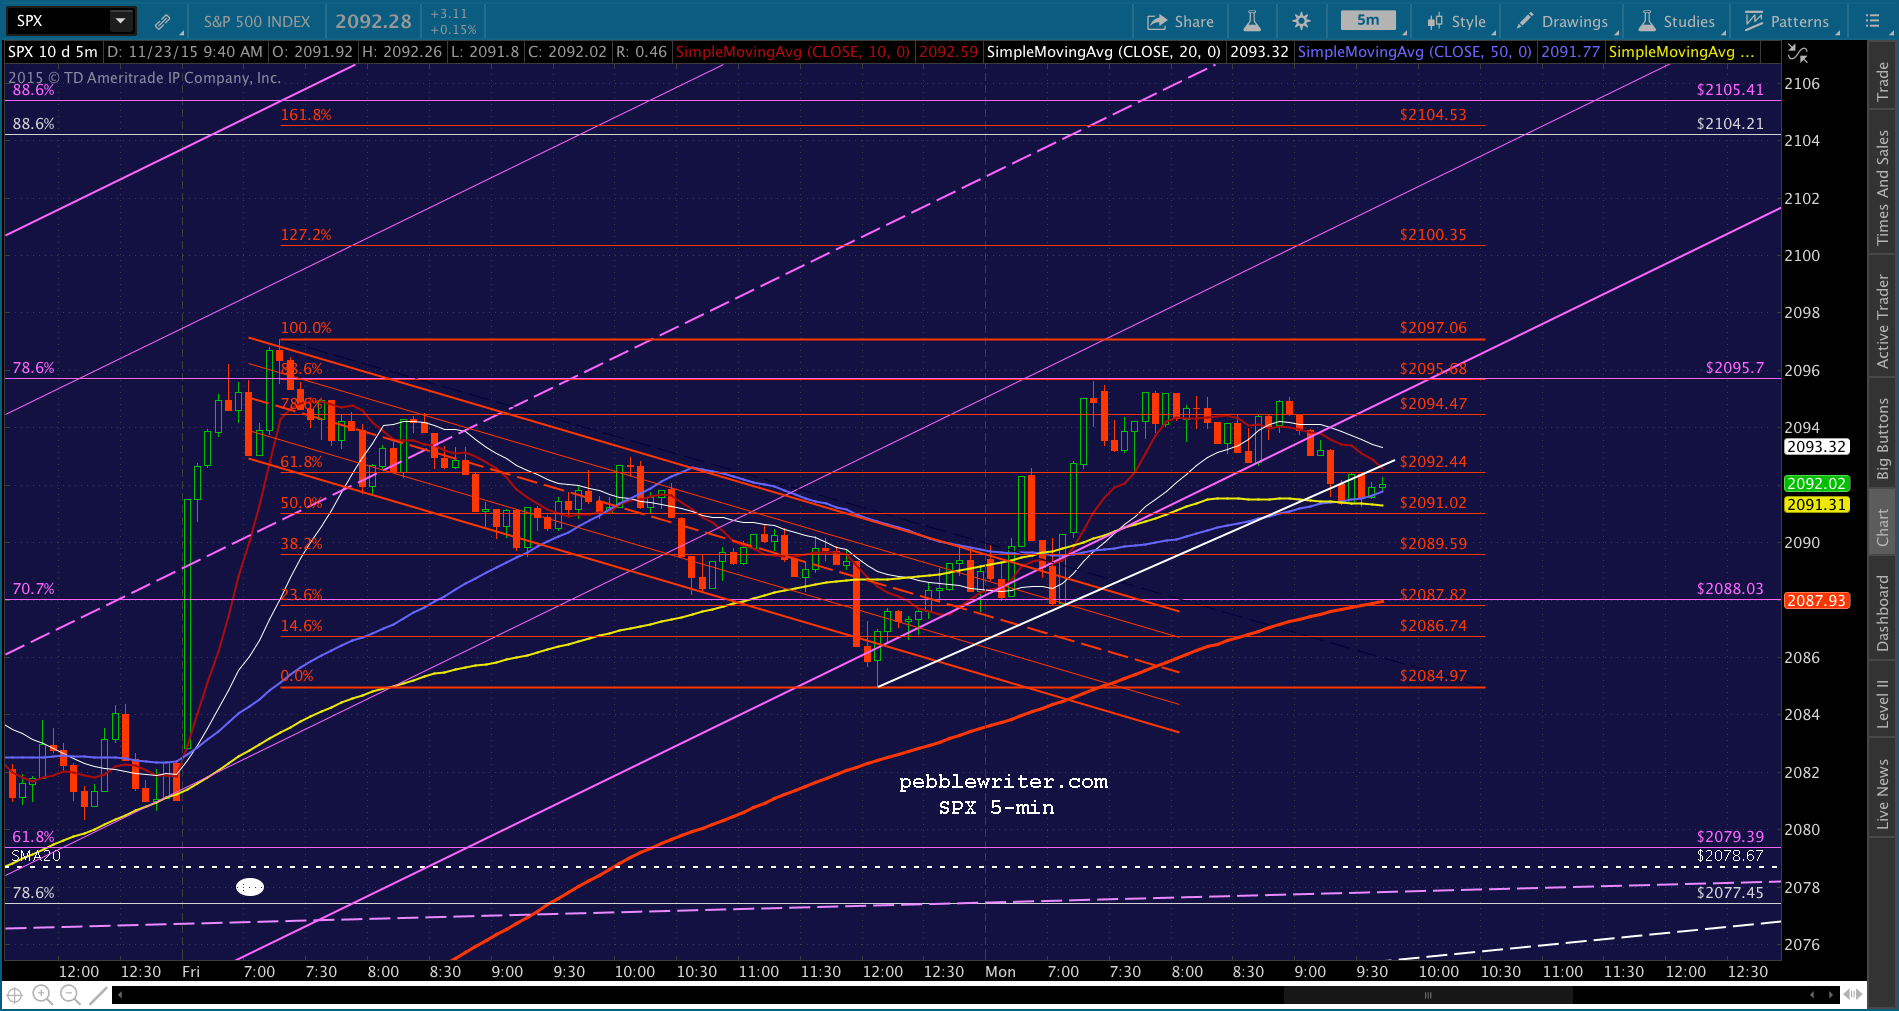
 I’ll probably kick myself later, but I’ll try a short position with tight stops here.
UPDATE: 1:30 PM
It’s a start…

 No guarantees, though, as ES just tested channel support.
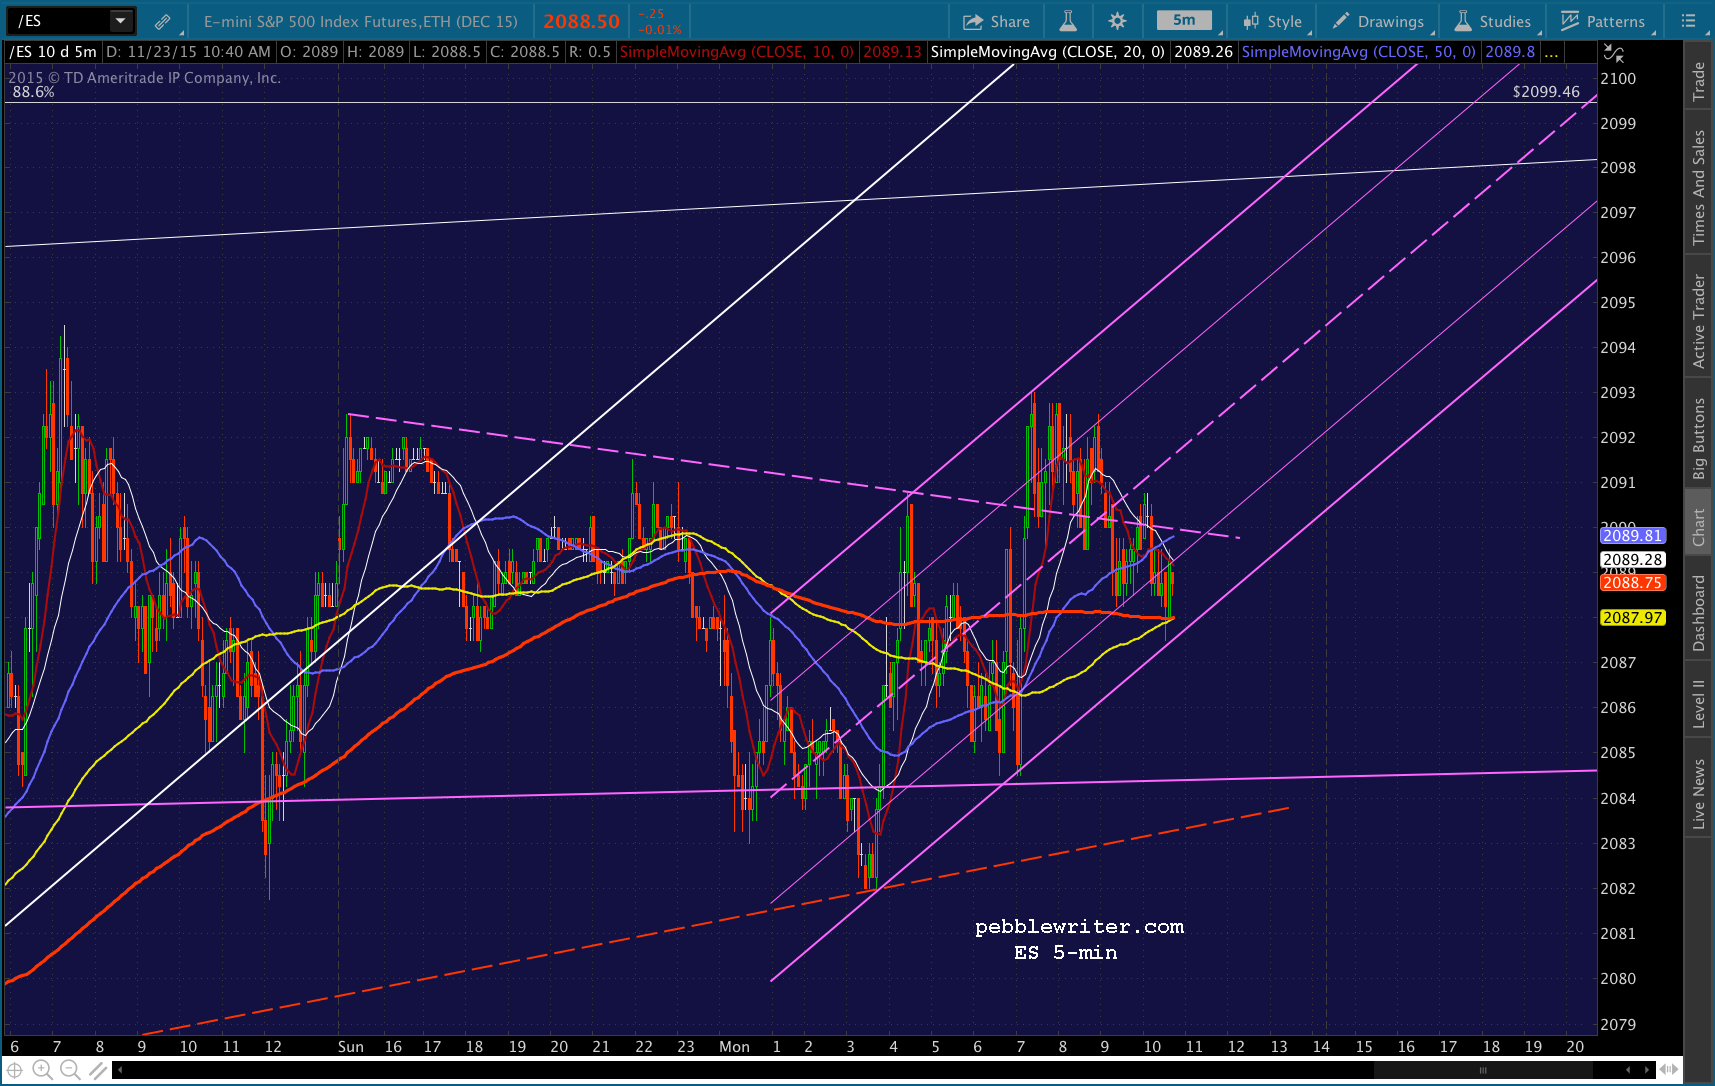 UPDATE: 2:01 PM
SPX just reached the 5-min SMA200, our next objective. USDJPY is bouncing, so there’s the possibility that it SPX also bounces here. Though, ES suggests it has further to fall.

 UPDATE: 2:04 PM
ES just reached its red TL, so watch SPX carefully here.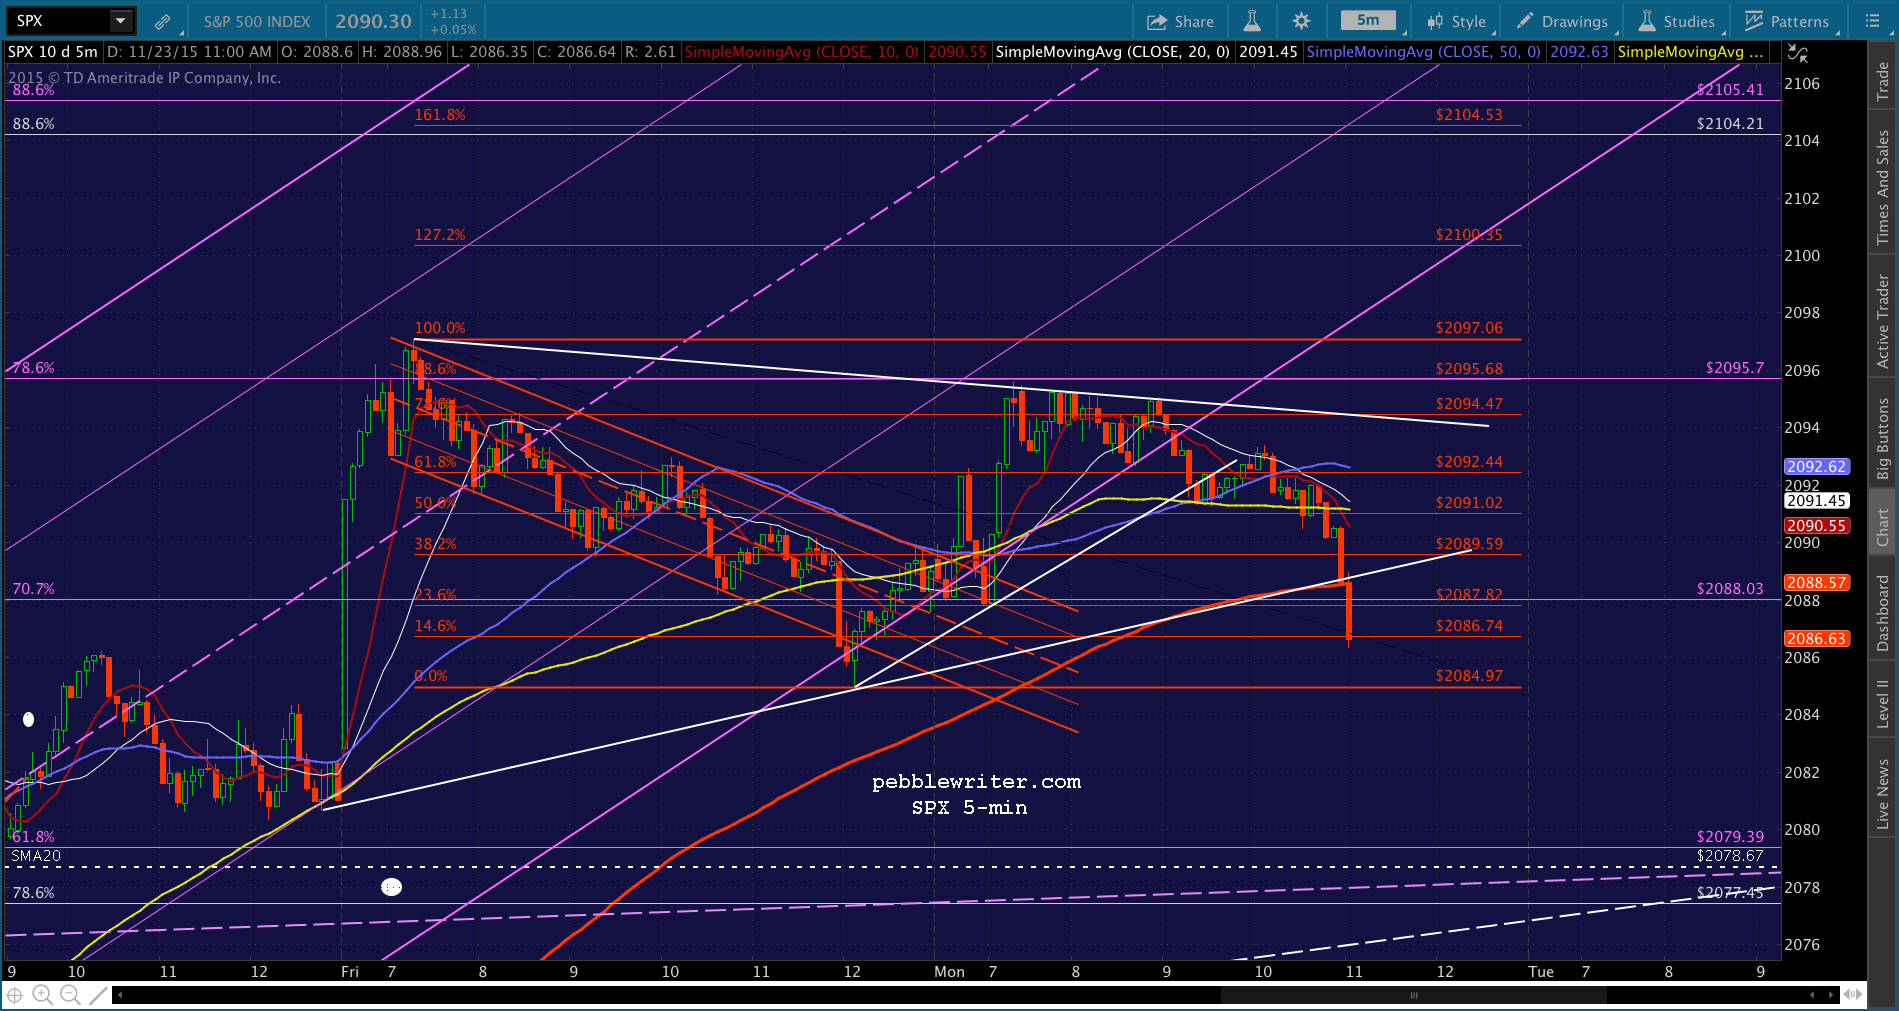 Keep a close eye on USDJPY, which is staying very close to that TL — a lifeline when TPTB decide SPX has fallen far enough.
 UPDATE: 2:14 PM
Lower high and a lower low. Not much of one, but it’s a downtrend. Now the question is whether we’ll get a kneejerk algo bounce here, or it tests 2078.67. Holding short, but cautious…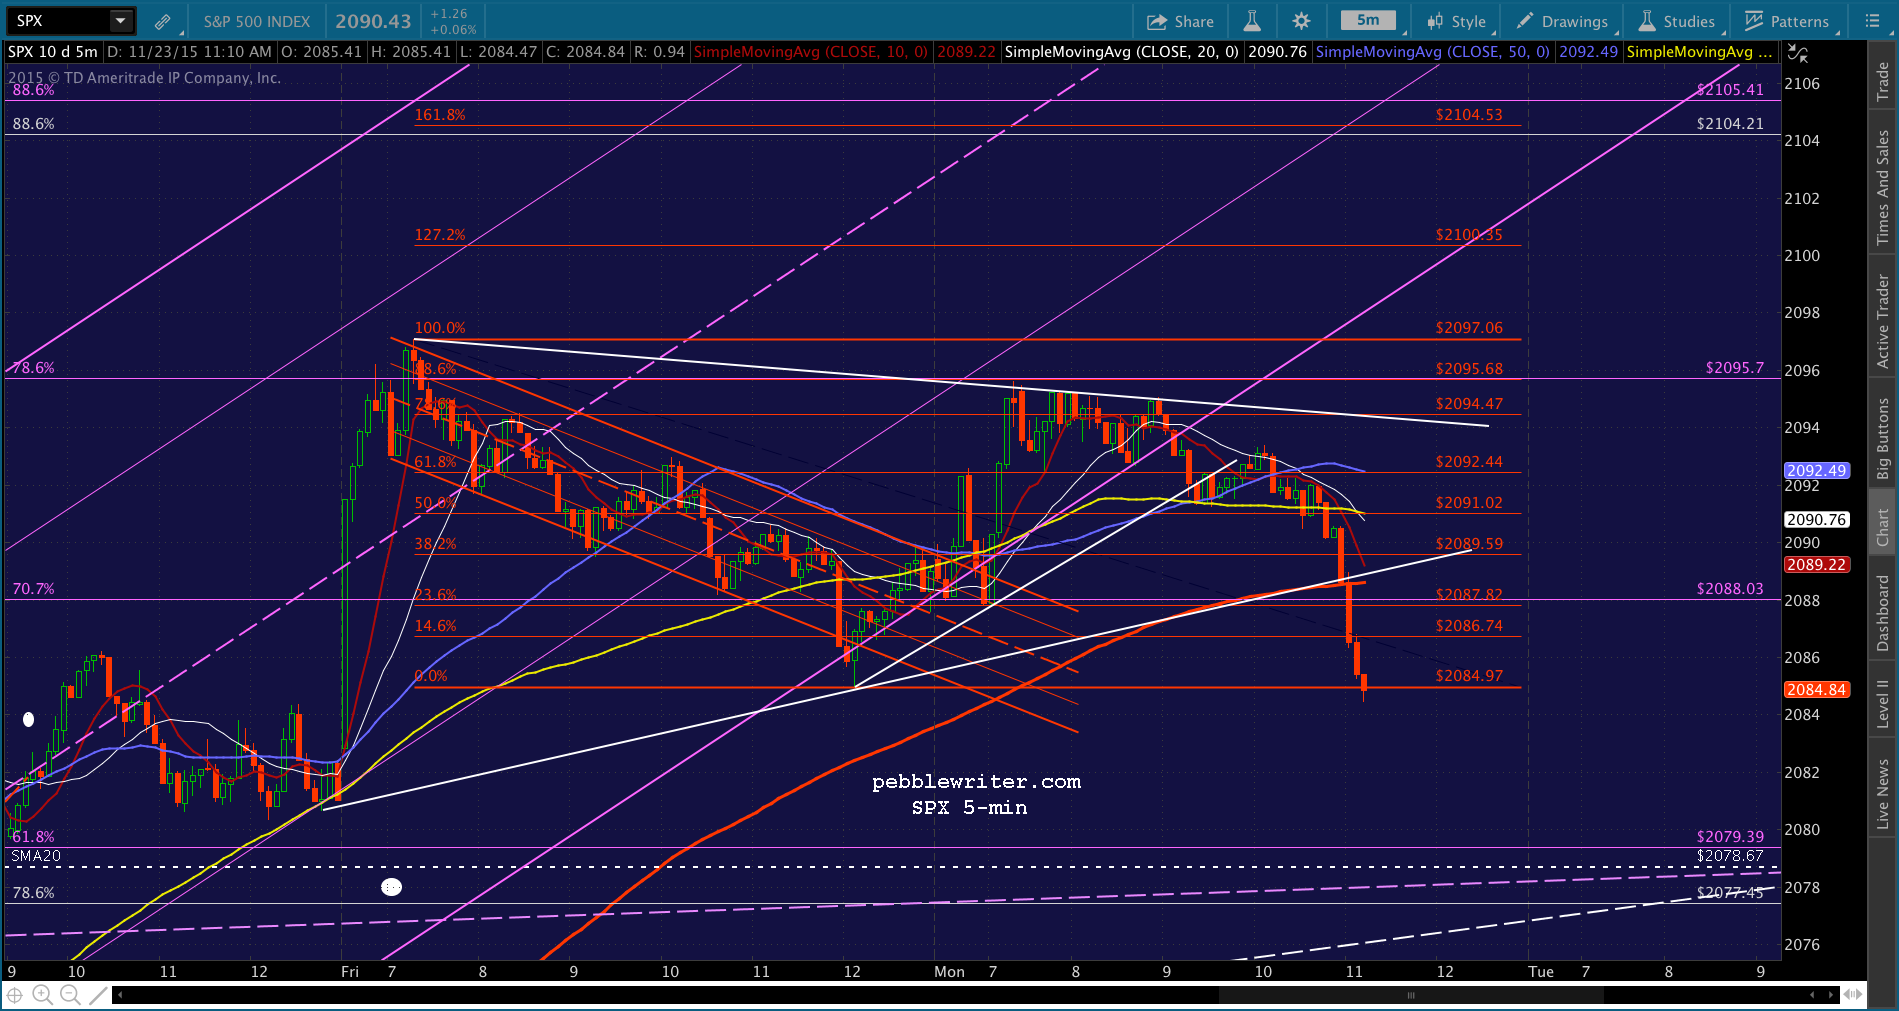 UPDATE: 2:40 PM
Getting very close to the SMA20 at 2078.67. Other potential targets are the .618 at 2079.39, the white .786 at 2077.45 and the white channel midline at 2076ish. UPDATE: 2:55 PM
Might not be anything, but SPX is easing up over the midline of our new falling red channel. Having seen so many declines erased in the last hour in the past, it makes me nervous. I think I’ll take profits on the short here and consider reopening it if USDJPY or CL break down further. Odds are it’ll get more downside momentum when the white SMA20 comes along (currently at 2086.44) or if USDJPY reverses after backtesting the red TL.
 But, better safe than sorry…
UPDATE: 3:15 PM
Might get one last shot at 2078 today here. Back to short with tight stops.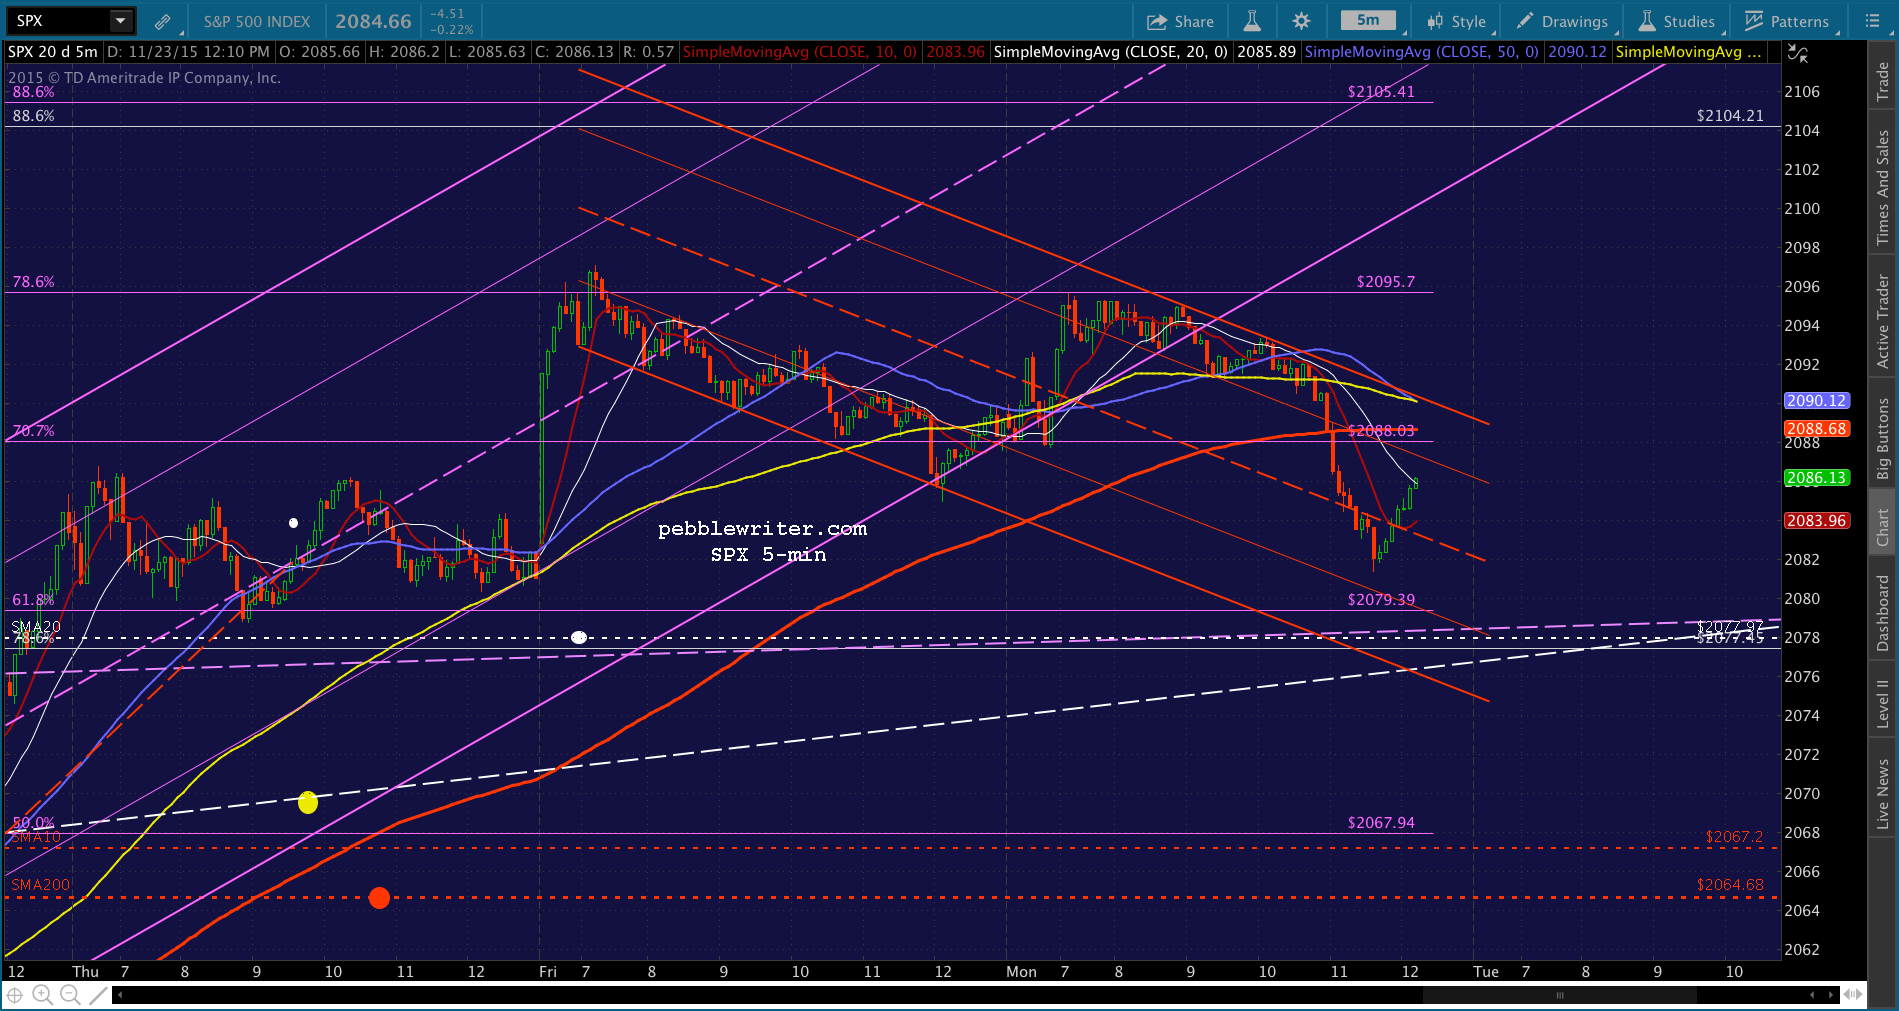
 UPDATE: 3:24 PM
Too hard to turn off the algos once they’re turned on. Back to cash here.
 May get another crack after 3:30 if CL/USDJPY would cooperate.
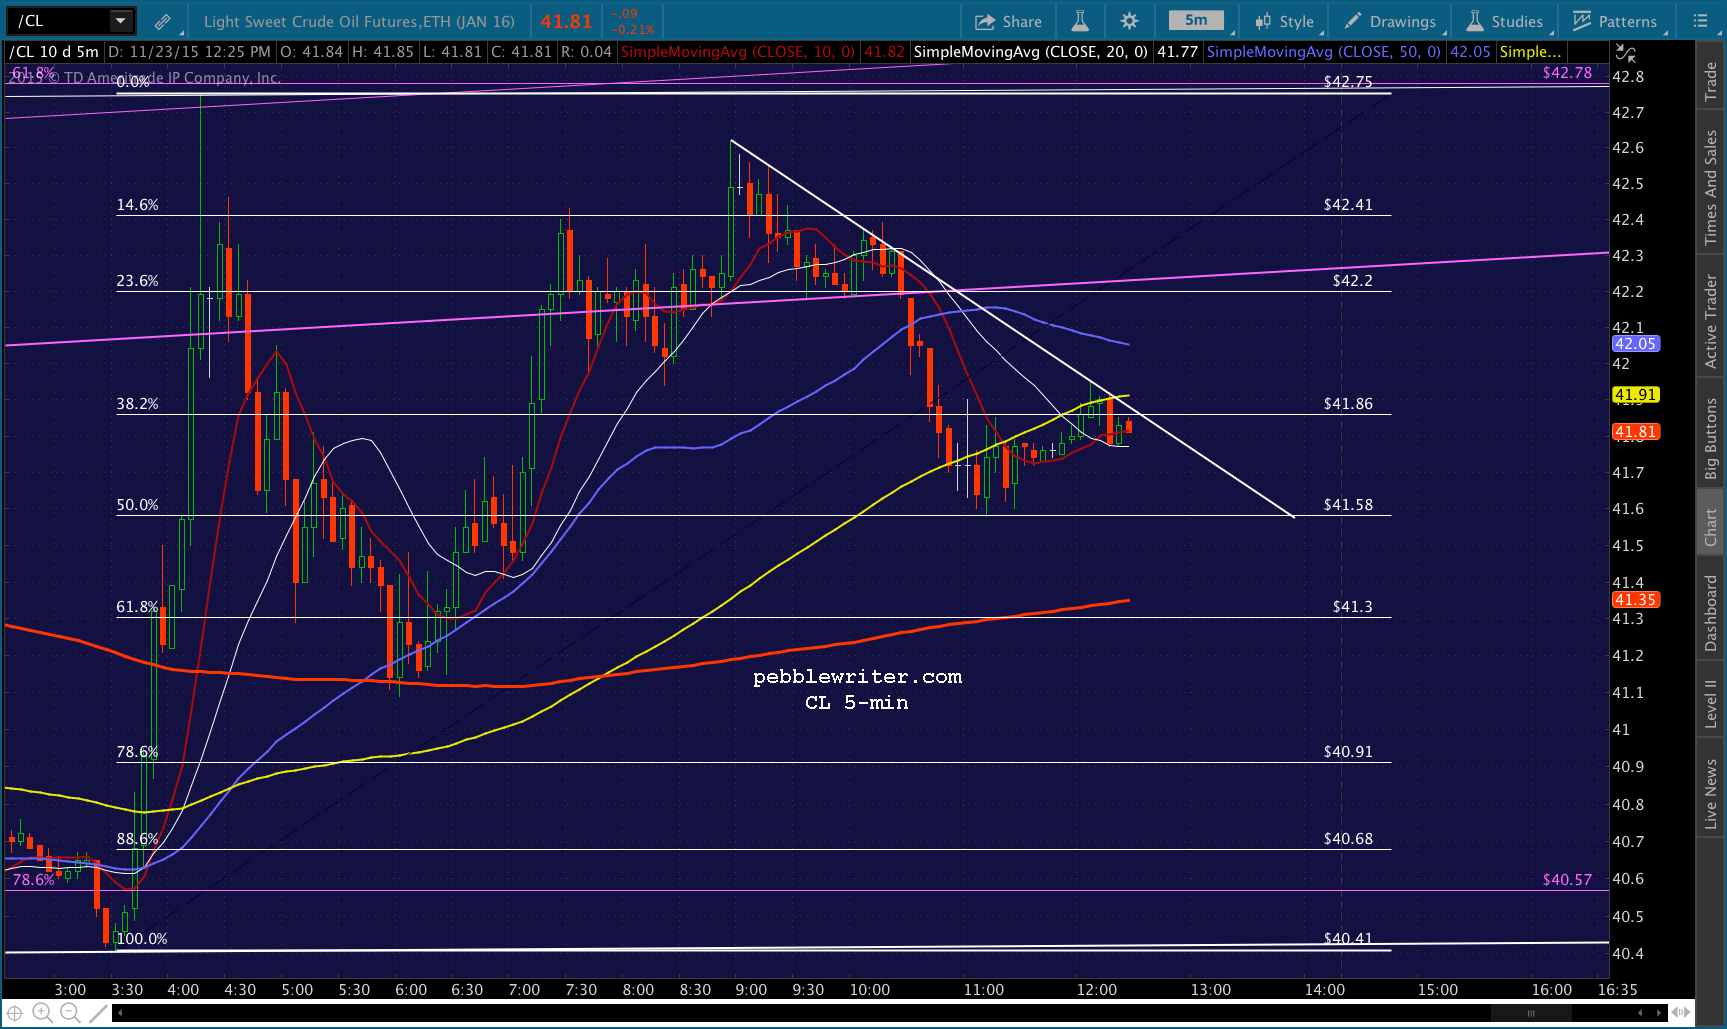
 We started this post discussing all the times one had to hold short overnight to make any money on the downside after the Bat completed a few weeks ago. This feels like another one of those.
As always, even though the opportunity looks good for 2078 or even 2065, don’t hold short overnight unless you can hedge or keep a close eye on things. It’s just as possible SPX will kiss 2100 in the morning.
Comments
3 responses to “The Big Picture: Nov 23, 2015”
that helps a bunch already thanks again
would it be possible to actually state the moving averages numbers when you post all the time sometimes hard to follow at least for me and especially when the market is moving rapidly. thanks in advance
Sure, sorry about that.
In case I forget… when I’m on a 5-min chart, you can also see the numbers in the right margin. They are color coded:
-SMA10: thin red
-SMA20: white
-SMA50: blue
-SMA100: yellow
-SMA200: thick red
And, I show SPX’s daily MAs with a dotted horizontal line (same colors), as they don’t change intraday (based on yesterday’s close.) For instance, you can see the daily SMA20 as the dotted white line at 2078.67.