The news has been pretty awful for oil over the past few days. But, it’s been stuck at its SMA50 because to go lower would have meant a drop below critical support for SPX.  With yesterday’s lame breakout of USDJPY, however, CL finally has some cover while it tags its own important support — which could set the stage for a real bounce.
Of USDJPY and CL, only one can really bounce. Higher oil prices are incompatible with a lower yen. It’s part of the deal between the BoJ and FOMC.
They are allowed to bounce at the same time for only a short period in order to, say, ensure SPX doesn’t make new lows.  We saw this yesterday when USDJPY spurted higher, breaking out of a falling channel on a recycled news story in Nikkei (about even lower negative rates) that was released the very minute SPX needed propping up.

It halted SPX’s decline at 1.15 above Monday’s lows. It’s about all central banks can do, anymore — which is a little scary.
As the past several sessions illustrate, the corner into which they’ve painted themselves is getting tighter and tighter.
continued for members…
Holding the white channel bottom is the key.

Again, made possible by USDJPY’s breakout.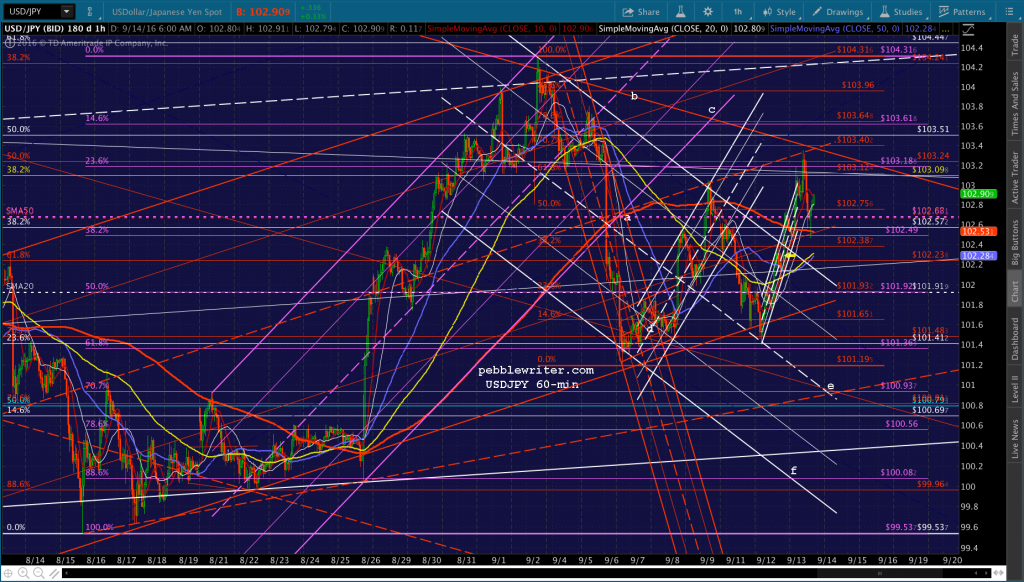
Equity charts for the day: ES might be able to hold the red channel bottom.  But, if it breaks down, it will be so SPX can make a nominal new low that establishes a C wave to go with its A.

I think this is what they were going for yesterday when the Nikkei story hit. Recall that the bounce was extremely lackluster, and never got close to breaking out.
My guess is they’re waiting for the EIA inventory report at 10:30 ET, at which point we’ll get a very quick spike down to CL 41.37 – 43.50. SPX might or might not make a nominal new low depending on how fast it happens. But, I think they’ll have CL bounce higher after finding support, which should allow everything else to recover and USDJPY to resume falling.
It’s a little convoluted, I know. But, that’s what I expect.
UPDATE: 10:18 AM
SPX is testing its SMA100 again, with the SMA5 200 just above. This would be a good place for a reversal if CL takes much of a dive. On the other hand, it would be great place for a breakout. I’d try a short position here with tight stops.


The tricky part is VIX, which can prop things up pretty easily with even a slight dip below the SMA200 at 16.72.
UPDATE: 10:37 AM
Inventories decreased 600K barrels versus last week’s 14.5M. It’s mildly bullish for oil — which ran up to tag the falling red channel top and seems to be stalling there. For its part, SPX was buoyed by VIX dipping below its SMA200 and a TL off recent lows. It spurted up past the SMA5 200 (2136.65), where it will potentially backtest it as the SMA5 10 comes along in 10 minutes or so.


This is pretty much backwards of the sequence I expected, but it might turn out anyway. Keep an eye on VIX and the white TL. A rise back above it and the SMA200 would be a signal of lower stock prices to come. Otherwise, we’ll get the backtest mentioned above and not much more.
FWIW, ES just reversed off of overhead resistance — the purple TL.
UPDATE: 11:18 AM
So far, so good. VIX is back above its SMA200… …while SPX is back below its 2015 highs and the SMA5 200.
 CL is continuing lower.
  While, USDJPY is diving nicely…
 …and even DX is cooperating. If it were to drop through the support zone at 95.22ish, things would accelerate to the downside.
  It’s still unclear whether or not we’ll get a new low. CL is probably nearing its downside potential. Though, the bottom of its rising white channel was fairly tough to place with any certainty — thus the large downside target range.
UPDATE: 12:17 PM
CL is inching lower and DX is poised to do likewise. But, VIX is propping up SPX by loitering at its SMA200 — switch they can throw any time SPX starts to dip. I’d revert to cash here, as it seems unlikely to make any lower lows for now. If VIX bounces back above the SMA5 200 at 17.11, I’d look at shorting SPX again. But, I’d hold off on a long position until CL reverses.
I hesitate to cover the short, as I still believe in the premise of a drop to either new lows or, at least, the white TL down around 2128ish. But, with VIX sitting right there ready to drop like a rock, it’s hard to feel comfortable with a short position.


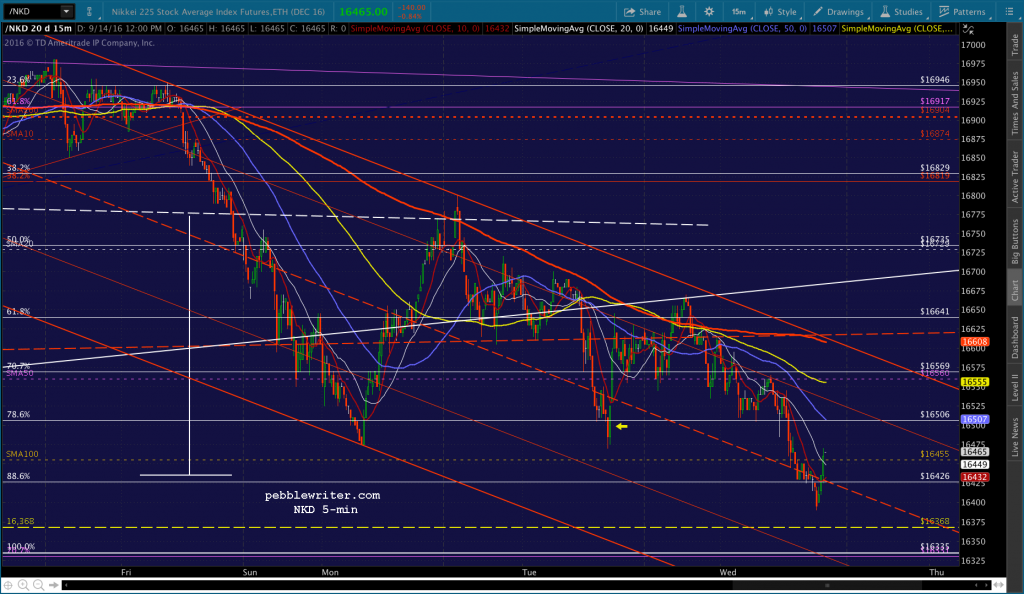
Note that while NKD broke down through its latest white TL, it has just about reached the .886 shown below. So, they could be setting it up for a rebound.
UPDATE: 12:39 PM
I’ll take another crack at a short position down to the white TL (2129ish.) Probably a waste of time, but VIX seems to be getting a bounce and NKD is slumping a little.

The key will be VIX getting past the SMA5 200 at 17.10.
UPDATE: 2:24 PM
Making progress toward a new low. ES just reached its SMA10, so that will be a challenge getting below it. Should get a bounce somewhere in here as CL is almost to its white channel bottom.
At this point, I’d say CL is low enough. The only remaining question is whether or not SPX wants to make a new low. Since nothing is spiking higher, and VIX is still above its TL and SMA5 10, and NKD is still below its .886, I’d say yes, they’re setting it up for new lows. It’ll likely happen right away, at the close, or first thing tomorrow morning.
While it will be gratifying if it happens, it is likely to leave us with the issue of holding overnight. New lows into the close is frequently a bear trap — triggering stops who then get creamed when it gaps higher the following morning.
UPDATE: 2:55 PM
Probably just a head fake, but VIX is dipping lower and NKD is testing resistance. Odds are they’re just trying to get a SMA5 20 tag before another leg down, but I’d take profits here and reopen the short if it reverses after the top of the hour.


UPDATE: 3:00 PM
One last shot at a leg lower. If it does dip more, it’ll probably be CL, which looks like it wants a little deeper retracement before what should be a strong rally.


UPDATE: 3:32 PM
I’m not sure if we’ll get new lows or not, but this is close enough IMO — especially with VIX settling toward the white TL again. Back to cash for the night, though if VIX started spiking I’d give some thought to shorting again. And, if SPX makes a slightly lower low and VIX starts crashing, I’d sure think about going long for the bounce.

UPDATE: 3:50 PM
Probably nothing, but we could get another leg down from this little backtest. Back to short with very tight stops with a target of 2119. If it doesn’t start down right away, I’d blow it out. I have no interest in holding overnight — even if it dips to 2119 and keeps going.

UPDATE: 3:59 PM
Covering. I think we’ll get a little more in the morning, but can’t see making that bet overnight. I have to run out for a little while, will post more later this afternoon.




