Oil reached our next downside target yesterday, then did something funny. Instead of supporting the “market” as it’s done countless times before with a bounce at support, it kept going.  Likewise, DX and EURUSD ignored opportunities to tag their nearby SMA200s, which would easily have allowed SPX to close in the green.
Whenever TPTB ignore opportunities to have the “market” rebound, it can mean only one thing. They don’t want it to. At least, not yet.
We remain short from 2171.22 just before the close yesterday.
continued for members…
USDJPY is the only market mover doing its job this morning, but it’s almost to our upside target.
Which was enough to get NKD through its SMA200. It was as much a function of the falling SMA200 as it was the rising BoJ supported index.
Everything else is intentionally whiffing the ball.

Futures are flat, with that 2152 still looking rather juicy. Which still lines up with SPX 2157. If it gets there, or even breaks 2161, then we’ll reevaluate the prospect of 2138.

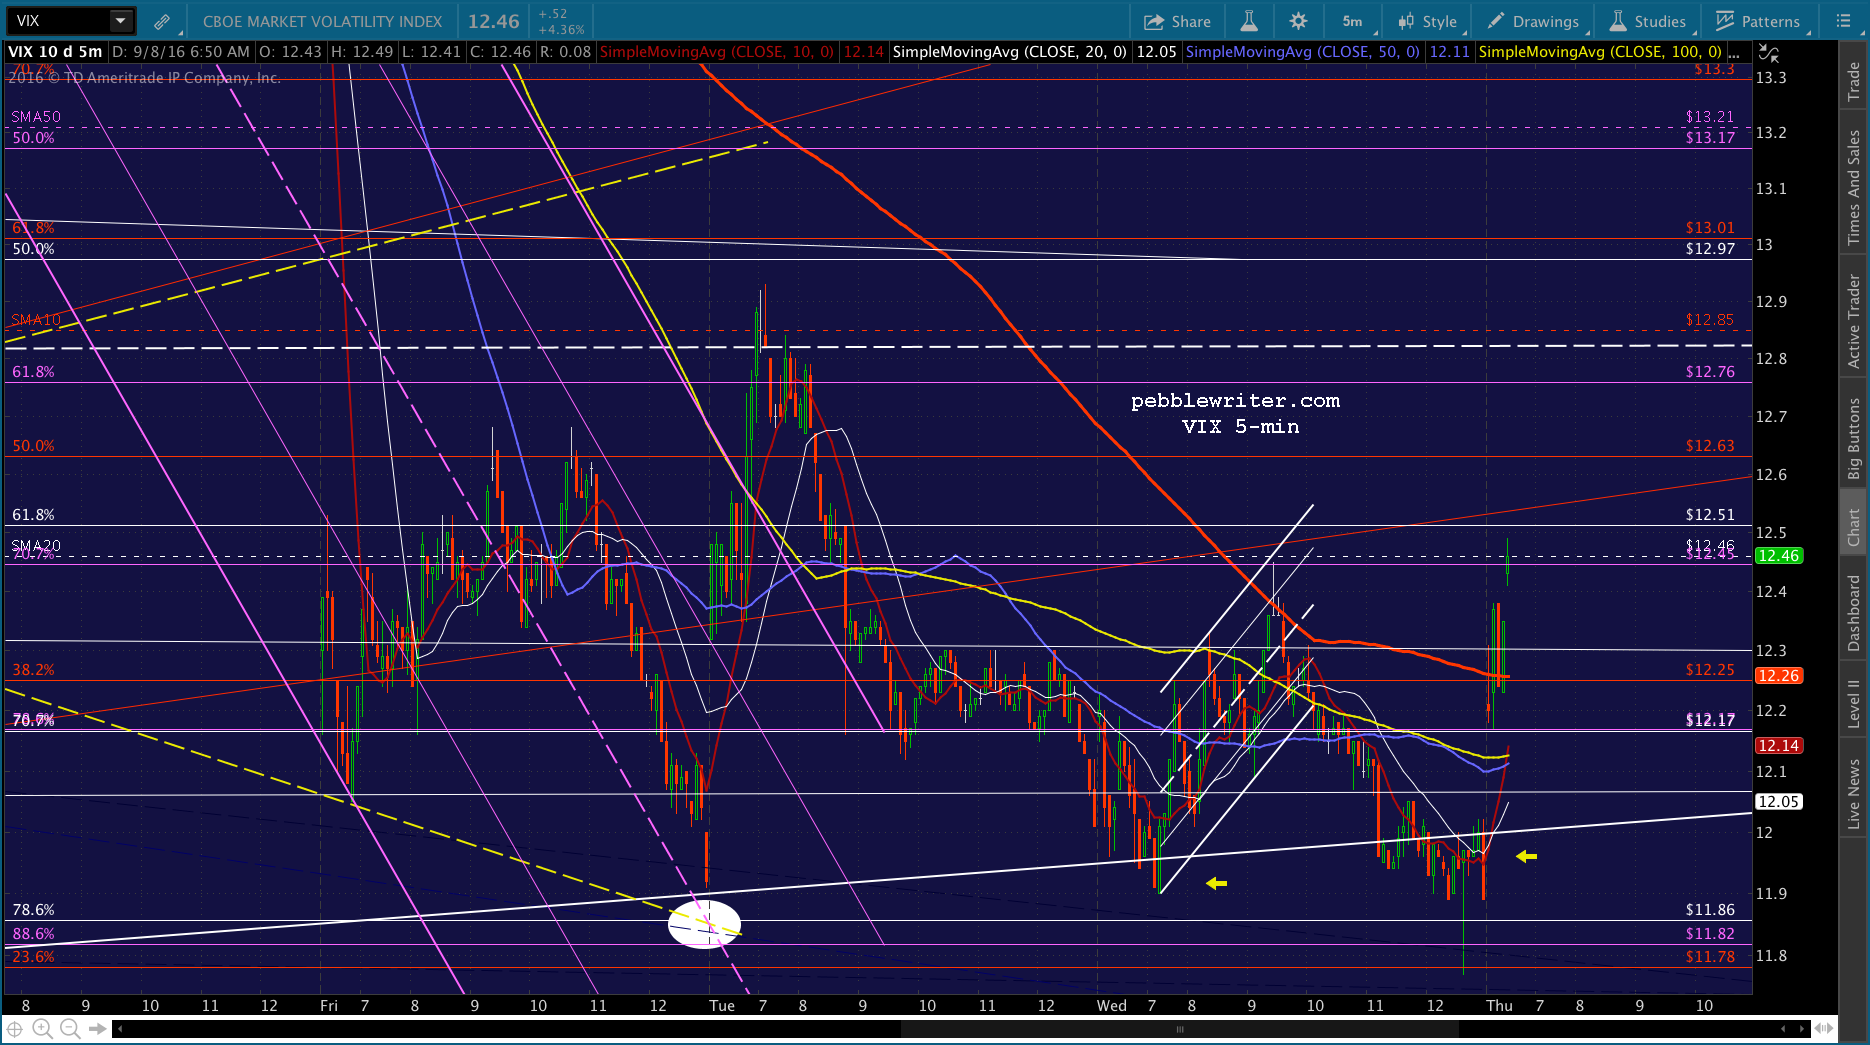
As yesterday, keep an eye on VIX and the purple TL from last Friday.
For those who watch gold, note that it reached the yellow TL from December overnight. It could leak a little lower to tag the SMA100 at 1298.40, but this is its moment of truth.
UPDATE 10:35 AM
SPX just reached the bottom of the falling red channel, so will likely get a bounce here. It should fall a little further to tag the .786 Fib, which would allow ES to tag its yellow TL and .786 at 2152.20.
Note, however, that ES has almost reached its 1.618 from the 2007-2009 drop, at least on an unadjusted basis. So, ES traders might think this is quite enough. However, SPX’s 1.618 is clear at 2138, the equivalent of 2136 in ES.
Note that the yellow TL we’ve been tracking (I’ve sometimes erroneously referred to it as a channel midline) was drawn to emphasize the bottom of the rising purple channel.  ES dropped through the bottom of it for the first time in January, which began the frenetic doubling of CL in order to get stocks back on track.
  But, CL is still slumping towards 43.07, and VIX looks like it wants to tag 14.68, so I’m inclined to think we have more coming.
UPDATE: 11:05 AM
SPX just tagged its .786 at 2157.47. I’d say we’re due for a reversal, though ES didn’t quite reach its, nor the red TL connecting the two previous lows. And, VIX looks unfinished. I might regret it, but I’m not quite ready to pull the plug. We’ll see what happens when the SMA5 10 catches down in a few minutes.

UPDATE: 11:19 AM
Looks like an extended bounce is coming, as VIX just dropped through the red TL. Back to cash here, though I’ll be ready to go short again on any sign of a reversal — probably when the SMA5 20 catches down.
Swing traders, I believe you’re safe staying short for another 5 points, but it’s too close to call. Sometimes ES needs to tag its targets, and sometimes it’s enough that SPX did.
UPDATE: 11:37 AM
Probably close enough, especially with the euro close. I’d revert to short here with tight stops. We’ll make the target ES 2152.20, which is about SPX 2154. Since SPX’s .886 is just below at 2152.85, I’ll use that as my SPX target.
UPDATE: 12:02 PM
SPX seems to be looking for support here at the SMA20. It’s not unusual for it to climb on top for a little bump, only to finish a move later in the day or the next. And, this drop does look like it got a little ahead of itself.
Technically, the H&S has completed. And, I doubt they want traders to start shorting it like crazy with the expectation that it won’t be propped up as usual.
I don’t see any effort on the part of CL, USDJPY or VIX to reverse it here. But, you never know. Watch your stops. We’re coming up on 12:09, which often marks the end of a bump higher.

UPDATE: 12:15 PM
VIX is dropping a little lower, so I’m assuming this is going to be drawn out for a while. Back to cash, here. The SMA5 50/100 are up ahead at 2165ish, and the rising red channel bottom is around 2164ish. We might see either of those as another reversal point. But, I think the issue is more timing than anything else. They don’t want the channel to break down too badly. CL hasn’t budged yet, so I’m leery of going long.

UPDATE: 12:50 PM
Well, that escalated quickly. Looks like one more spurt up to the SMA5 200 or white TL before we get another chance at lower.  Note that VIX didn’t quite reach the purple TL, which will intersect with the yellow TL and the SMA5 200 at 13.58ish.
UPDATE: 2:07 PM
Well, that was tricky. SPX reversed without having tagged the SMA5 200 or TL. CL started dropping and VIX started popping (without having tagged its SMA5 200), and that’s all it needed. I’ll try a short position here, but there’s a 50:50 chance that this is a head fake — as those catalysts are most often involved in an upside reversal. Note that CL has almost reached 43.07, our next downside target from last week. We’ll look for a bounce there up to the cluster of SMAs and white channel line, say 46.24.


UPDATE: 2:13 PM
Yep, looking very much like a head fake that got away from them a bit. Back to cash here on any sustained push through the SMA5 100 at 2165.77. A rally to the white TL by the close (ideally 2:50) looks fairly likely at this point. My hesitation is that CL continues to settle lower. It just tagged the .618 at 43.07, but is showing no signs of rebounding yet.


CL is approaching the rising white channel bottom. Will it run all the way down there or respect the .618? TPTB love to gap down on the opening for these things almost as much as they do a close at a bearish low. Either way, I’d be prepared to short at 2167-2170.
UPDATE: 2:49 PM
There’s the SMA5 200. Might be a little early, as VIX still hasn’t reached its SMA5 200, but I’d short here for another leg down. The risk here is that CL runs down and tags 42 after the close and then spikes up to 46-47. This would leave folks short overnight facing a big gap higher in the morning. Dirty pool, but hardly unusual these days.
But, we’ll cross that bridge when we come to it. At this time, there’s still a chance that CL will spike lower before the close, leaving a big dragonfly candle on the day and giving us a chance to cash in on SPX’s drop to 2150-2152.