

When we last caught up with RUT, it was potentially going to take another shot at completing an Inverted Head & Shoulders pattern. But, as I noted at the time, this would require it to break out of the falling white channel that had guided it lower for six months.
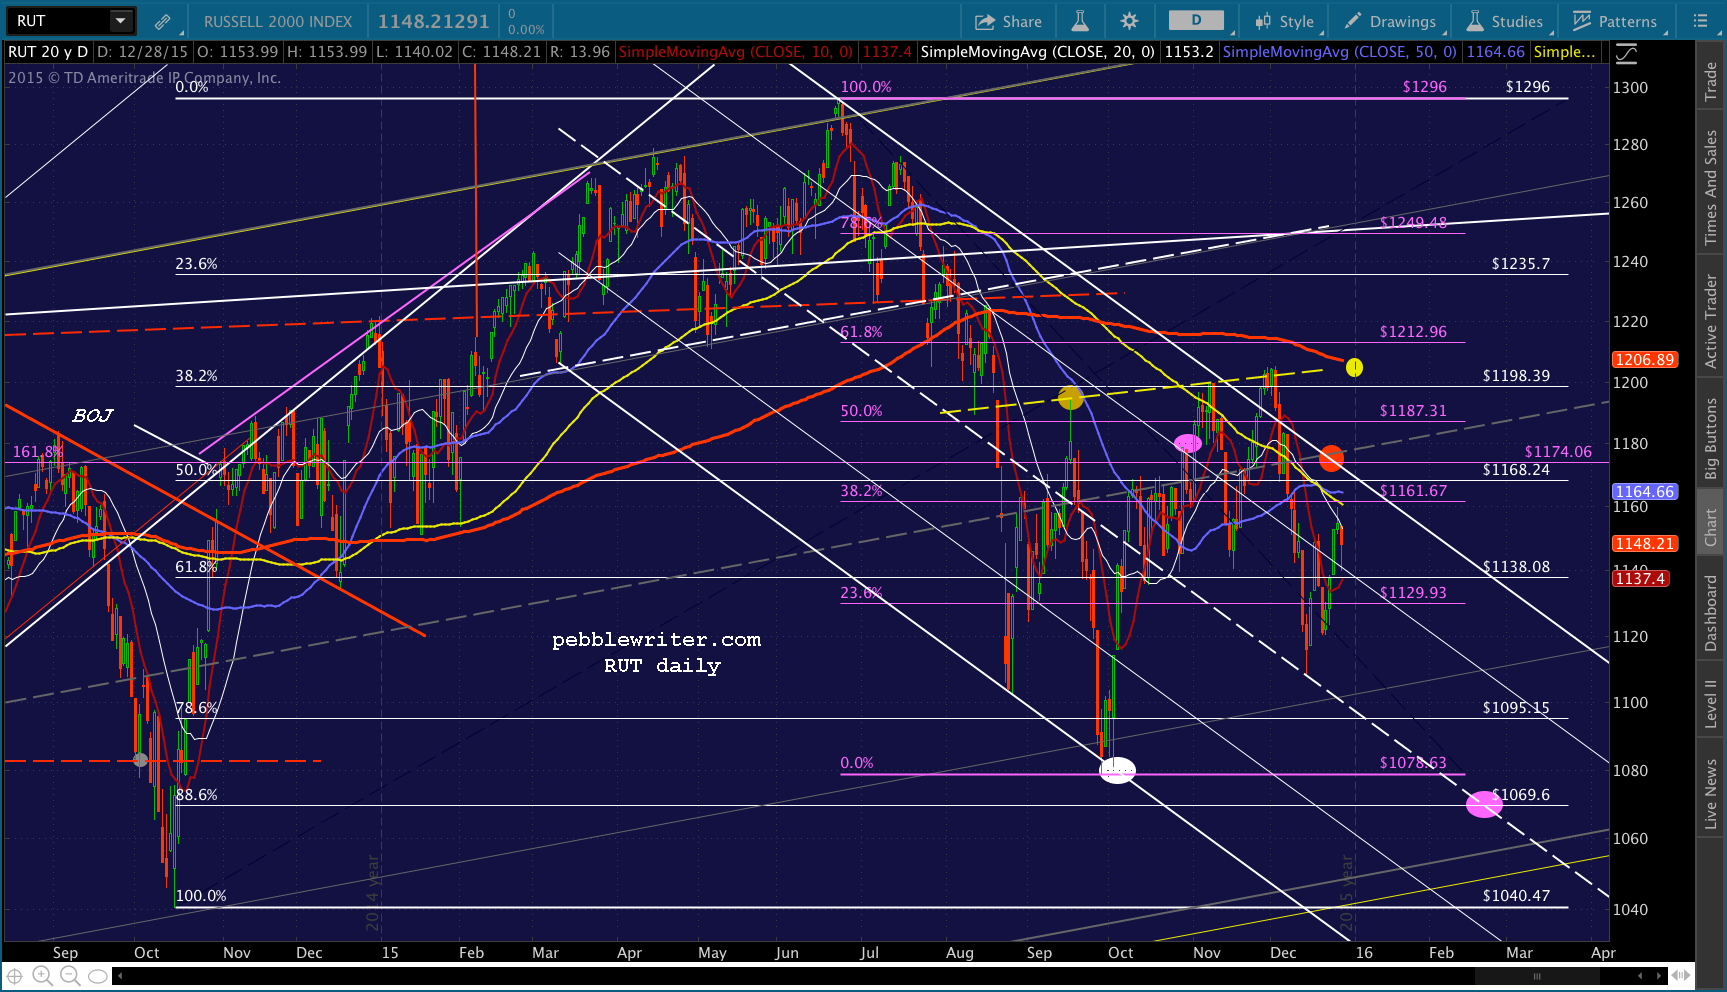 But, to do so, it needed help.
USDJPY [has] continued falling until it reached (well, almost) the most important support on its entire chart: the yellow .618 at 120.11. If it holds/bounces, then RUT should get another bite at the apple.
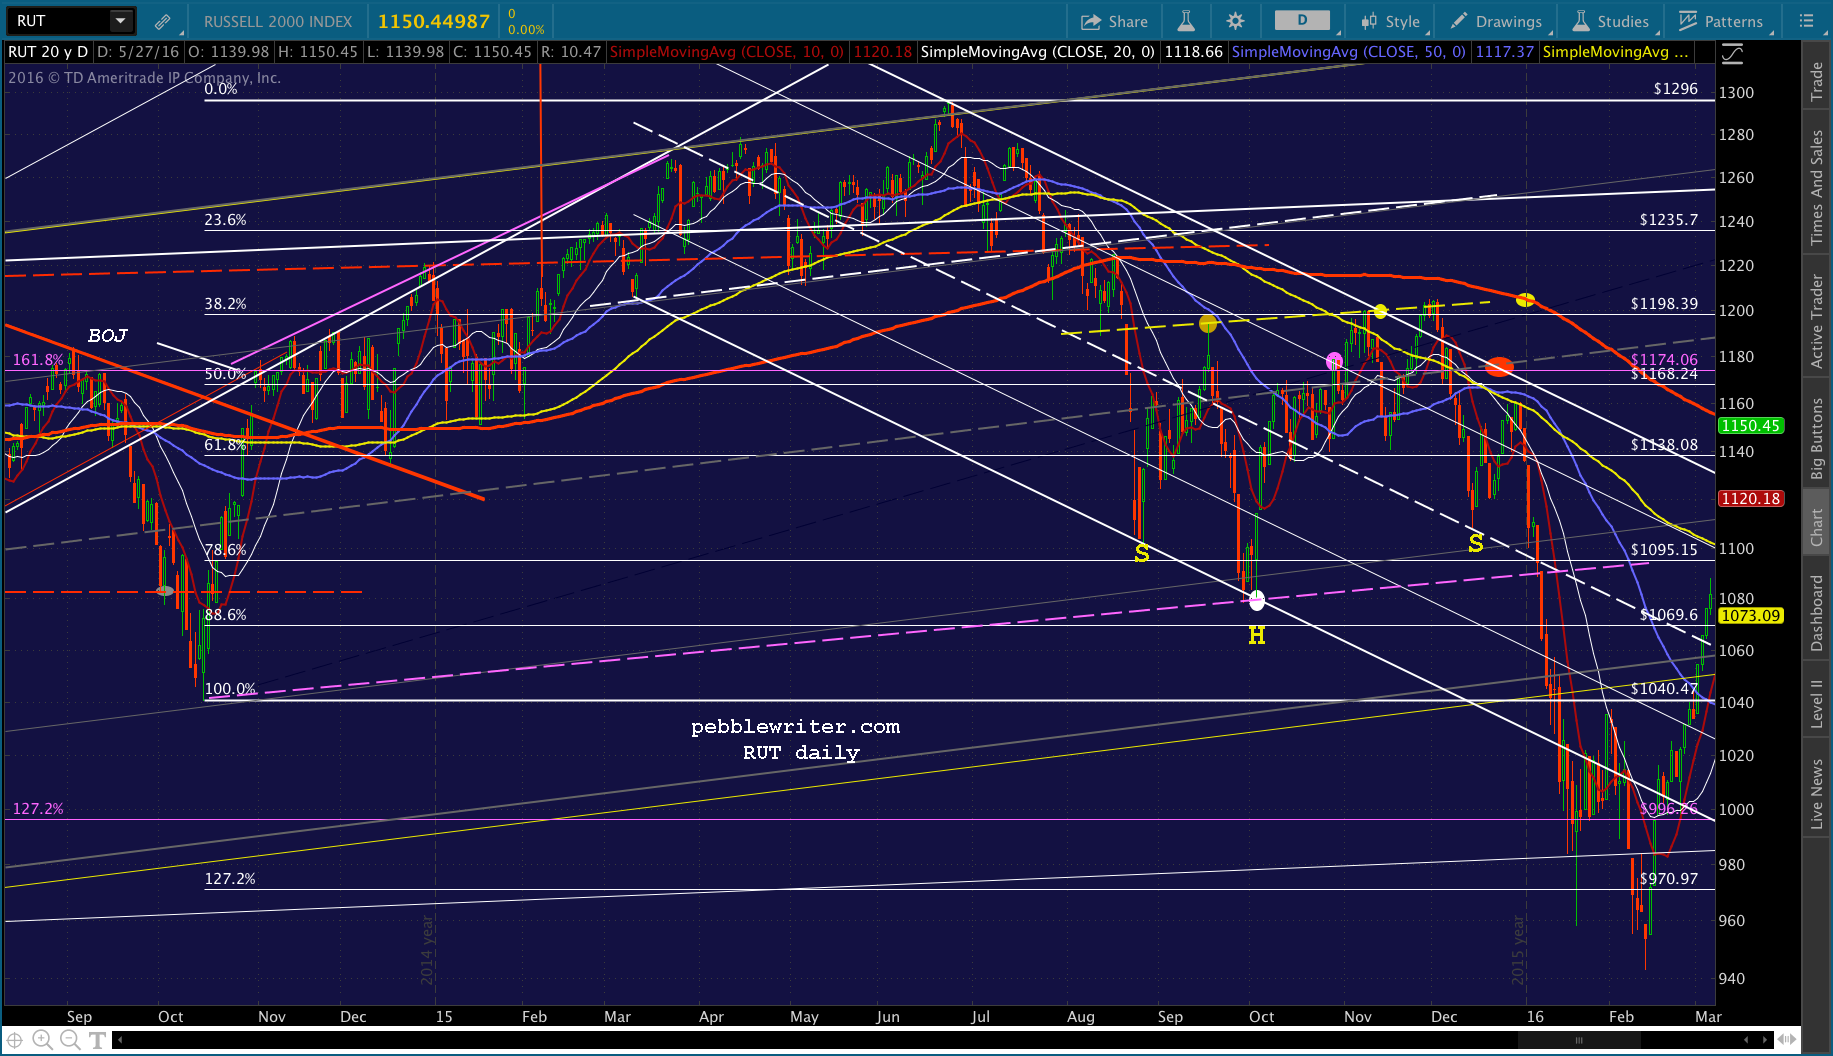
As it happened, USDJPY was in no mood to help. Instead of bouncing at 120.11 in the wake of the first Fed rate hike in nearly a decade, it dropped through and shed 12% over the next several months. With the yen carry trade unraveling, RUT plunged 19% over the next six weeks.
 continued for members…
RUT’s long term channel is a good place to start. Like many other indices, RUT should have reversed when it tagged the top of the white and yellow channels at the purple 1.618 in late 2013. (Of course, that was when USDJPY started making noises about heading higher again.)
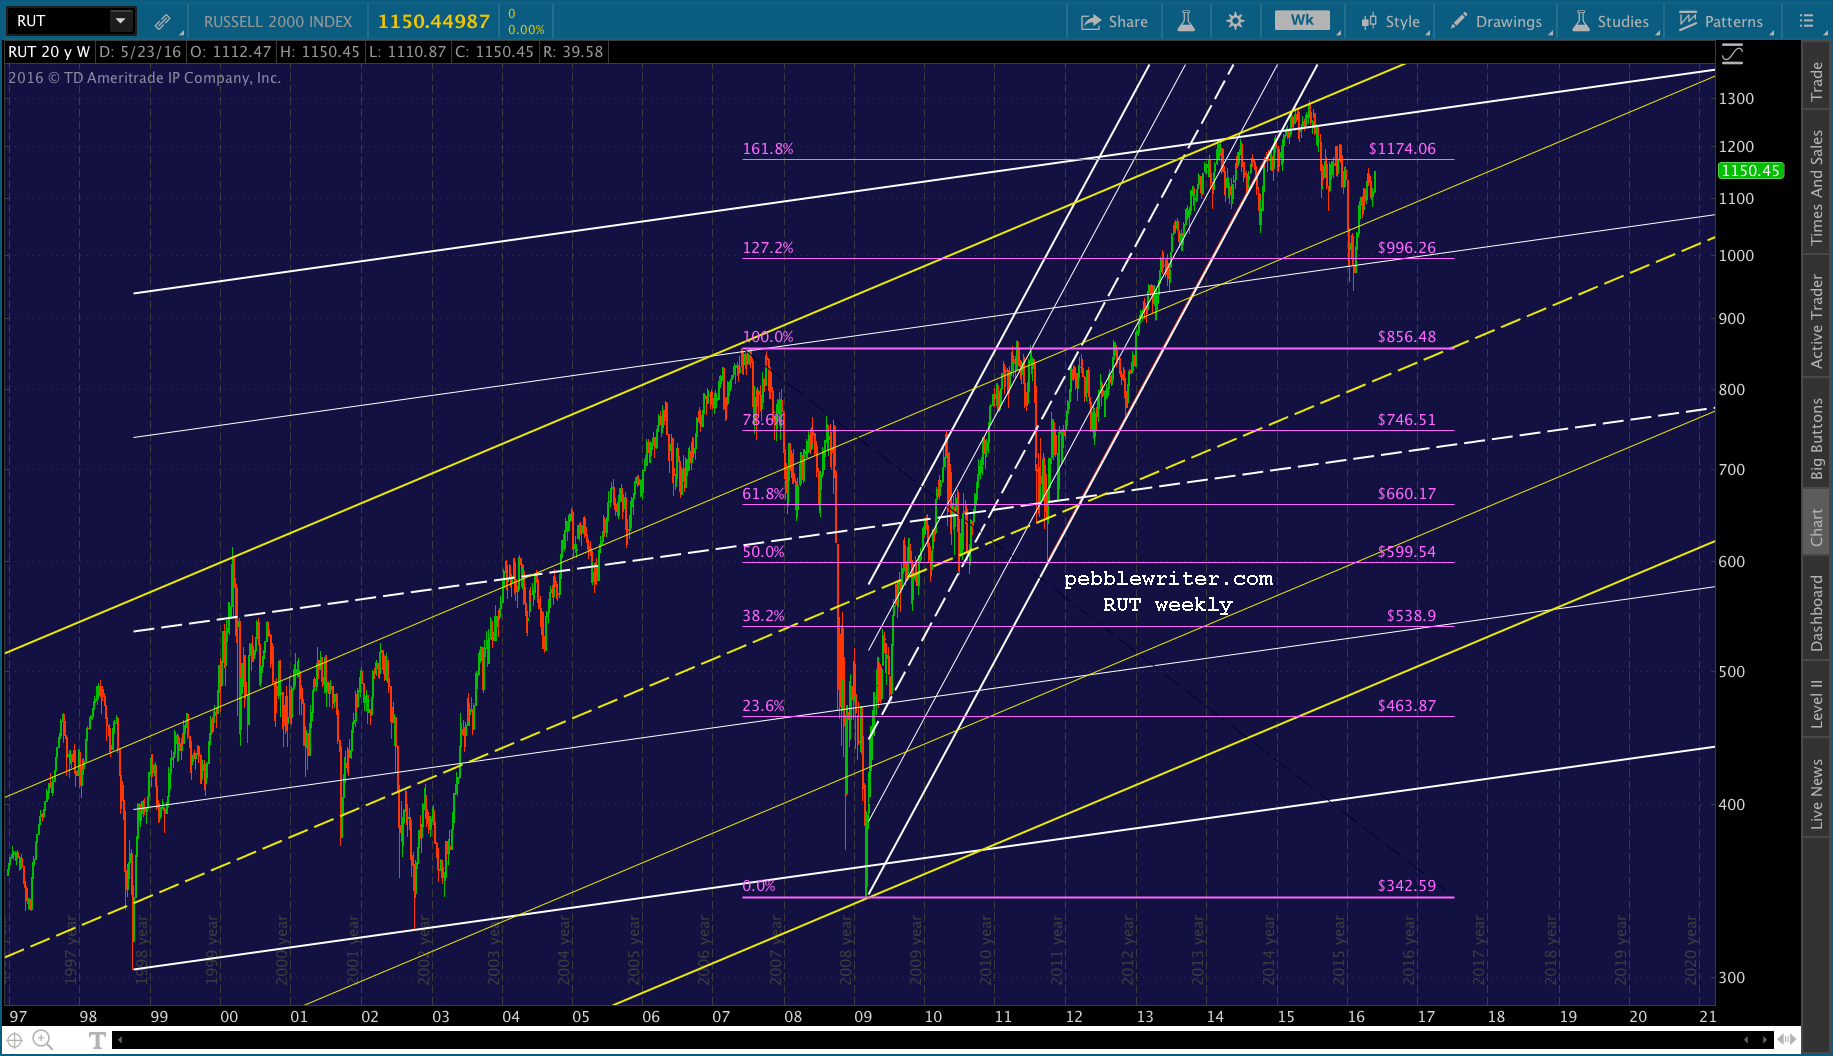 Instead, it went sideways for months, successfully avoiding a H&S Pattern that would have sent it to 870. It finally broke down, but bounced sharply in October 2014 (the Bullard Bounce) to new highs. It didn’t top out until late October, a month after SPX.
Note that it climbed the underside of the broken white channel for six months — all the way until it hit the top of the rising yellow channel again, at which point it climbed the underside of that channel for another six weeks.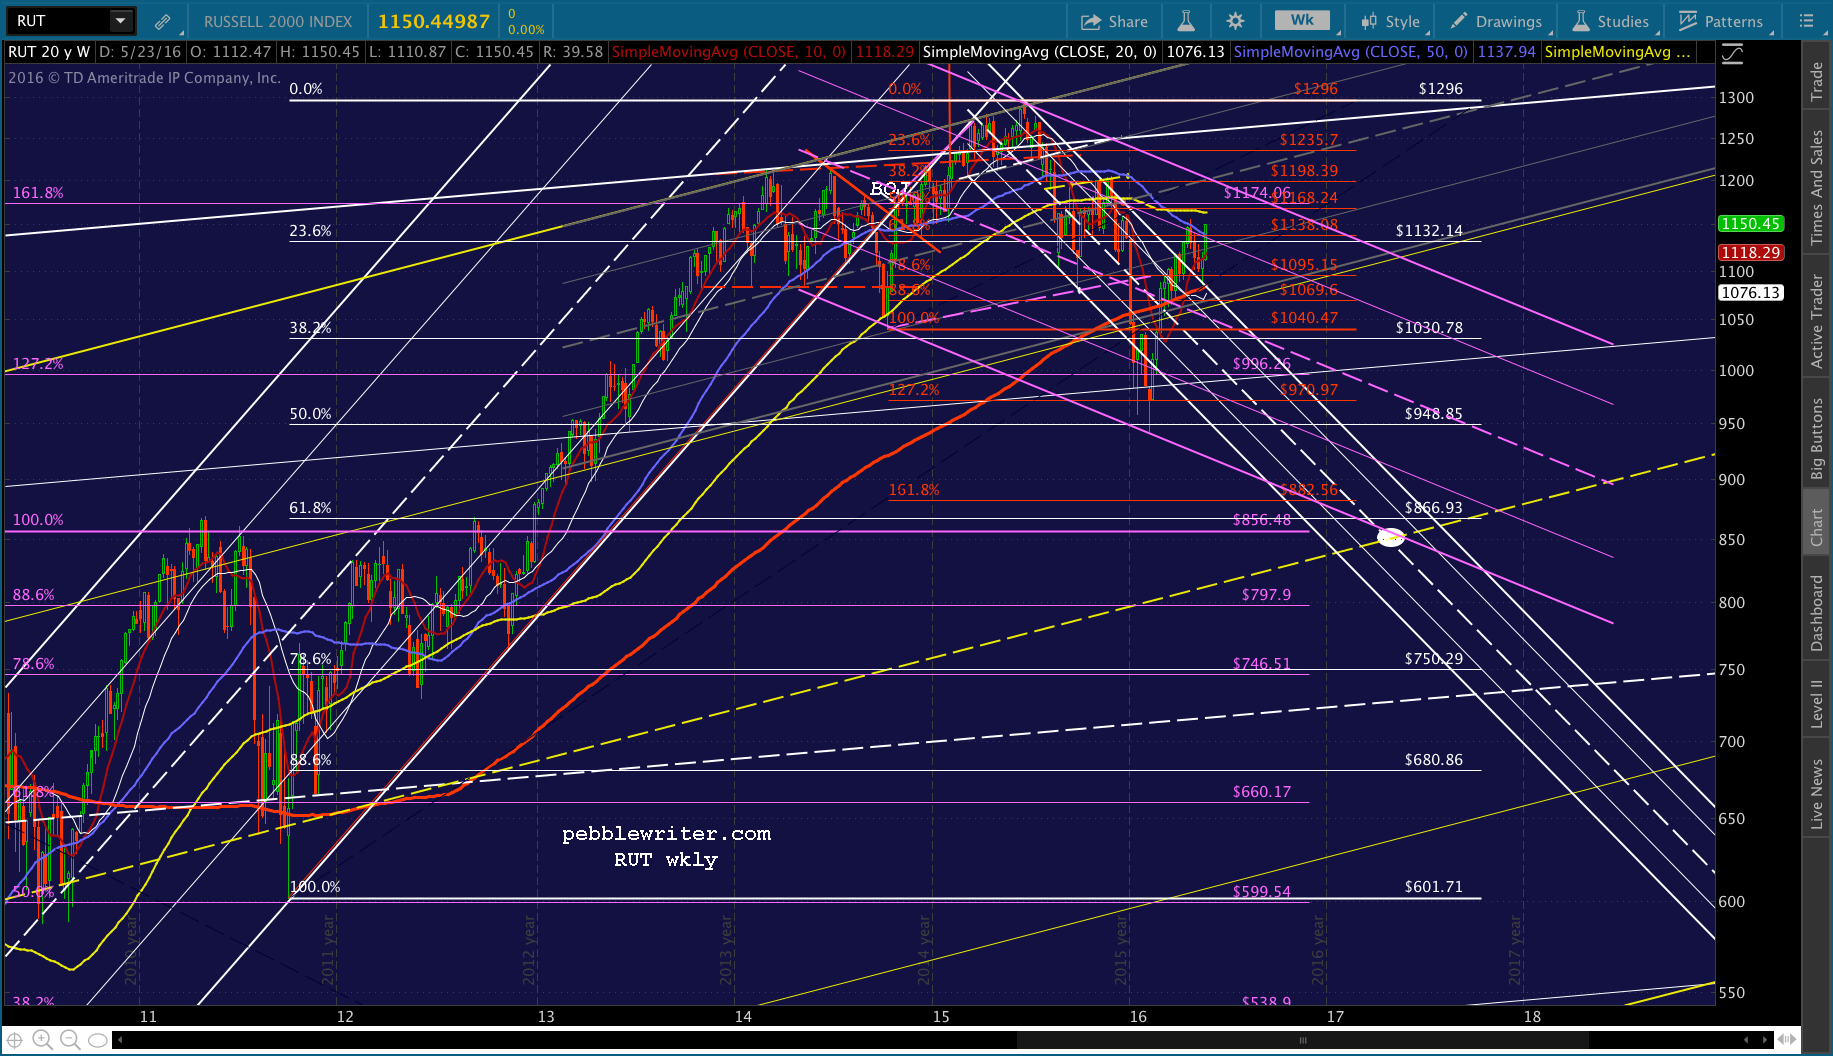 Eventually, it topped out — two weeks after USDJPY did. And, it eventually formed the falling white channel I mentioned in the Dec 2015 post.
In January, that falling channel broke down, and RUT continued until it found another means of support. I’ve inserted the falling purple channel above, which does a reasonably good job of capturing most of the turning points.
Note that RUT, after bouncing on Feb 11 when oil bottomed out, is back above the falling white channel. It even backtested it, for good measure. It looks as though it intends to test the top of the purple channel at 1200ish, though there could easily be a C leg down to 1070 first.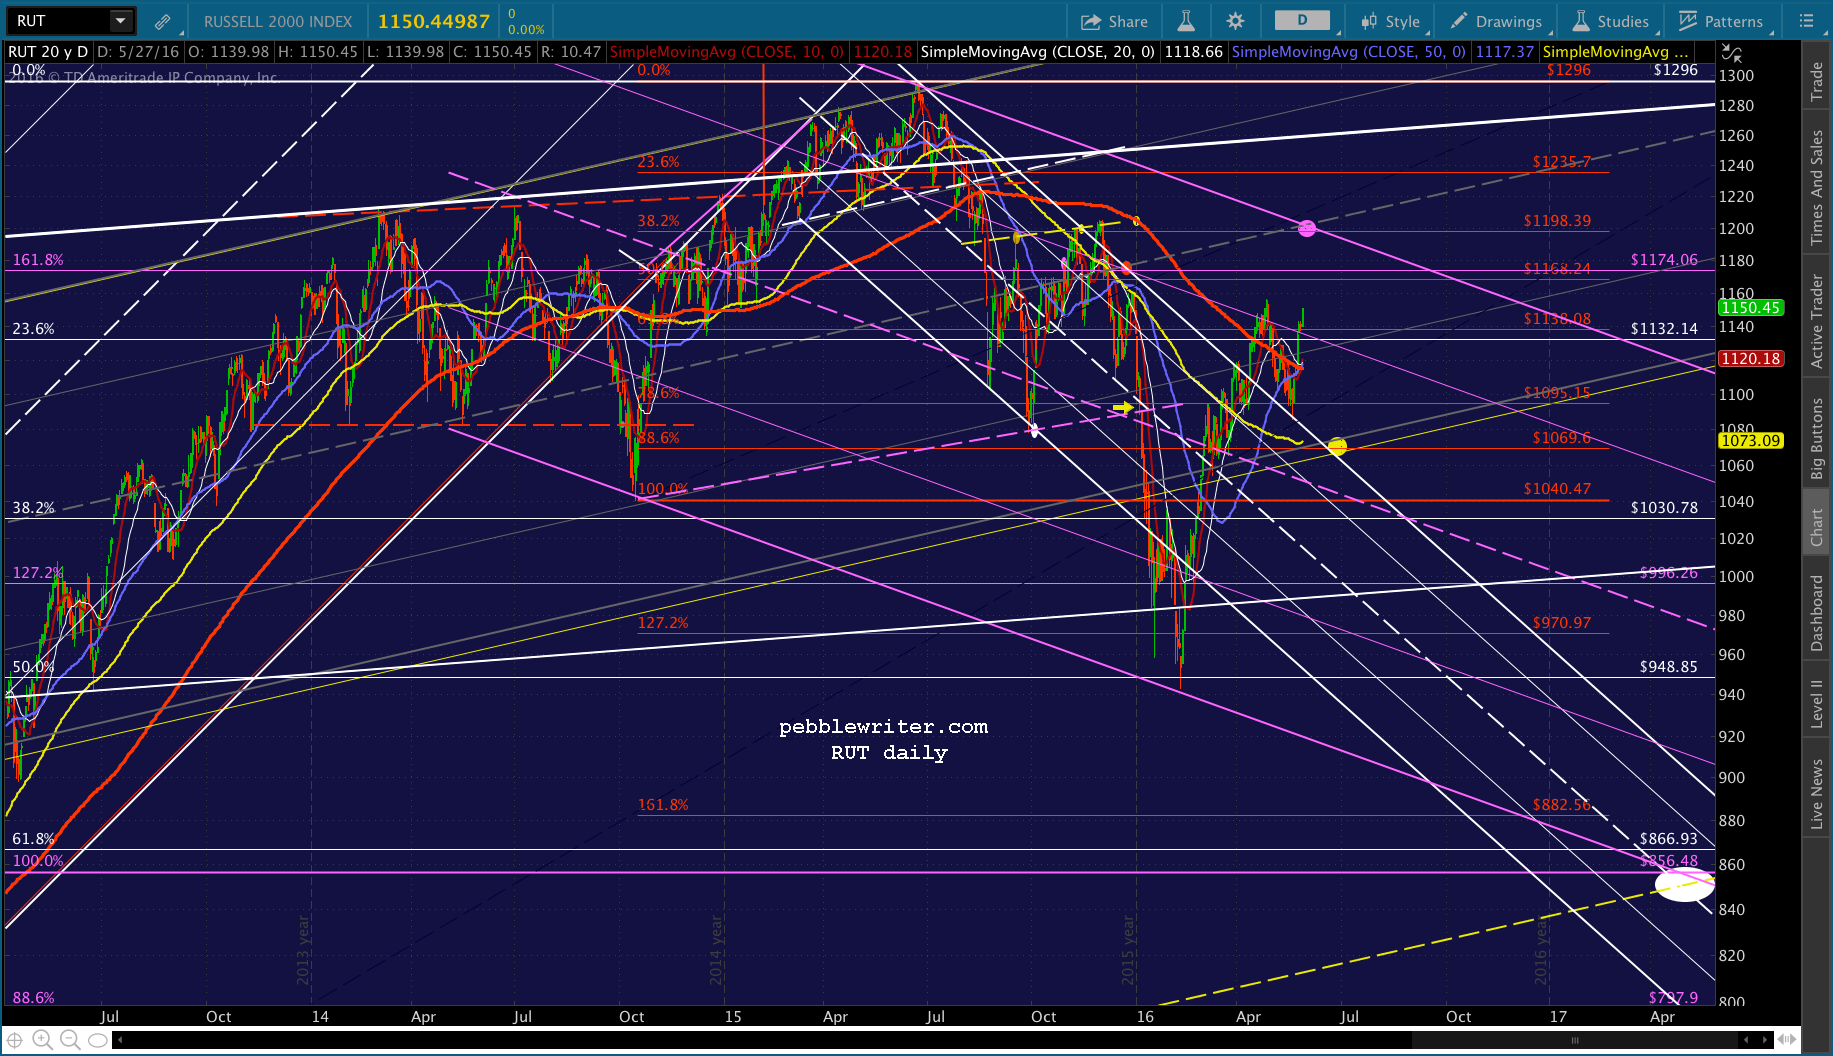
With another rate hike potentially on the way (we’ll believe it when we see it) we have to wonder whether it can actually push to new highs at this stage.
Having already reached the purple 1.272, it has satisfied the bare minimum reaction to that Fib. And, having already reached the red 1.272, it could conceivably be done with the downside Fib pattern. 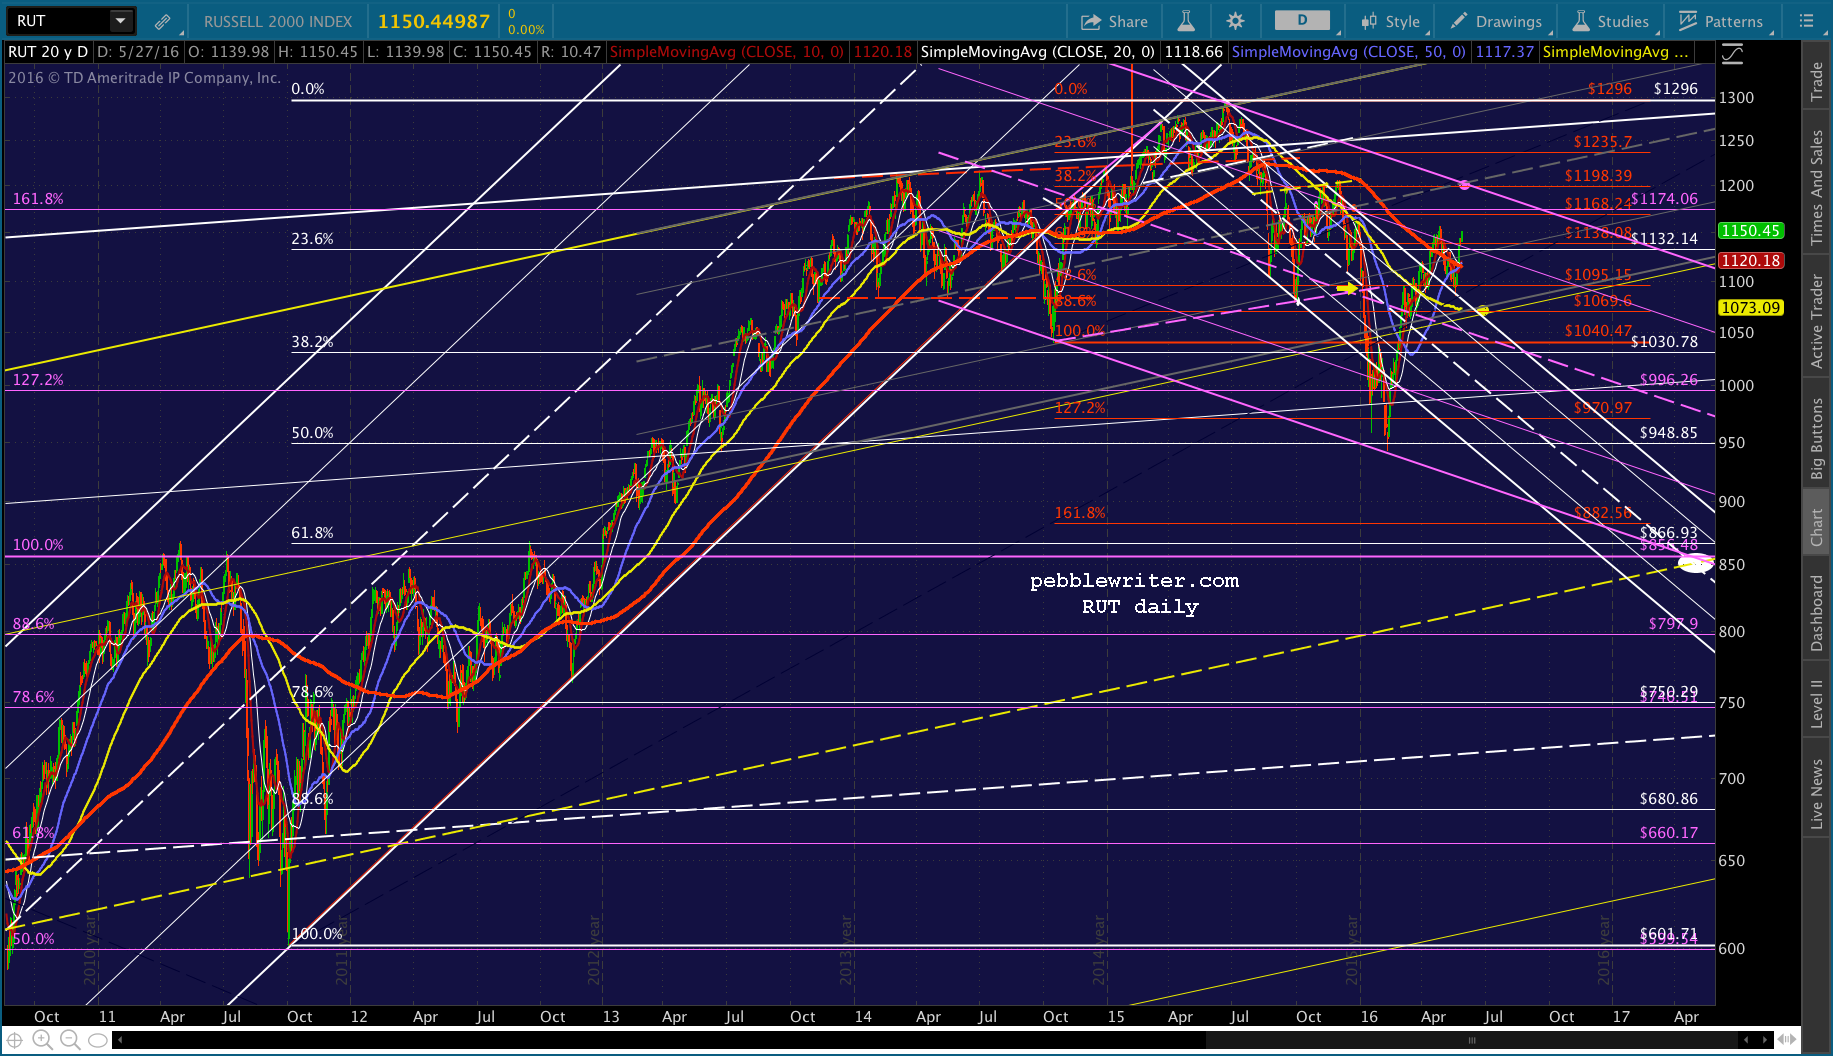
But, note the white dot in early May 2017 at 850-867. It represents the bottom of the falling purple channel, a backtest of the May 2007 and April 2011 highs,the red 1.618 extension, the white .618 retracement, the yellow channel midline, and probably some other stuff I haven’t even noticed.
It’s more than a little ironic that it’s the same price range that the 2014 H&S Pattern targeted. And, given that TPTB worked so hard to avoid that drop in the first place, it’s probably a long shot that it could fall another 24%.
If it bounces from here, the upside resistance consists of the purple .618 at 1161.19, the purple channel top at 1200, and the white channel top at the .886 of 1255.77. From there, it’s only 40 points to new highs. As in December, much will depend on whether or not the Fed announces another rate hike in June. It appears, at this time, that they’re trying to get it up past as much resistance as possible before that occurs.
Stay tuned.