Note: First quarter 2017 results have been posted. For the latest, including news about a membership promotion starting today, CLICK HERE.
Sometimes you’re the windshield,
Sometimes you’re the bug.
Sometimes it all comes together baby,
Sometimes you’re a fool in love.
Sometimes you’re the Louisville Slugger,
Sometimes you’re the ball.
Sometimes it all comes together baby,
Sometimes you’re going lose it all.
Mark Knopfler, Dire Straits
It seems another hedge fund bites the dust almost every day. It’s hardly surprising, given the state of the “markets” lately.

It used to be that having a strong grasp of macro- and microeconomics and financial statements was enough to generate respectable investment returns.
Now, it seems that funds have essentially three choices:
1) become a closet indexer — hopefully, with alpha thrown in from brilliant stock picking
2) be extremely nimble — avoid or take advantage of seemingly random rips/plunges
3) be one of the manipulators (or shadow them)
Being a closet indexer doesn’t work very well in a 2/20 structure. While there are certainly some great stock pickers out there, even great picks suffer along with everything else when the market is plunging.
And, it’s challenging to be nimble if you’ve got anywhere north of $1 billion — or, even $100 million. Given how low volume has become, stocks are sensitive to big moves into and out of markets.
This leaves our manipulators — central banks, their lackeys and big, data-driven firms which are able to shadow or emulate them: Renaissance, Citadel, etc. (some have even accused these firms of being able to help write the daily script via their ability to drive the algo drivers.) If you’ve got $20+ billion and like to throw your weight around, you can make your own luck.
Bottom line, stocks are driven all day, every day, by algos which feed off three primary drivers: the price of oil, USDJPY and VIX. Each of these is manipulated on a daily basis, primarily by central banks but almost certainly by other large players. If you haven’t noticed this, you haven’t been looking very hard. Together, they were entirely responsible for the election night recovery and subsequent Trump Rally [see: Why the Trump Rally Is a Fraud.]
 Yesterday, I forecast a pop and drop, calling for a short at 2351.52 (within a point of the top) which we then rode down to 2336.75 (within 2 points of the bottom.)
VIX, which was hammered over 12% off yesterday’s highs, is curiously on the rise. Could it be that this ramp job isn’t meant to stick? It’s been a while since we had a nice pop and drop… Note that the IH&S has completed, so this is a make or break moment for SPX. I’d short here at 2351.52 with tight stops.
We picked up 0.6% for the day only by watching and anticipating the price action and interplay between CL, VIX and USDJPY. It wasn’t an amazing day. But, string enough 0.6% days together and you get a nice month. Those who ignore chart patterns and technical analysis were left scratching their heads.
It works around 90% of the time. When it doesn’t, it’s because: (1) something big is happening that can’t be contained by a timely hammering of VIX or a USDJPY ramp; (2) those doing the manipulating have their signals crossed; and, (3) the move is imminent, but is delayed multiple times while the big boys position themselves ahead of time.
Last month, this approach generated 13.15% — a little below our average of 14.58% since Jan 2015, but better than the two previous months (meltups are challenging.) [see results.] While I generate medium-term and swing targets, about half of our returns are the result of intra-day swings — many of which are head fakes.
The worst are those at the end of the day. Yesterday’s close, for instance, saw a three-day old channel break down. In the old days (pre-2010) this would have been a bearish development, particularly since stocks are likely headed lower over the next week.
From yesterday, just before the close: But, a timely push above resistance by USDJPY and a timely after-hours dip by VIX ensured that SPX opened back inside the rising white channel. They can just as easily push SPX up and out of its falling purple channel. So, as is often the case, forecasting this beast involves discerning the intent of those who are doing the manipulating and contrasting it with inherent limitations they face.
A simple example is the USDJPY. By hammering the yen (an increase in the USDJPY) it’s easy to drive stocks higher. But, at some point, a cheaper yen hurts Japanese consumers and businesses who must pay higher prices for imported oil and food.
If you’re thinking “hey, wait a minute; this is the tail wagging the dog!” you’re absolutely correct. In fact, I’ve had even better results in forecasting currencies and commodities, as they usually wear their motivations on their sleeves.
If you’re thinking “hey, wait a minute; this is easy!” you’re dead wrong. I watch 10-12 charts on six monitors all day, and the interplay between them often defies logic. For example, we’ve had several instances, lately, of VIX and stock prices both rising or falling at the same time.
It’s also quite common for large moves to be delayed all day long, only to take place after hours. And, don’t get me started on intraday ramps in USDJPY that are unwound after the close each evening, when futures are more easily propped up (watch it tonight.) Even worse: ramping VIX overnight so it can be hammered during market hours when stocks need a boost.
All this to say…if trading has been tough lately, you’re in good company. If a $3 billion hedge fund with dozens of insanely smart analysts and traders backed up by world class research and computers can’t hack it, maybe it’s not them. Maybe it’s the market that’s broken.
Now, on to today’s forecast.
continued for members…
(more…)


 Remember, the annual pricing is available to current members. If your current membership hasn’t expired yet, we’ll tack your new subscription on to your current expiration date. This can be especially valuable for those who took advantage of a special last year which offered a discount on the first year of a auto-renewing annual subscription.
 The .886 retracement is considered the last stop before prices drop through the previous lows. Imagine: risk being considered lower than at any time since 2007!
 It was enough to keep SPX from completing a simple retracement from its .886 to its .786, or any meaningful dip until the final minutes of an otherwise nonsensical session.
 Today’s a new day, as CL is closing in on our 48.35-48.45 target and investors are no doubt anxious to express their disappointment with the lack of details provided for the fantastic, big-league tax cuts “revealed” yesterday.
 Despite the slight bump in futures overnight, our downside targets remain intact – starting with 2384.


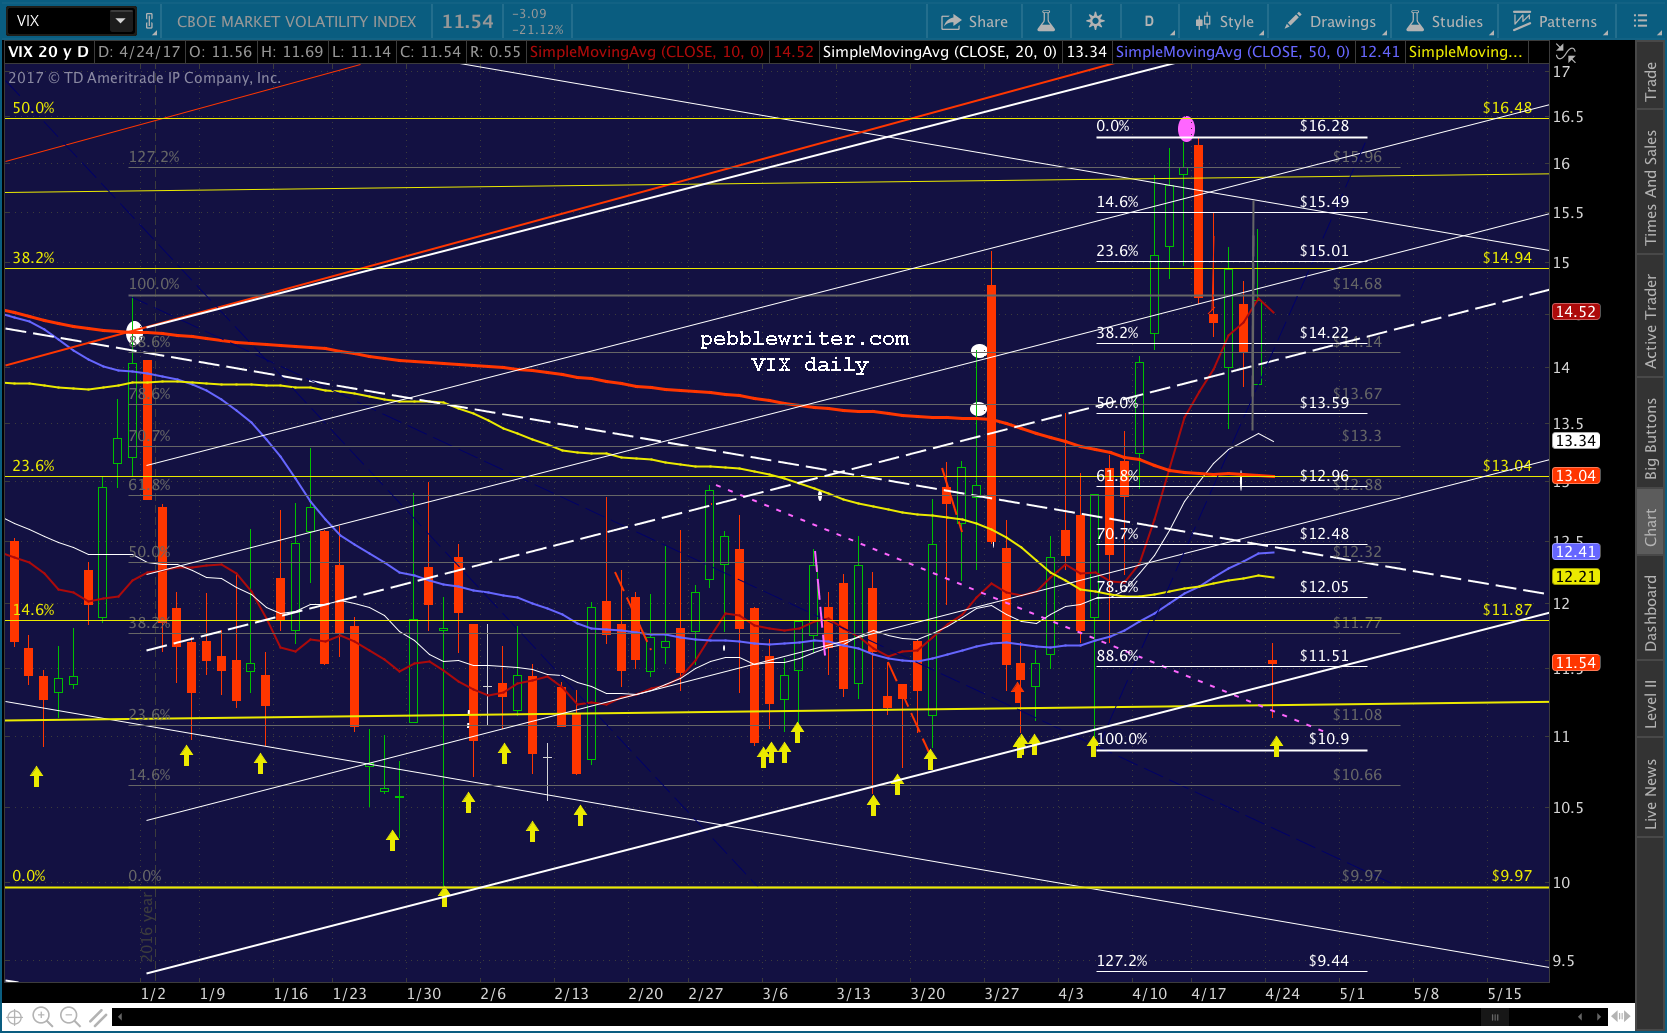


 VIX, of course, shed over 8% intraday — just because. It was enough to run some stops and put bears on edge. But, it wasn’t enough to break the negative trend that’s pervaded since the 2400 top.