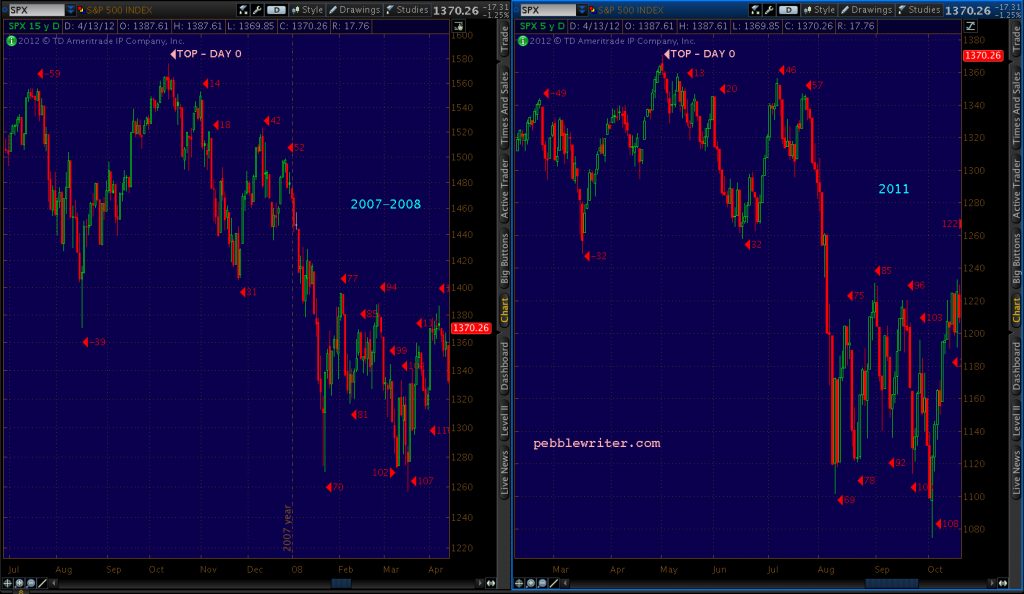

Futures are backtesting the 10-day SMA this morning in the wake of the first two day decline since March.
 Look for more to come.
continued for members… (more…)
Futures are backtesting the 10-day SMA this morning in the wake of the first two day decline since March.
Look for more to come.
continued for members… (more…)
A reminder, I will be traveling today and tomorrow. Please refer to Friday’s post for relevant targets for equities, currencies and commodities.

With various indices reaching or nearing important overhead resistance, today is shaping up as a moment of truth for a market which has delighted in head fakes. continued for members… (more…)
Despite a few tense moments midday, ES held the TL of support from last Wednesday and has rebounded to within 7.50 points of the important Fibonacci extension and channel top at 4153.62. Will the substantial overhead resistance at these levels matter this time? We’ll know very, very soon.
continued for members… (more…)
Futures were on the path to tag an important Fibonacci extension this morning when someone committed the cardinal sin of checking the headlines. The 6-point gain turned into a 2-point loss, causing VIX to swing into action. Can its sudden 7.63% plunge compel algos to prop up stocks yet again?
 continued for members… (more…)
This CPI data is significant in that it shot up over 2% – the highest since 2018 when the prints of 2.95% (July) and 2.70% (Aug) sent the 10Y up to 3.25%.  But, it’s the inflation happening right now, which will be reported next month, that the Fed is worried about.
As we’ve anticipated, March’s 2.6% YoY print was largely the result of a large (22%, should be 28%) increase in gas prices. Though clearly non-transitory food, utilities, used cars and medical services all played an important role.  The data next month, however, will put this to shame. As things stand now, April 2021’s gasoline prices (2.77) are up a whopping 60% over 2020 prices.
 As we’ve discussed many times, this should put CPI at over 3% – perhaps closer to 4%.
 The Fed seems to be betting that it can divert attention from the coming data. And, maybe they can, as bond prices seem to be immune to this data and the recent blowout PPI.
 But, it remains to be seen whether the usual algo tricks will be able to handle a CPI print of over 3%.
continued for members…
It is fitting that BTC chose the day the latest CPI data is released to reach our next upside target. From Bonds Not Buying It on Feb 23:
BTC even managed a proper backtest of the last major Fib level, opening the door to the next upside target at the purple 3.618 extension at 62,977.
 continued for members… (more…)
Futures are off slightly on a low volume Monday following what should have been a bigger reaction to the latest PPI data that was off the charts.
 Either bond traders all took Friday off, or it would appear that the Fed has taken “supporting” the markets to new heights.
Markets will have another chance to react this morning…unless, of course, VIX futures fail to react to the obvious support. continued for members… (more…)
Back on Feb 25 Q4 GDP came in at 4.1%, so hot that S&P futures plunged over 100 points as investors quite rightly wondered how it might affect the Fed’s easy money policy. This morning’s March PPI at 4.2%, the highest since 2011?
 Yawn.
 Perhaps the reason the Fed is so unconcerned with the huge spike in inflation is because its trading desk has been so busy making sure that the “market” doesn’t react negatively. Compare Notes’ reaction [see: Bonds Not Buying It] then and now.
 The algos have been busy this morning, with the usual pre-opening shot across the bow from VIX.
 continued for members… (more…)
I received several nearly identical emails yesterday asking whether SPX’s tag of its channel top meant a downturn was imminent. The problem lies with the word “imminent.” We can certainly make a cogent argument that the market is in a bubble: a car company with a market cap of $1.25 million per car sold; more SPACs going public in Q1 of 2021 than in all of 2020 (hundreds of which have yet to buy anything); meme stocks whose PEs would be in the hundreds if they had any earnings; pictures of sneakers selling for $10,000. The list goes on…
Yet at the end of the day, there’s still so much money sloshing around that dips have not only been few and far between but are very aggressively bought. Those tasked with investing said trillions have settled for relative value rather than value. And bears have been laughed out of the game altogether – easily overpowered by algorithms and the innumerable strategies which key off them.
We posted this chart on March 23 [see: Fedsplaining] after SPX had been rejected by its 3.618 Fibonacci extension at 3956, noting that anyone (a central bank for instance) wanting to push stocks above that resistance need only to ensure that VIX breaks down below that falling white trend line.
 We examined the same phenomenon back in early 2019 in the wake of the Dec 2018 PPT action [see: The Plunge the PPT is Really Protecting] and countless other times.
It should come as no surprise that VIX did break down and SPX did, indeed, rise above 3956. Like all the other breakdowns, this one has the potential to keep the party going long past curfew.
 So…another one of those lovely situations where numerous chart and technical patterns suggest a significant selloff just ahead — but, algos are standing in the way. Which will win out?
continued for members… (more…)