

In a presentation to the CFA Society in July 2019, I showed the following chart which seemed to capture the Fibonacci and channel picture quite well. SPX was nearing the top of a large channel dating back to 1986 as well as the 2.618 Fibonacci extension of its 2007-2009 crash. It was an excellent setup for a correction.
 SPX had reacted at the top of the channel three times in the past two years: an 11.8% drop in Jan-Feb 2018, a 20.2% plunge in Sep-Dec 2018, and a 6.8% slide in Jul-Aug 2019. None of the corrections bounced at traditional support, and all rebounded to slightly higher highs within 3-7 months.
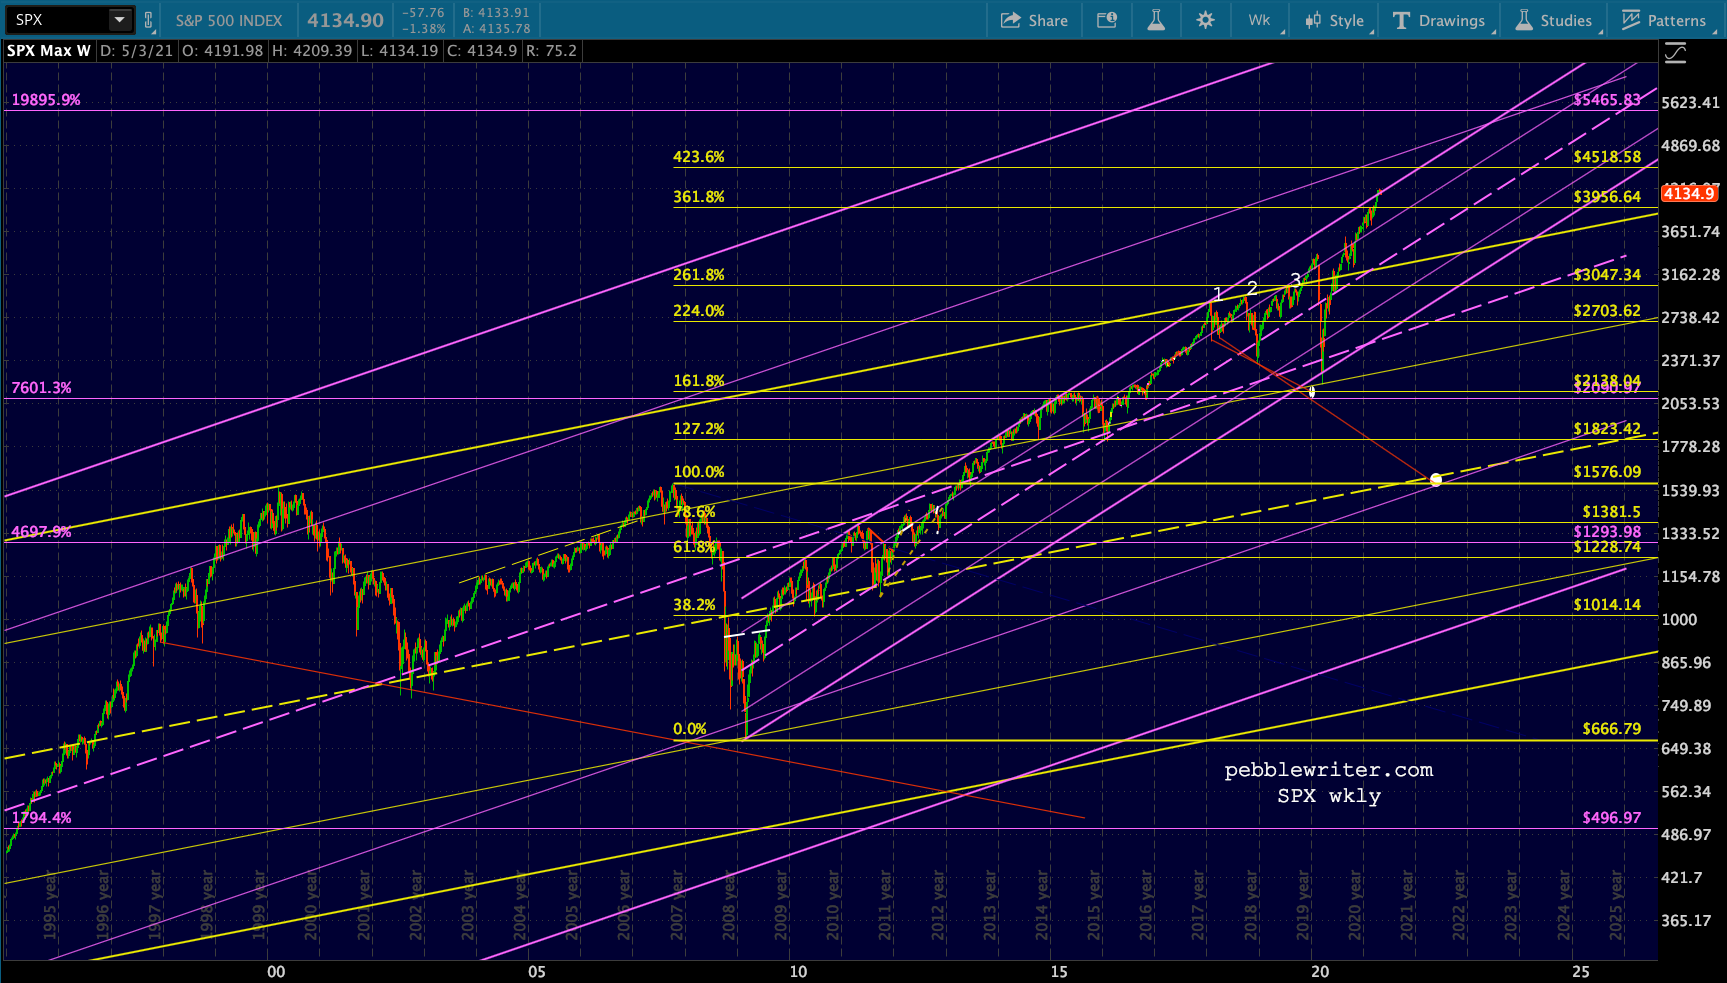
It made sense, therefore, that SPX would react more significantly upon finally reached the 2.618 extention at 3047.23. The most logical target after reversing would be the next lower fib level at 2703.62 and, if that failed, the 1.618 at 2138.04 (it was never properly backtested.)
If 2138 failed, then the charts suggested the possibility of a backtest of the October 2007 highs at 1576 when the yellow channel midline reached it in 2022.  Instead of reversing, SPX leapfrogged 3047 in November and didn’t look back until February when it plummeted by 35.4%, just missing a backtest (better late than never) of the 1.618 Fib at 2138.
 At that point the Treasury and the Fed got involved and the rest, as they say, is history.
With chart patterns and technical analysis, it’s often quite useful to go back and look at past patterns. Much can be learned about why things happened and how past patterns could repeat.
This morning, for instance, it appears we’re finally going to get a backtest of the most recent Fib level to have been leapfrogged.  Better late than never.
continued for members…
The Big Picture:
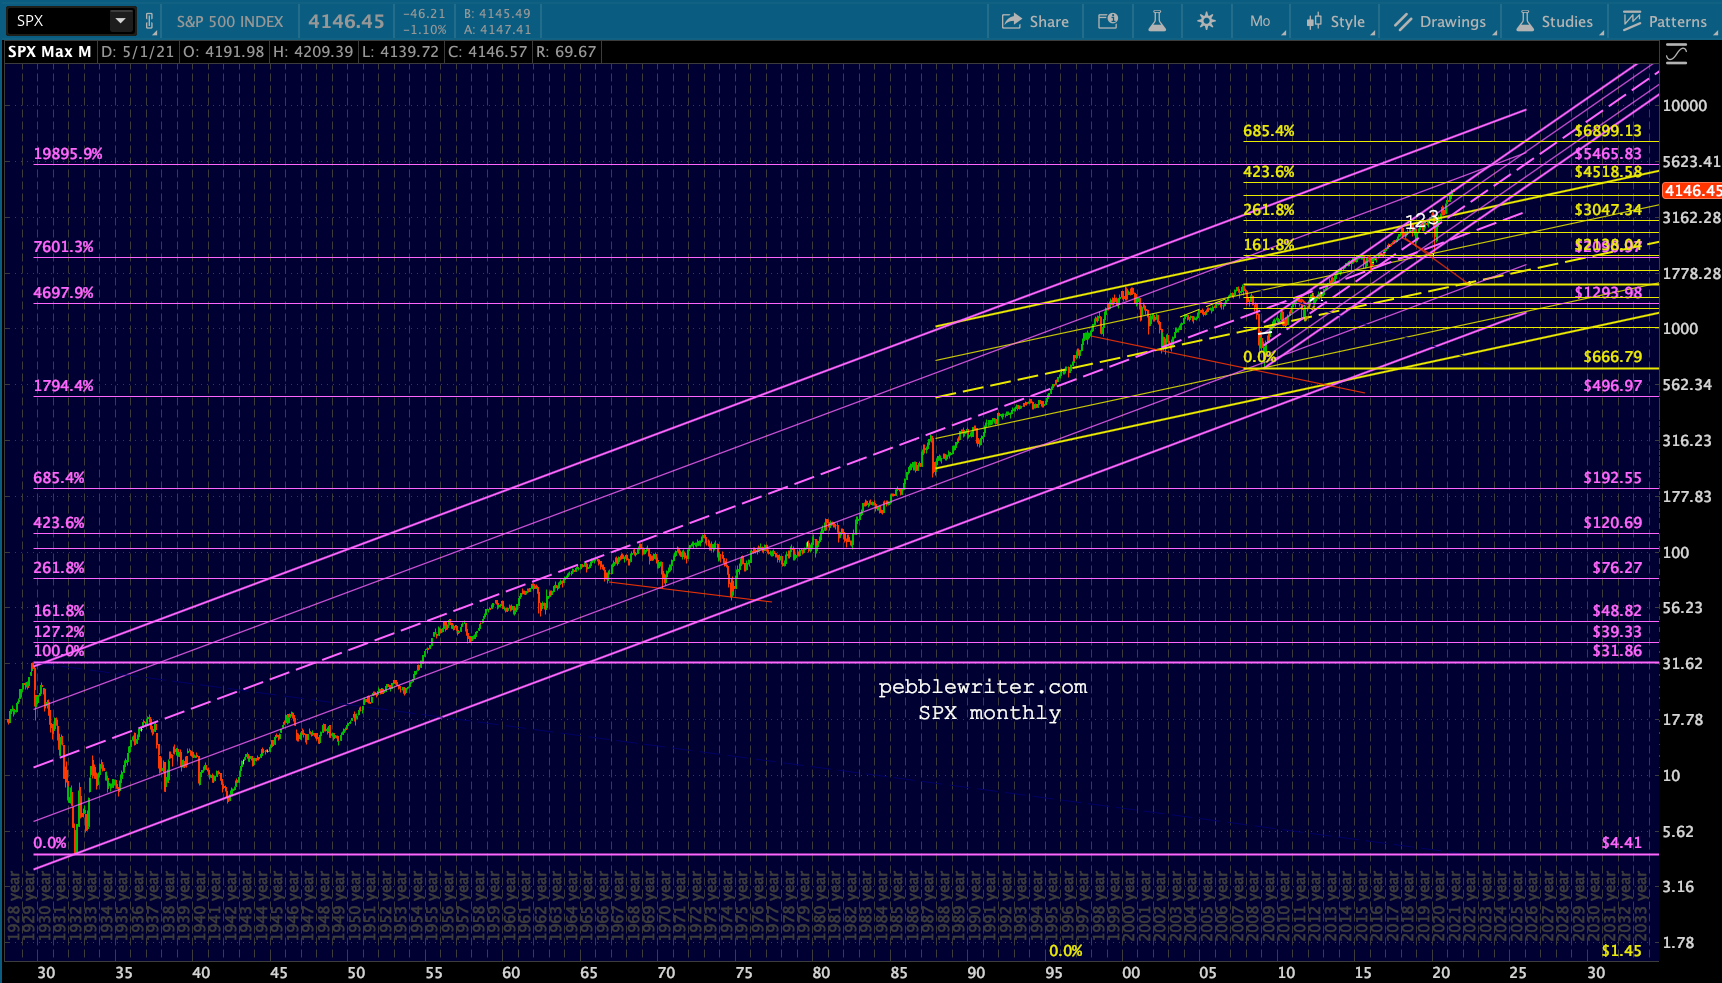
When SPX breaks out of a channel, we need to zoom out and see what’s next. In this case, it’s this purple channel dating back to the 1920s. Its fit isn’t exactly a thing of beauty. If we accommodate the 1942, then the series of midline tags between 1956-1968 fit really well – but the 1974 lows don’t reach the channel bottom and the 1987 crash lands in no-man’s land.
 If we key off the 1974 lows, then the 1942 lows don’t work and the 1956-1968 tops are in no man’s land – though the 1987 lows work nicely.
 The reality is that the S&P 500 didn’t really exist prior to 1957. The price levels from prior years are manufactured/estimated based on assumptions of what would have been in the index. In other words, it would make sense for the channel not to work perfectly prior to 1957.
The one thing that works pretty well is the alignment of Fibs from 1929-1932 with SPX levels in 1956, 1962, 1968, 1972 and then again in recent years.
 A closeup:
 The Dow, on the other hand, has been around since before the Depression. Although its composition has been heavily manipulated, it makes for a much better fitting channel.
 It was selective in which Fib levels it paid attention to over the years (the purple 2.618, 4.236 and 6.854) on the way up, but often paid a lot of attention to backtesting both Fibs and channel lines as we saw in 2015-2016 and most notably, the trifecta of the white channel bottom, 2016 post-election lows and yellow 1.618 backtest in Mar 2020. It has also shown the ability to repeatedly bounce at its 200-week moving average.
 As we’ve been discussing for the past week, it is back to the top of the smaller rising white channel and yellow 3.618 Fib extension in the process of forming a pretty well constructed rising wedge. So, it would make sense for it and the overall market to correct here.
 continuing…
UPDATE: 8:00 AM
Now, a quick look at this morning’s charts showing the 1.618 as well as several other levels of support if 4153 doesn’t hold.


 Anything more significant than 4153 will require that VX break out of its flag pattern…
 …and that USDJPY not break out of its falling purple channel.


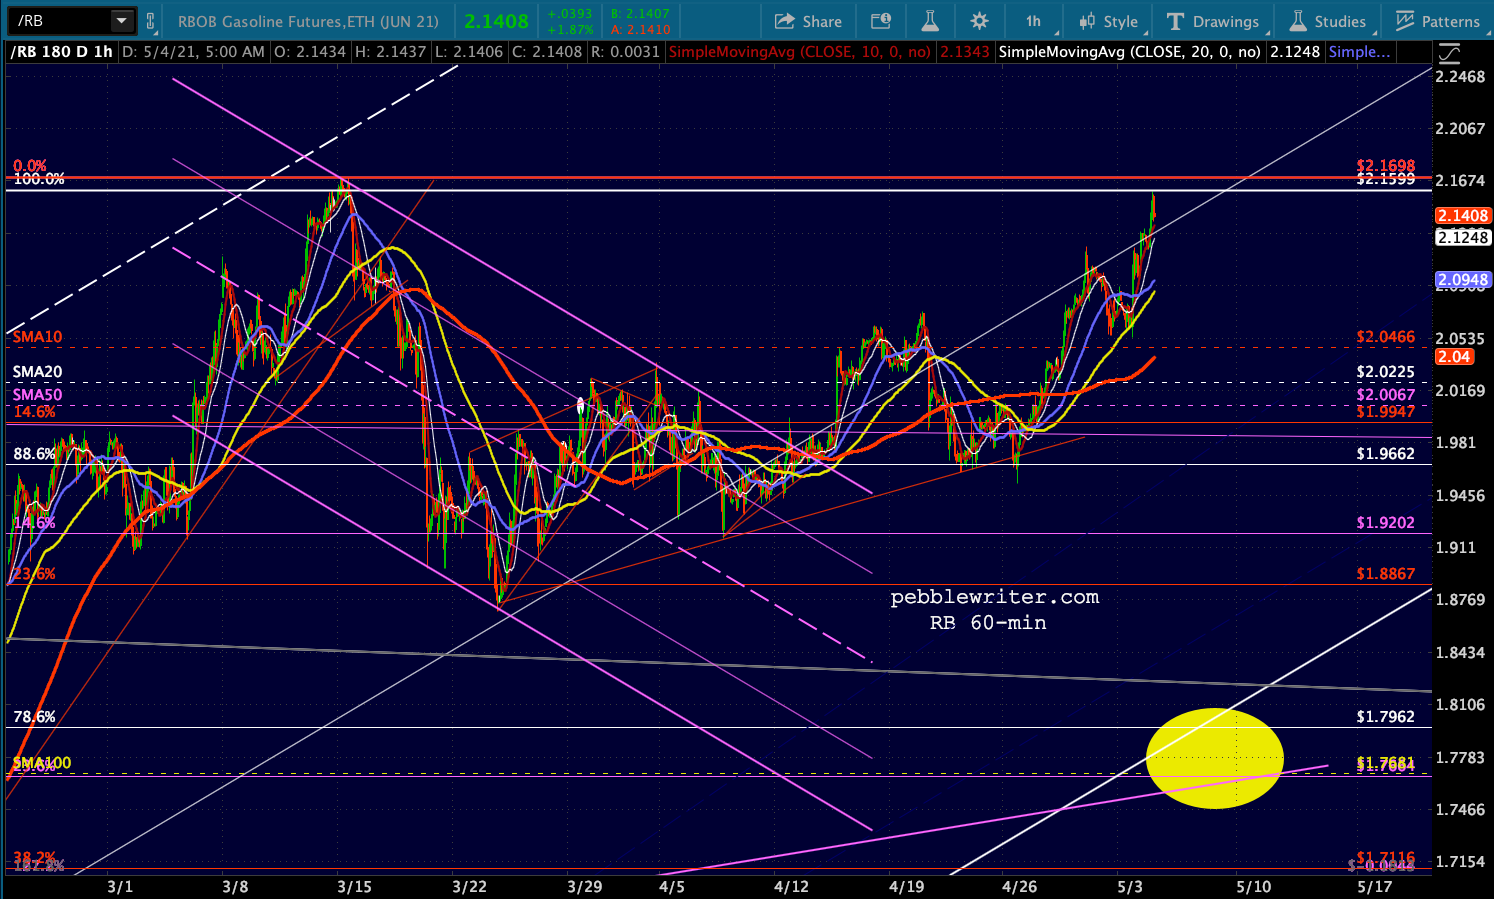
 It would also be helpful if CL and RB were to reverse meaningfully.
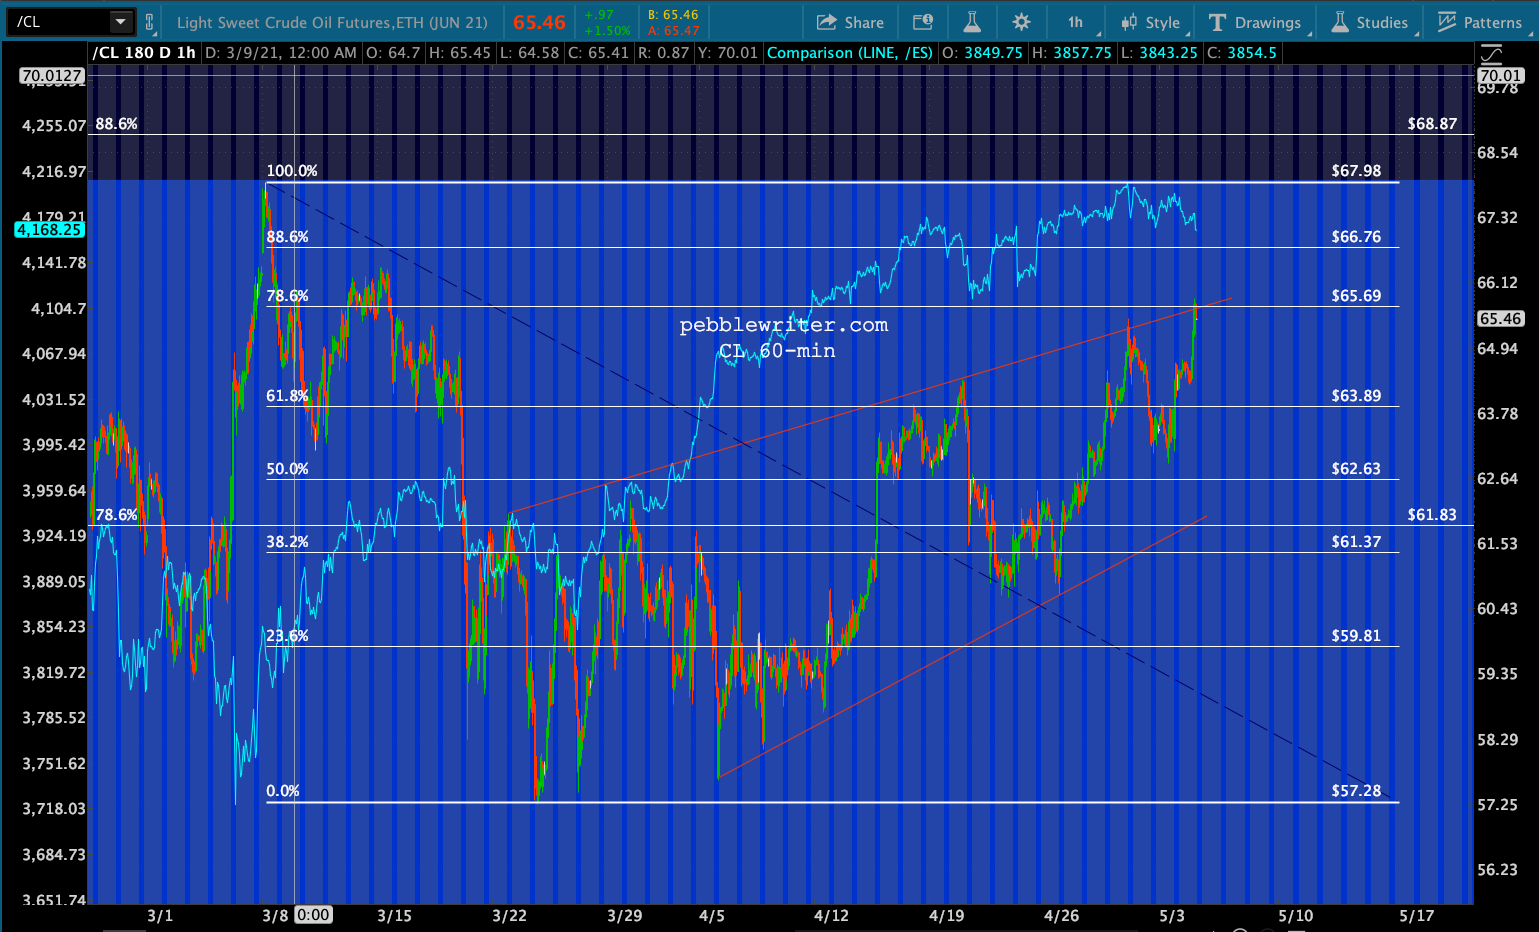
 Other charts worth watching include the 10Y…
 …and, of course, NKD and DJIA.
 UPDATE: 12:00 PM
ES has sold off nicely, backtesting the red TL (former neckline) and white channel .786 line a few days later than would have been ideal (again, better late than never.)
 We’re still owed a 3.618 backtest at 3997.93. The sooner it happens, the more appropriate it would be. With VIX still well below its SMA200 and channel top, it seems like it would be within reach.
 And, we would also need USDJPY and CL to settle down.

