Posts

  • The Big Picture: Mar 19, 2021

    We finally saw the first big selloff of the tumble in oil and gas prices we forecast months ago [see: Jan 13 Update.]  Though the technical damage isn’t that great yet, it’s only getting started. I’ll focus today on how the decline in oil/gas should play out over the next several months and how other sectors of the market should react.

    I think the writing is now officially on the wall: the Fed must tread very carefully, especially over the next 4-6 weeks. The good news is that there should be some excellent swing trading opportunities and there is still plenty of time to position for them.

    continued for members(more…)

  • What Would Rising Rates Mean for Home Prices?

    You didn’t have to read any further than the title of Freddie Mac’s latest quarterly market report to understand what’s happening in the housing market:

    It made me wonder just how important lower rates have been to price appreciation.  And, given the Fed’s purported insouciance toward rising rates, how alarmed should we be that rates are spiking higher?

    Home buyers usually base purchase decisions on what they can afford (or what they can qualify for), and affordability comes down to purchase price and interest rates. So, it’s a fairly simple process to assess the effect of one on the other.

    The National Association of Realtors (NAR) reported that January 2021’s median sales price for existing homes was $303,900 — 14.1% higher than in January 2020 ($266,300) and 21.9% higher than in January 2019 ($249,400.) If you owned a home during this time, congratulations!

    If you don’t mind looking a gift horse in the mouth, you might be wondering why prices increased so much. As it turns out, a great deal of the appreciation was due to the historic drop in interest rates. Let’s take a peek under the hood.

    Freddie Mac reported that the average interest rate on a 30-year fixed conventional mortgage in late January 2021 was 2.73%.  Assuming taxes and insurance at the nationwide average and a 20% down payment, the monthly payment (PITI) for a $303,900 home would have been $1,347. A buyer would have needed an annual income of about $57,730 to qualify.

    Since median household income in the US is currently about $78,500, the median home price of $303,900 seems reasonable. [Of course, housing is not affordable in many cities — particularly in larger cities and on both coasts.]

    One year ago, in January 2020, with rates at 3.51% and an income of $57,730, you could have purchased a $275,227 home. And, in January 2019 with rates at 4.46%, you could have purchased a $245,370 home. In other words, the drop in mortgage rates alone accounts for a 23.9% increase in value. Remember, the NAR reported an increase in the median sales price between January 2019 and January 2021 of 21.9%. So, all else being equal, the increase in value for the median existing home was entirely attributable to the drop in interest rates.

    Imagine the effect of all that wealth created out of thin air, and it becomes easier to understand the Fed’s motivation in driving rates to all-time lows.

    Of couse, the drop we’ve seen over the past 10 years is nothing compared to the drop over the past 40 years.Thank you, Fed. All’s well that ends well, right?

    Not so fast. If falling rates can result in a sharp increase in value, what about rising rates? As interest rates rise, the income required to qualify for a loan increases. This wouldn’t matter much if your income were stable and you planned on owning your home for, say, the rest of your life.

    But, what if you want or need to sell your home in the next few years in the midst of a rising rate environment?  If rates were increasing, the average buyer might be less willing or able to pay your asking price. You could hope that your buyer’s income rose enough over the years to compensate for the increase in payment.

    But, “hope” isn’t really a strategy, is it? So, let’s do the numbers. Let’s assume rates rise over the next year to where they were one year ago, and that rates two years from now revert back to where they were two years ago.

    Remember, the Fed’s policy of lowering rates to historic lows would have enriched you by $72,000 over the past two years – not bad, considering you made a down payment of only $61,000 and were able to write off the bulk of your monthly payments.

    An increase, on the other hand, to 3.51% by 2022 would reduce the value of your $303,900 home to $275,227 – a 9.4% drop. If you were to sell at that price, you would net only $15,593 after paying a 6% commission and paying off your $243,120 mortgage. In other words, you would have lost 74% of your original down payment.

    An increase to 4.46% by 2023 would further slash the value of your home to $245,370 – a 19.3% haircut from its original $303,900 value. After commissions and settling up with the bank, you would owe $12,472.  Including the $60,780 down payment, you would have lost a total of $73,252 – 121% of your initial investment. Ouch.

    Someone gleefully signing up for a $567,000 mortgage at a rate of 2.73% on a $709,500 house (the average) in Los Angeles because the $2,900 house payment is even lower than their rent payment would do well to consider the repercussions of rising rates.

    If rates simply reverted to 2019’s 4.46% when they sold, they’d need to write a $29,000 check at closing – a bitter pill after waving goodbye to their $142,000 down payment.

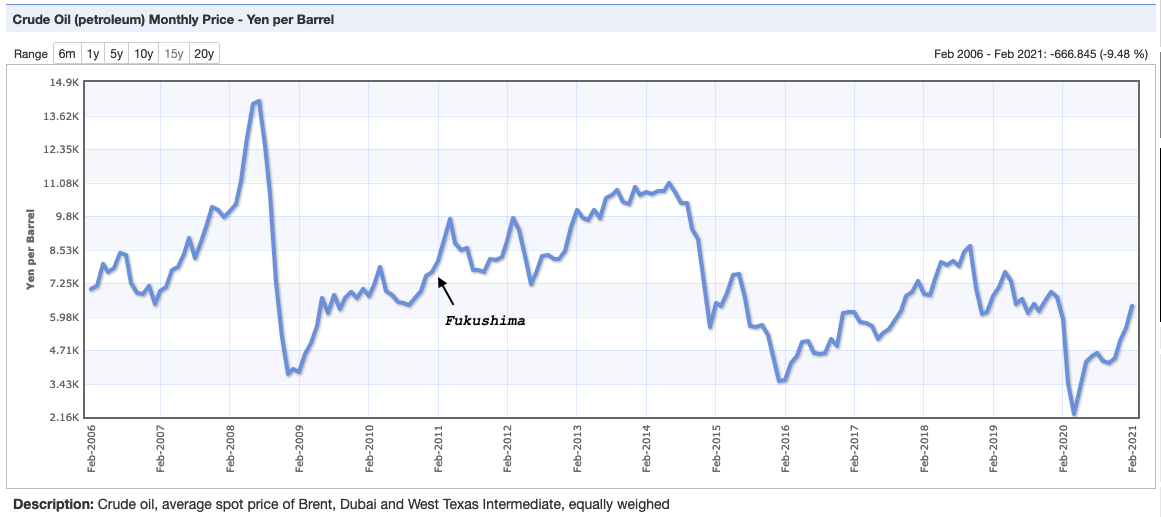
    Is such an outcome in the cards? I doubt it. As we’ve discussed countless times over the years, the Fed needs higher interest rates and inflation like a fish needs a bicycle. While inflation is set to spike much higher over the next 4-6 weeks due to sharply higher oil/gas prices…

    …I have little doubt that oil/gas prices have already begun their collapse. It’s one of the very effective ways central bankers have been able to quickly bring inflation back under control in the past. Yes, we’ve seen this movie before.

    Jay Powell insists the Fed’s not worried about higher inflation and higher interest rates. That makes them either liars or fools. And, I sure don’t take them for fools.

    continued for members(more…)

  • Push Comes to Shove

    Today should be all about whether the FOMC can stick to its oft-repeated stance that they’re not worried about inflation and interest rates. They way things look this morning, the market isn’t buying it.

    And, there’s no reason it should. With yields continuing to push through resistance, the writing is on the wall.Rising rates might not affect all those megacap companies that can and have borrowed all they need at historically low rates or issue stock at inflated multiples. But, they will affect nearly every other segment: small and mid-cap public companies, small businesses, individuals with credit card debt, home buyers, car buyers…the list goes on.

    Unless oil and gas prices come down sharply in the next 30-45 days, push has come to shove. This morning’s EIA inventory data will attract extra scrutiny, as it should. If the oil/gas rally is to end, we should see some decidedly bearish signals.

    continued for members(more…)

  • No Regrets

    In the words of the immortal Edith Piaf: “I do not regret anything. No, nothing at all.”

    SPX popped up over the potential resistance of its 3.618 Fibonacci extension in the final minutes of (algo) trading yesterday……almost entirely on the ongoing beatdown in VIX. And, since the Fed kicks off its 2-day meeting today as very disappointing retail sales and industrial production data (both dropping more than at any time since Mar 2020) are released, don’t look for algos to express any remorse for their bullish ways.

    Though the breakout was obviously manufactured, neither the algos nor the FOMC will have any regrets.

    continued for members(more…)

  • Can it Possibly Not Matter?

    Futures are essentially flat the first trading day after the Treasury turned on the stimulus spigot again. They’ve now plugged a $3 trillion hole with a total of $5.3 trillion. Can it possibly not matter?

    continued for members(more…)

  • Charts I’m Watching: Mar 12, 2021

    ES has topped and backtested its latest falling channel overnight yet again.

    This time, however, SPX has actually tagged our upside target – an important Fibonacci extension that’s been on our radar since before the pandemic.With the algos poised to swing into action, today is shaping up as an important contest.

    continued for members(more…)

  • Catapulting the Propoganda

    When it comes to algorithms, two favorite quotes from two famous Georges come to mind:

    When Spanish philosopher Santayana wrote those words in 1905, he probably wasn’t thinking about algorithmic trading. Nevertheless, he captured the essence of what accounts for over 90% of trading volume today: (1) what has produced a particular result in the past? (2) let’s watch very closely to see if it happens again so we can properly position our portfolio.

    Fundamental analysts have always looked to such factors as changes in earnings, interest rates, and inflation to guide their investment forecasts and decisions.  Quants have taken that process and, well, quantified it. By studying correlations between interest rates and stock prices, for instance, one might logically implement an algorithm which places purchase orders whenever the Fed lowers the discount rate. Similar buy/sell decisions might be made based on economic data such as inflation, employment or housing starts.

    Such decisions are now made millions of times every day by investors all around the world. While they might differ in the design and execution of their algorithms (e.g. trend following, mean reversion, arbitrage, etc.) the majority would agree on the importance of such closely-followed macro factors as inflation, interest rates, flows, and volatility.

    But there are other, less well understood factors which play an important role in triggering buy/sell decisions. Two of my favorites are the price of oil and the USDJPY.  Oil prices are very highly correlated with stock prices, as the chart below illustrates.

    The USDJPY, the chief factor in the yen carry trade, is just as powerful and has played an important role in many rallies and corrections over the years.  Perhaps the most notable example was in the wake of the Fukushima disaster 10 years ago today.  The rising USDJPY (falling yen) was instrumental in preventing a much worse downturn and facilitating the subsequent rally.

    Like oil prices, however, the USDJPY has its limitations. After Fukushima, for example, Japan shut down its nuclear reactors, which had previously provided 29% of its power needs. Dependency on fossil fuels spiked from 62% to 88%.

    Since oil is priced in US dollars, the plunging yen amplified the cost of energy. Oil priced in yen, for instance, rose nearly 50% by mid-2014…

    …causing inflation to spike to nearly 4%.  Needless to say, this was problematic for the BoJ, which was relying on zero or negative interest rates in order to cope with debt which had already soared past 200% of GDP.

    The problem was how to reduce oil prices without also crashing the stock market. The solution was elegant, really: a breakout in USDJPY which “conveniently” began the very day oil prices broke down.

    The bearish effect of falling oil prices was more than offset by the bullish effect of the rising USDJPY.  The S&P 500 even rose nearly 12% in the process. The maneuver carried the side benefits of: (a) punishing OPEC and Russia, both off which had been misbehaving at the time, and (b) prompting US CPI and interest rates to also break down.Even long-time readers might be wondering by now, “why the history lesson?”  For the answer, we turn again to our friend George W. Bush. He was referring to Social Security when he spoke of “catapulting the propaganda,” but he may as well have been talking about the stock market.

    The economic narratives have shifted significantly since the GFC. Remember when “bad news”  — which in the old days was just, well, bad — became “good news?” The notion was that the Fed would be more likely to step in and save the market (they did) if economic data disappointed (it did.)  “Buy the f’ing dip!” evolved from a humorous quip to a bona fide investment strategy.

    Similarly, the notion that “falling oil prices indicate contracting economic conditions” evolved to one of “falling oil prices will encourage the Fed to increase QE and lower interest rates, thereby supporting stocks.”

    It wasn’t all that simple to convince carbon-based investors, especially those who had been trained in classical economics or had a decade or two of trading experience under their belts. The algos, however, gobbled this stuff up. It was easy to understand, easy to detect, and easy to program.

    The only complication was the old-timers who insisted there was such a thing as too much debt and too high interest rates. But, like Dubya said, sometimes you just have to repeat things over and over for the “truth” to sink in.

    Jerome Powell and his colleagues at the Fed know full well that the US is heading for a spike in inflation.  We figured it out and started posting about it last summer. Trust me, the MIT grads at the Fed can run laps around me from both an intellectual and technological standpoint. They had this stuff programmed a year ago while yours truly was still squinting and

    The only thing they haven’t figured out for sure is how the rest of us will respond.

    continued for members(more…)

  • Lies, Damn Lies and Statistics

    Every economist is familiar with the Mark Twain quote: “There are three kinds of lies: lies, damn lies, and statistics.”  Unemployment, money supply, GDP – they’re all massaged and redefined on a regular basis to maintain a more positive narrative – to “catapult the propaganda” as George W. Bush used to say.

    This morning’s big lie was all about inflation – the measure of the increase in prices which affects everything from cost of living increases to interest rates.  It took all of 10 seconds to spot the lie regarding February CPI.

    Gasoline prices did not rise 1.5% over the past 12 months. AAA shows a 19% YoY increase.Gas Buddy reports a 10% YoY increase. Even the government’s own EIA data show a 2.7% increase.

    Why roll out an artificially low number? The sharp rise in oil/gas prices since last Spring, while very beneficial to stocks, will send CPI soaring starting next month.


    Enough analysts have already done the math on this problem that interest rates have almost doubled in the past month. Given the enormous amount of debt on government and corporate books, this has the equity markets and the bond market on edge.


    Easily distracted as always, the algos are naturally much more focused on the “breakdown” in VIX.

    Programmed to be blissfully ignorant of the kicked can, they have enabled yet another breakout in futures. After all, could higher inflation and interest rates really be a problem if equities are still rallying?continued for members(more…)

  • Update on Gold: Mar 9, 2021

    Gold reached our primary downside target yesterday. As I posted at the time, this is incredibly important support for GC.continued for members(more…)

  • Playing With Fire

    Does the Fed really know what they’re doing, or have they simply come to the conclusion that there’s no other choice but to let interest rates continue to soar?Futures liked David Tepper’s assessment that higher rates are a good thing, as they will convince foreign buyers such as the BoJ to load up on US Treasuries.  Maybe. All I know is that past accelerations in the 2s10s have never been positive for stocks.

    continued for members… (more…)