

Gold reached our primary downside target yesterday. As I posted at the time, this is incredibly important support for GC. continued for members…We should get a bounce here which, if it fails, could usher in much more downside. We’ll look at the big picture and next steps for gold and touch on silver as well.
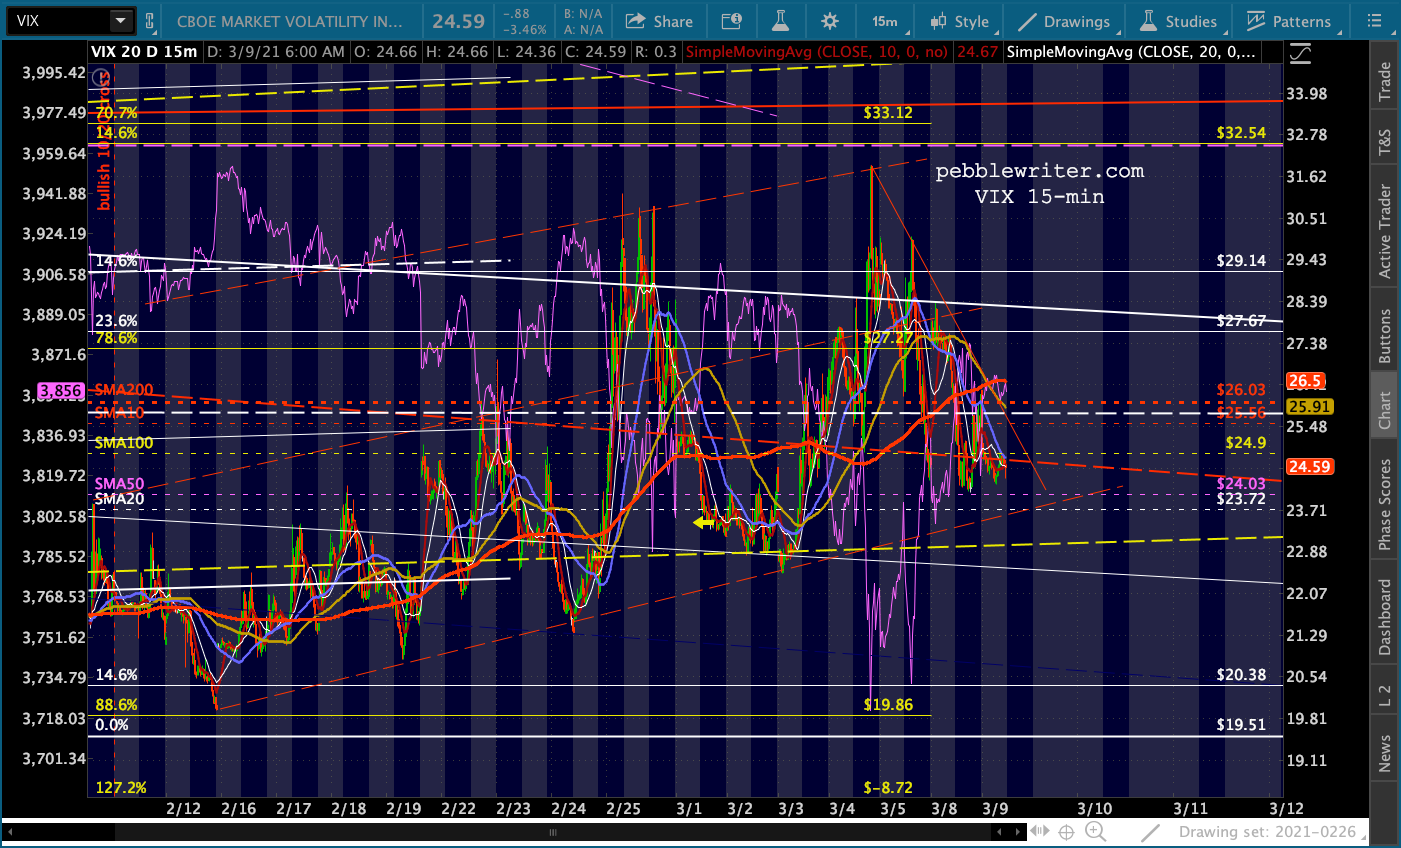
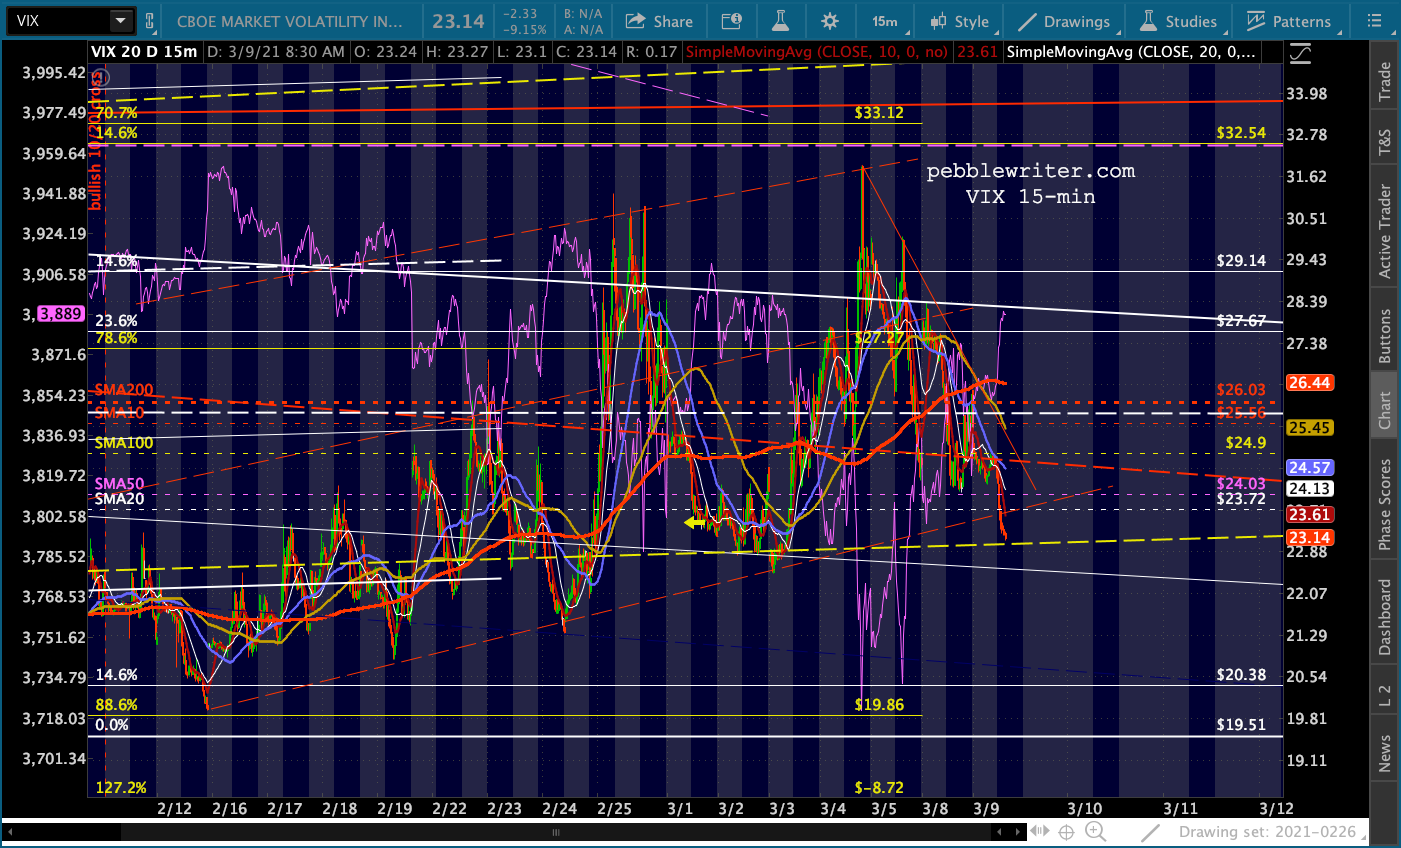
But first, a quick overview of our usual daily charts. As yesterday, VIX continues to do most of the heavy lifting for the latest ramp job. It set up a potential breakdown, though it’s still in a bullish 10/20 cross.
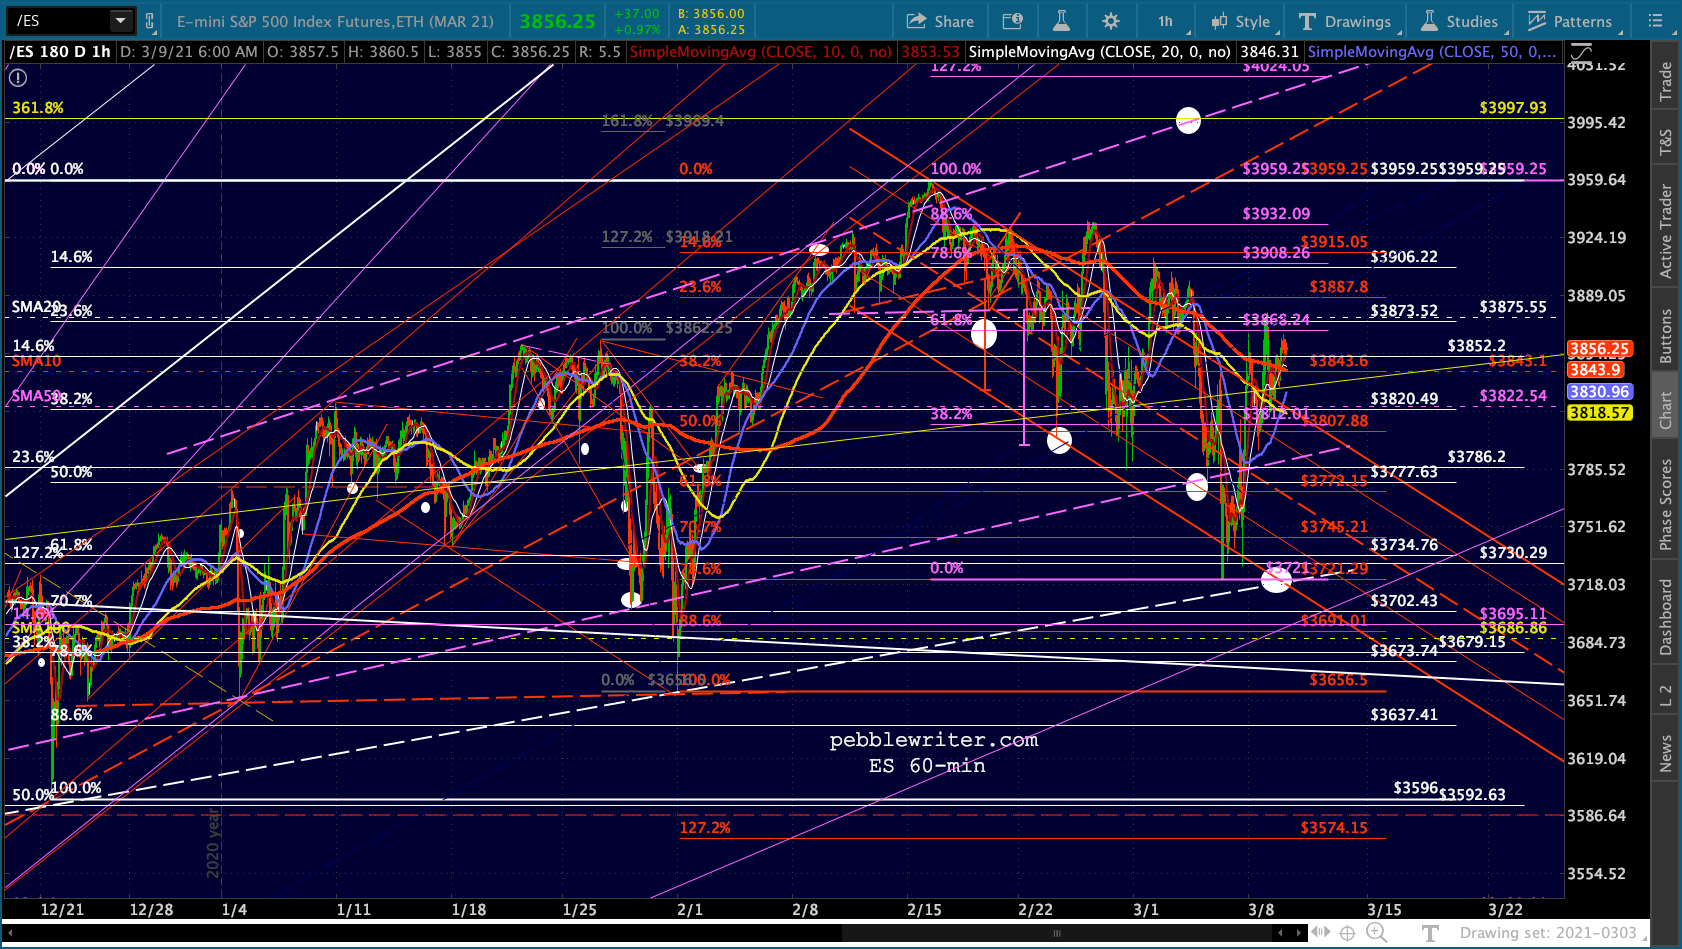
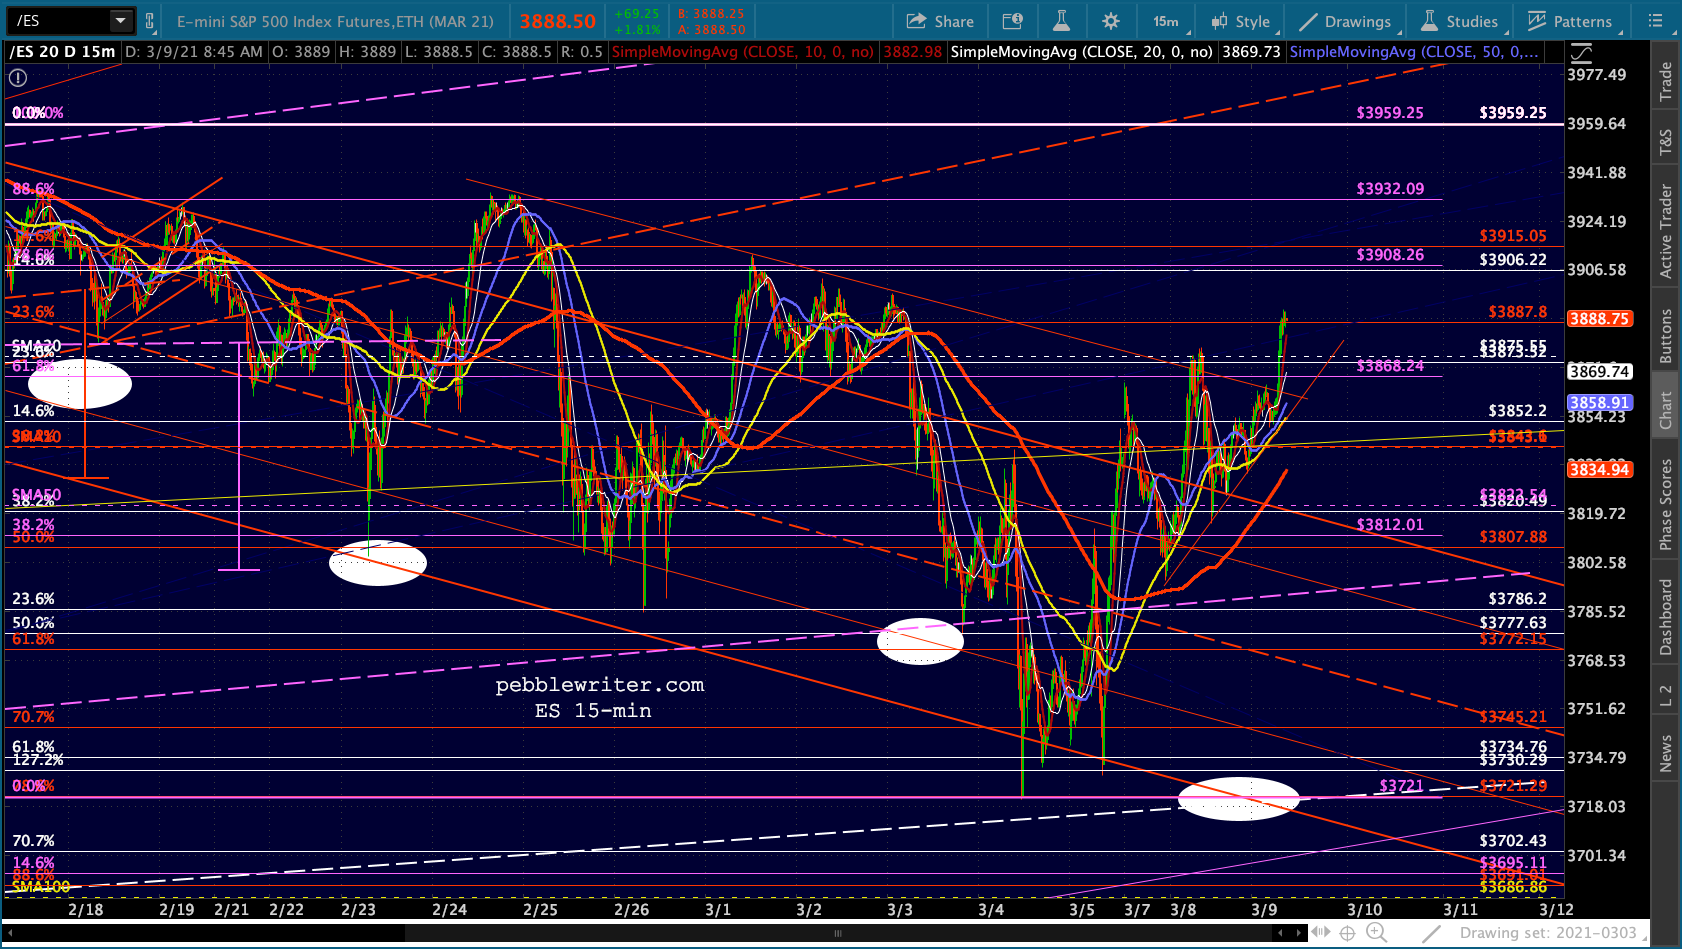
 ES, still in a bearish 10/20 cross, has formed a bit of a triangle. It has an opportunity to break out above the thin red TL or, alternatively, break down.
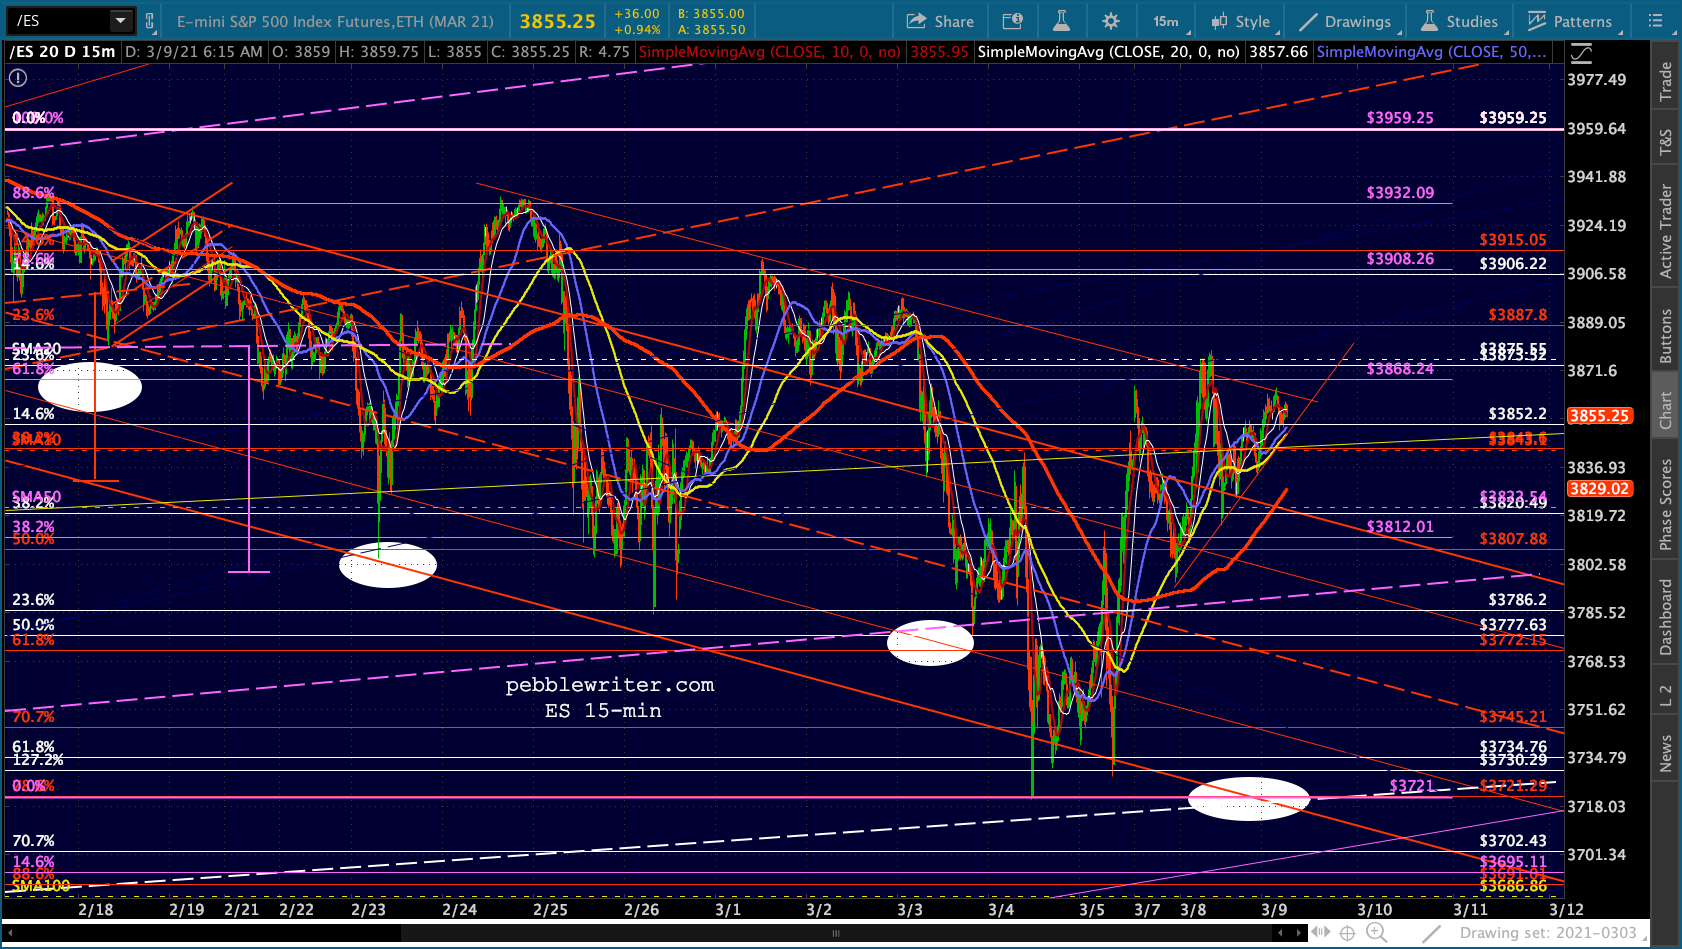
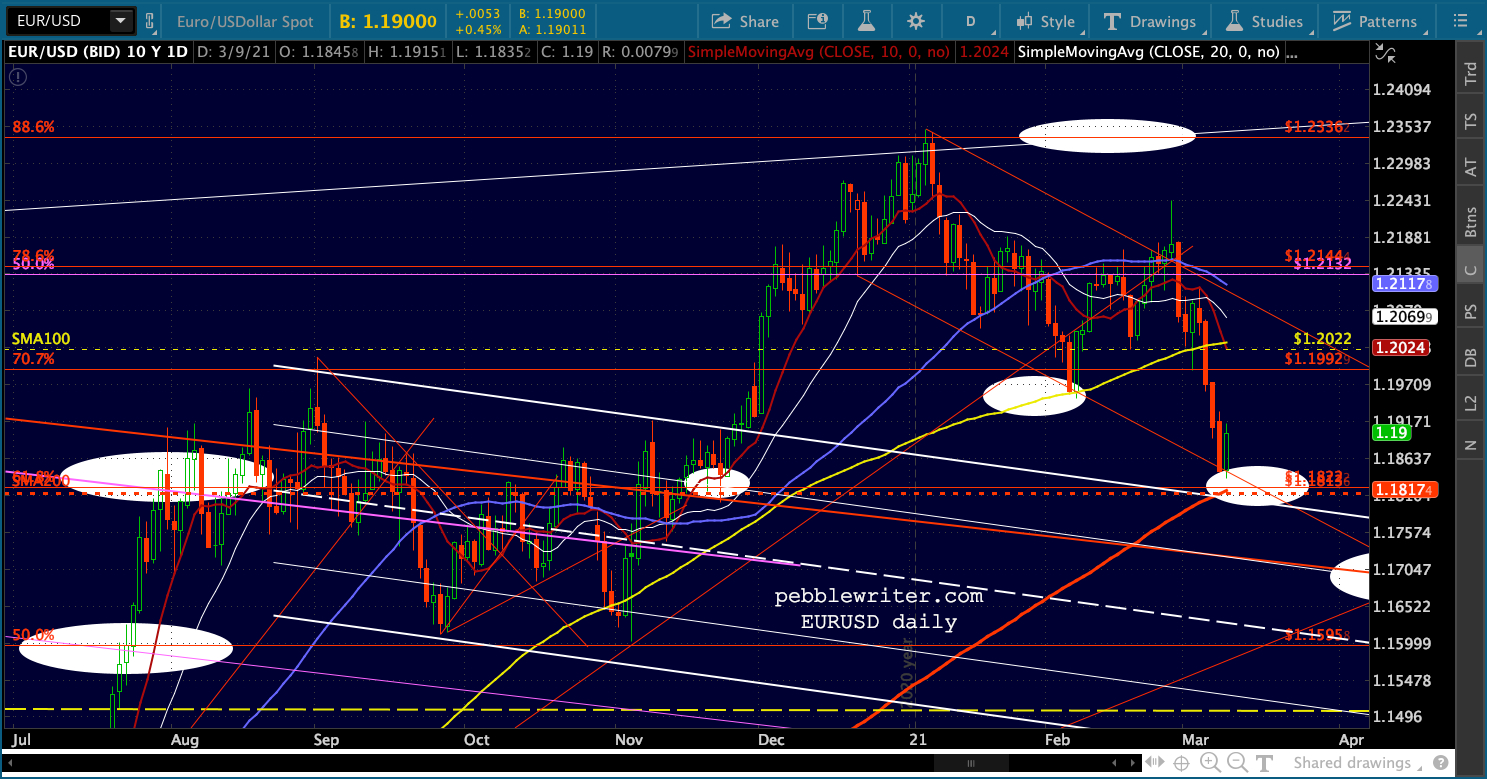
 Currencies are also making some moves today, though EURUSD is bouncing slightly early. Note it hasn’t quite reached its SMA200.
 USDJPY is taking a pause here at the purple .886 / white .707.
 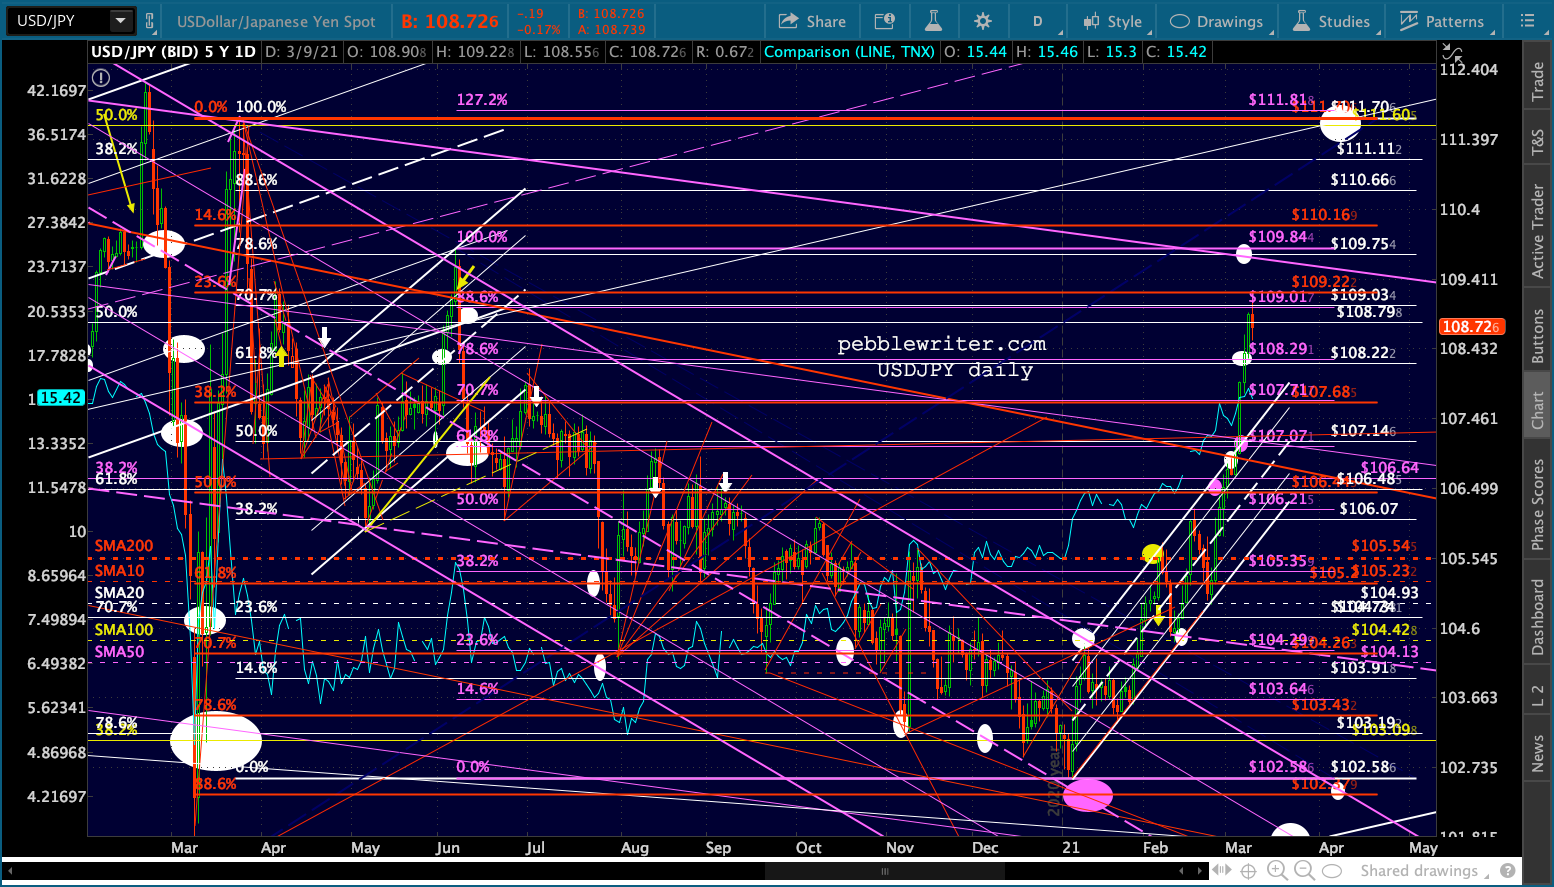 Between the two of them, this is allowing DXY to backtest the broken white channel.
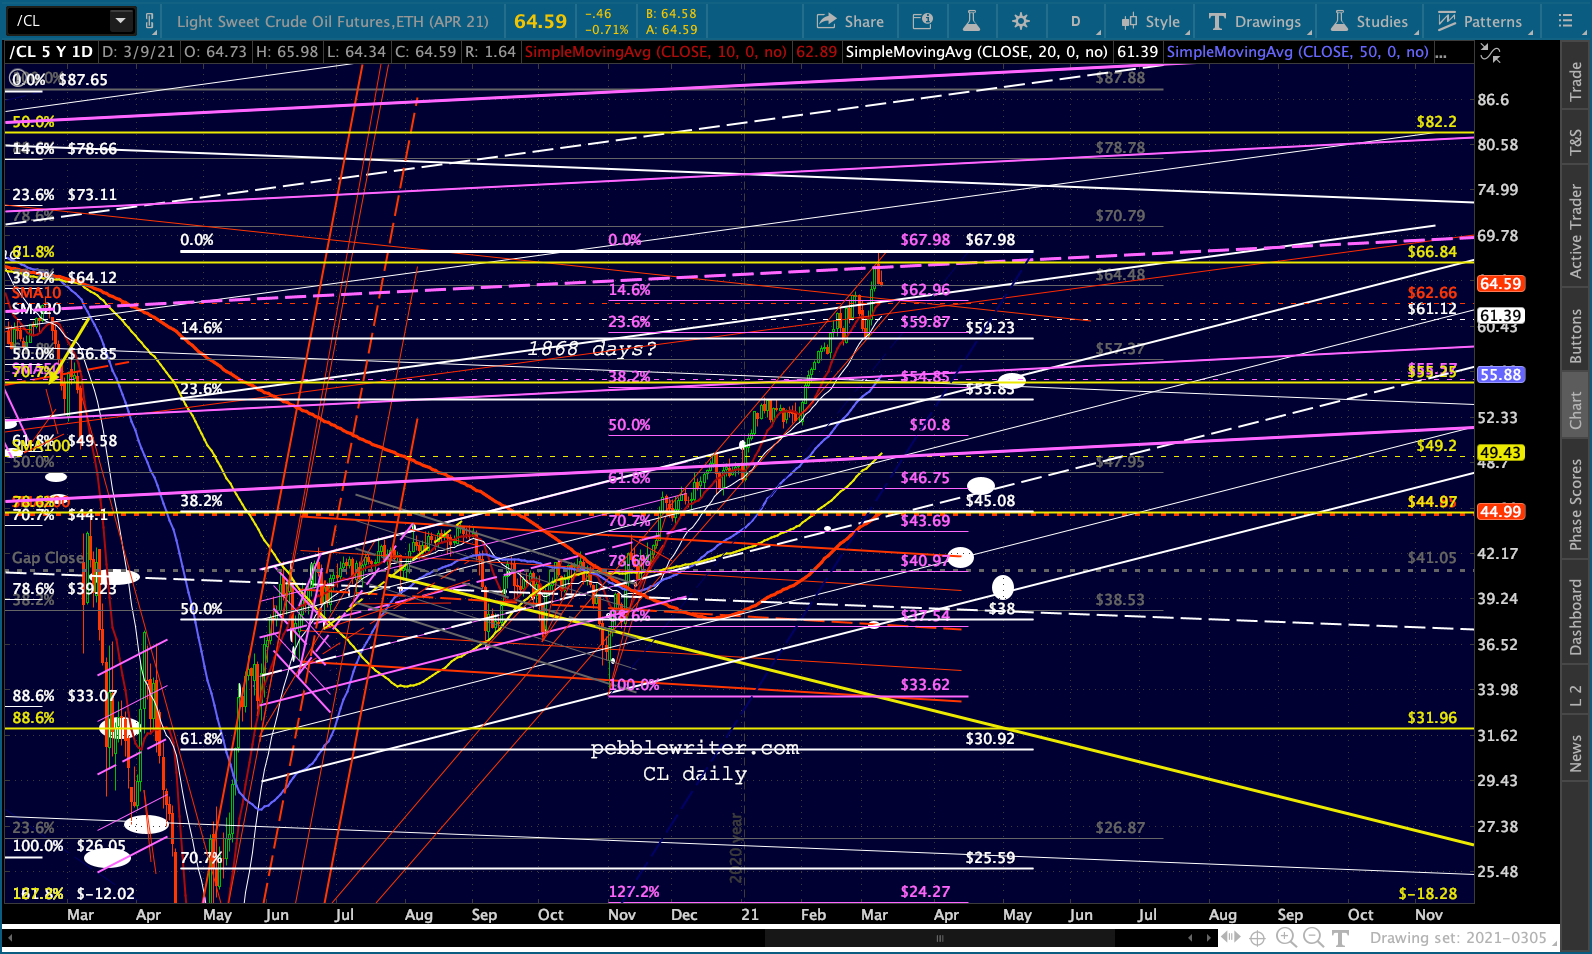
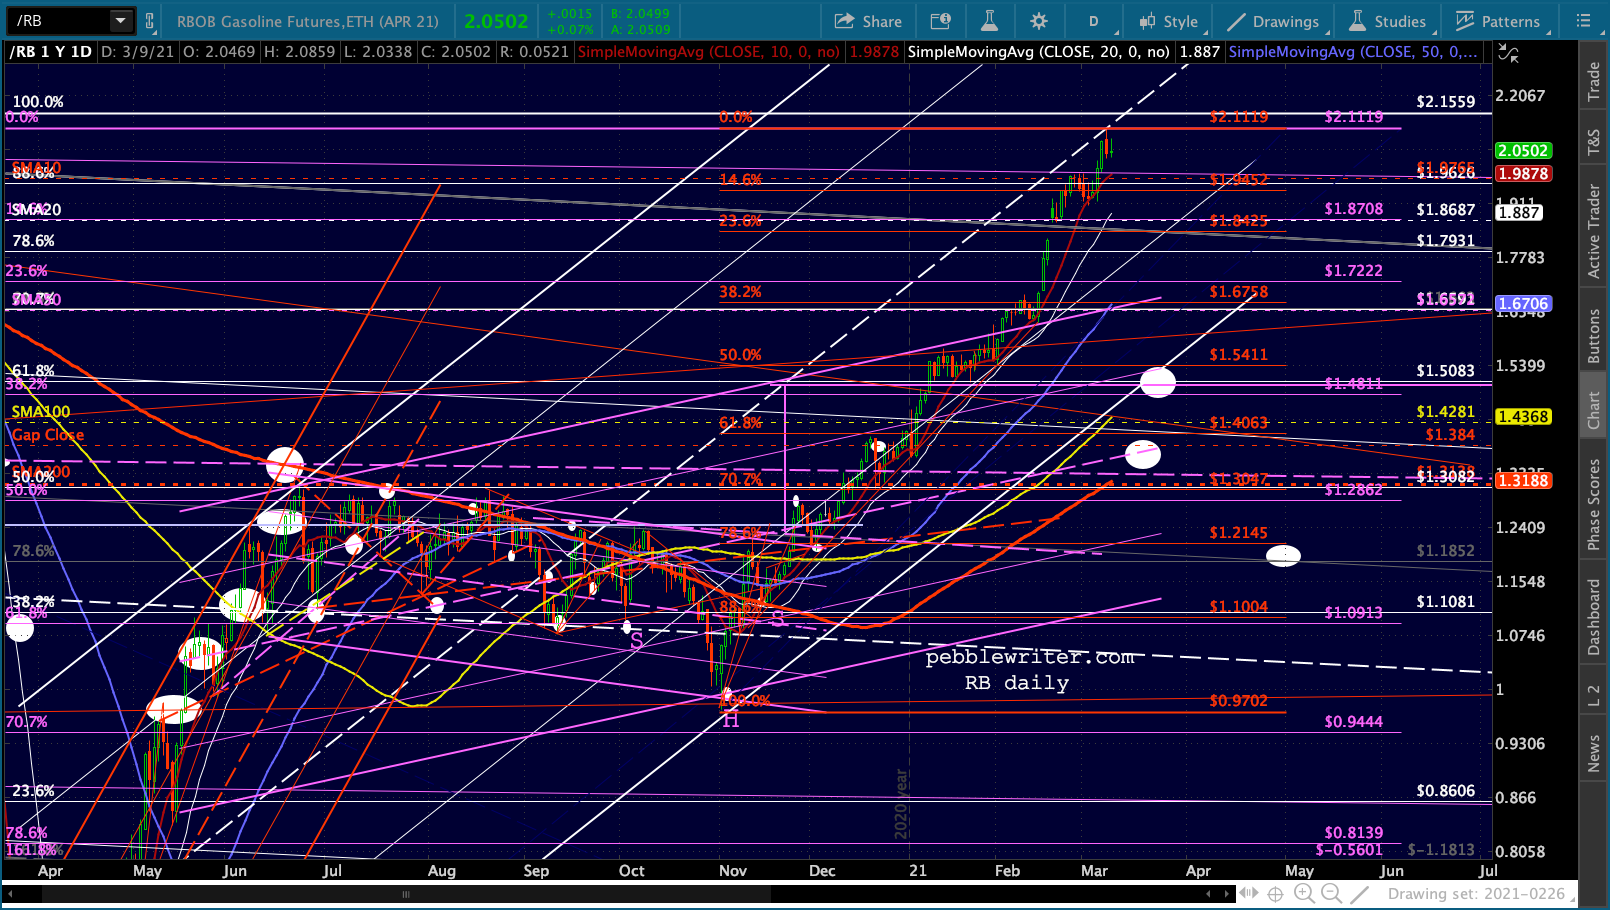
 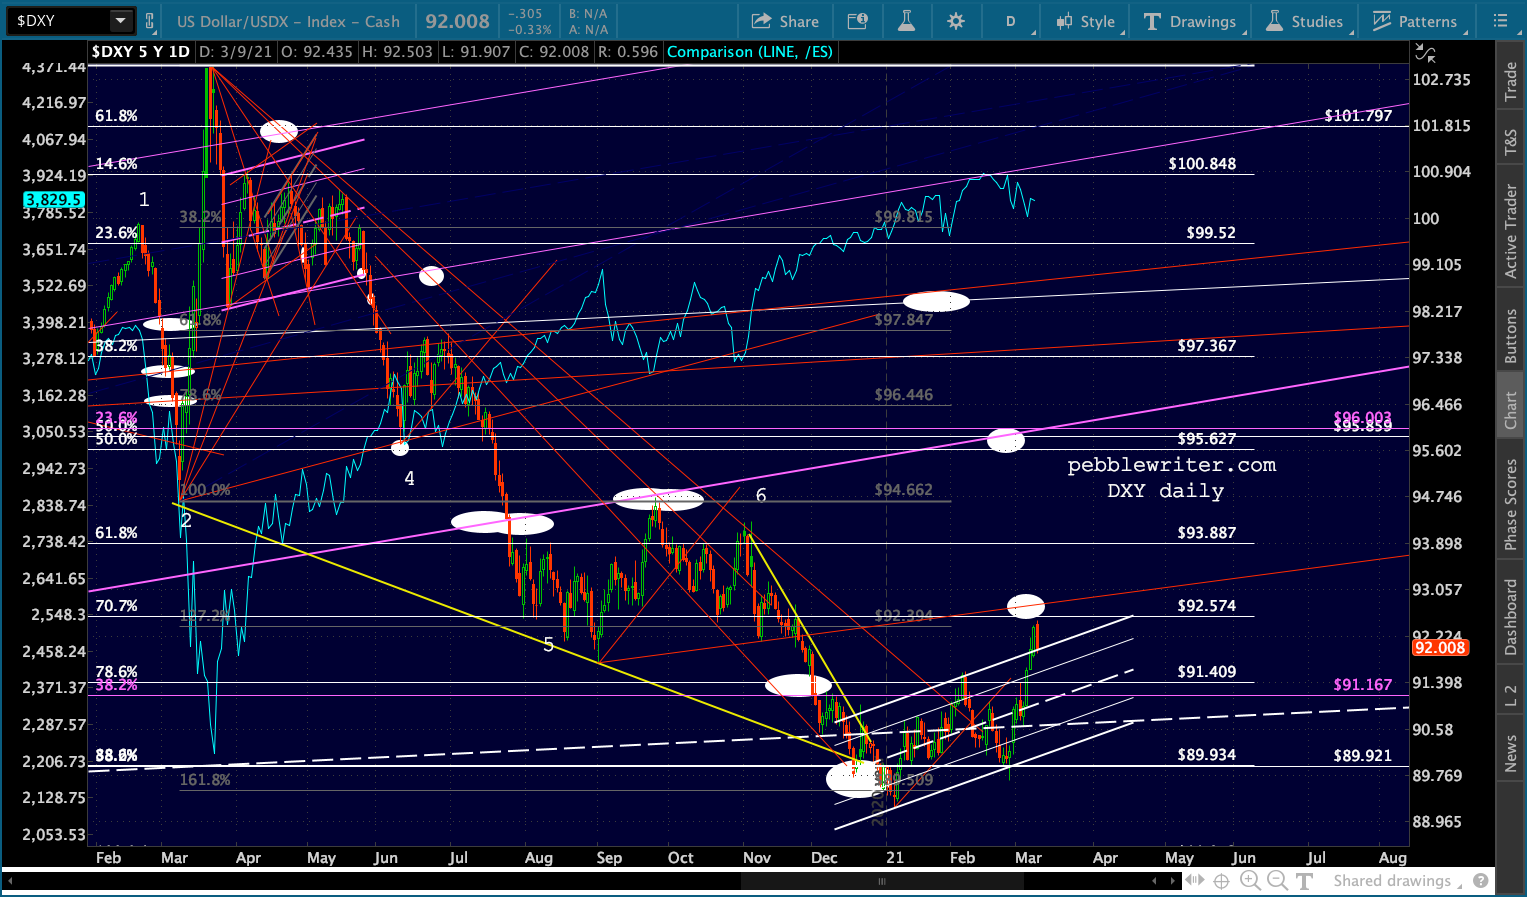 CL and RB are off modestly.
 Now, on to gold.
First the big picture… The rising white channel goes back to the turn of the century. Literally. GC broke out of it in 2011, but broke back in in a big way. Eventually, it even broke down while following the falling red channel – which morphed into the falling purple channel. Everything was very orderly and not that challenging to chart.
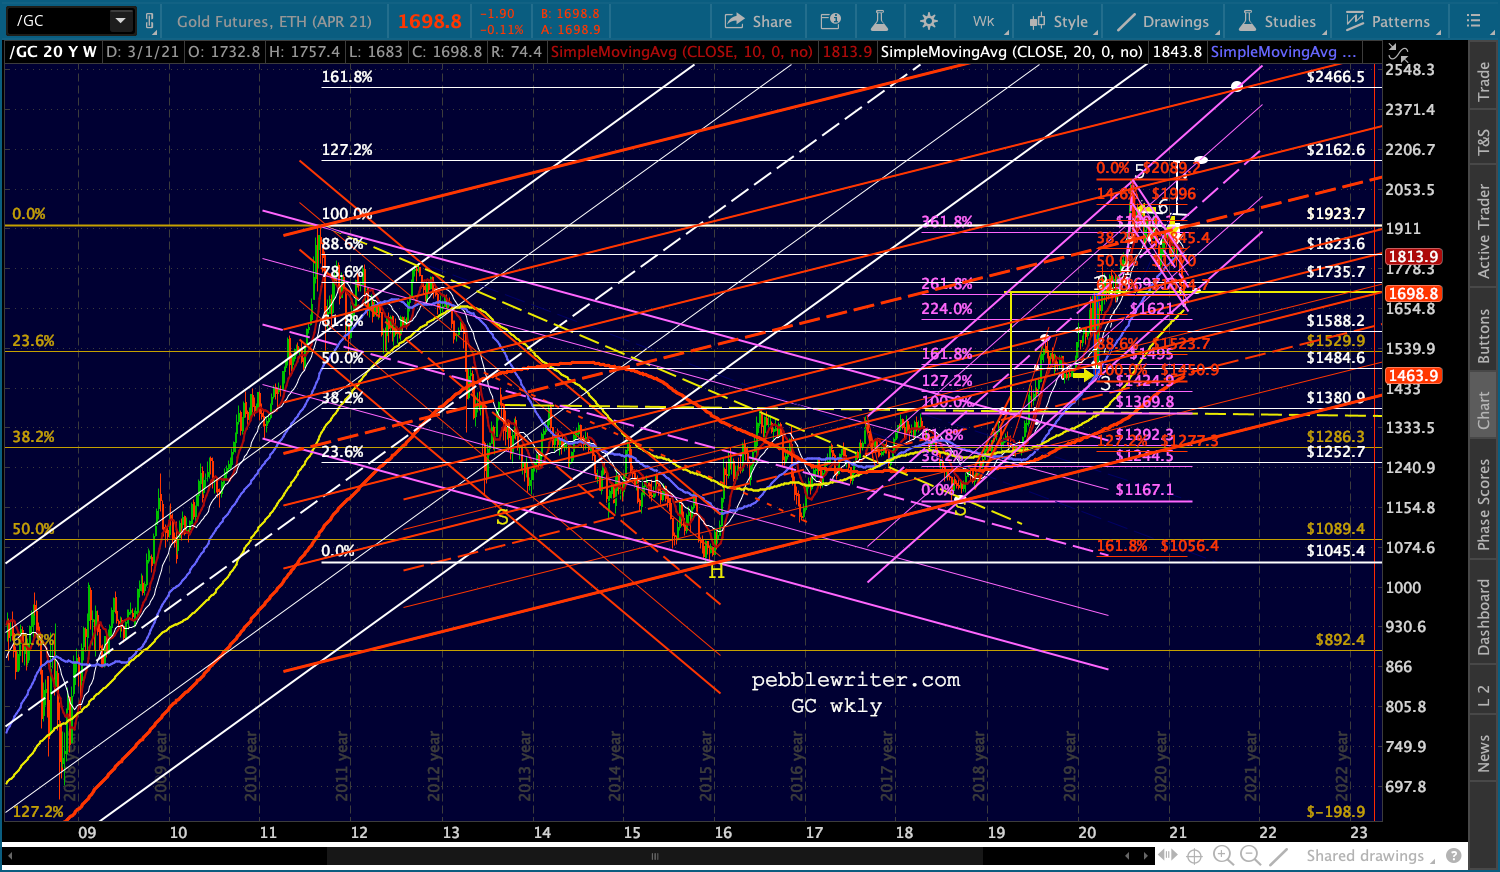 In 2016, it appeared we were going to get a backtest of the broken white channel. But, GC reversed at 1380ish. It was the third time it had tested that level (so far. ) In the end, GC tested it several more times before finally breaking out in June 2019.
At that point, it gradually made its way up to the IH&S target at 1700ish, backtesting the SMA200 and establishing a rising purple channel along the way. Note that the rising purple channel is parallel to the rising white channel, lending it some legitimacy.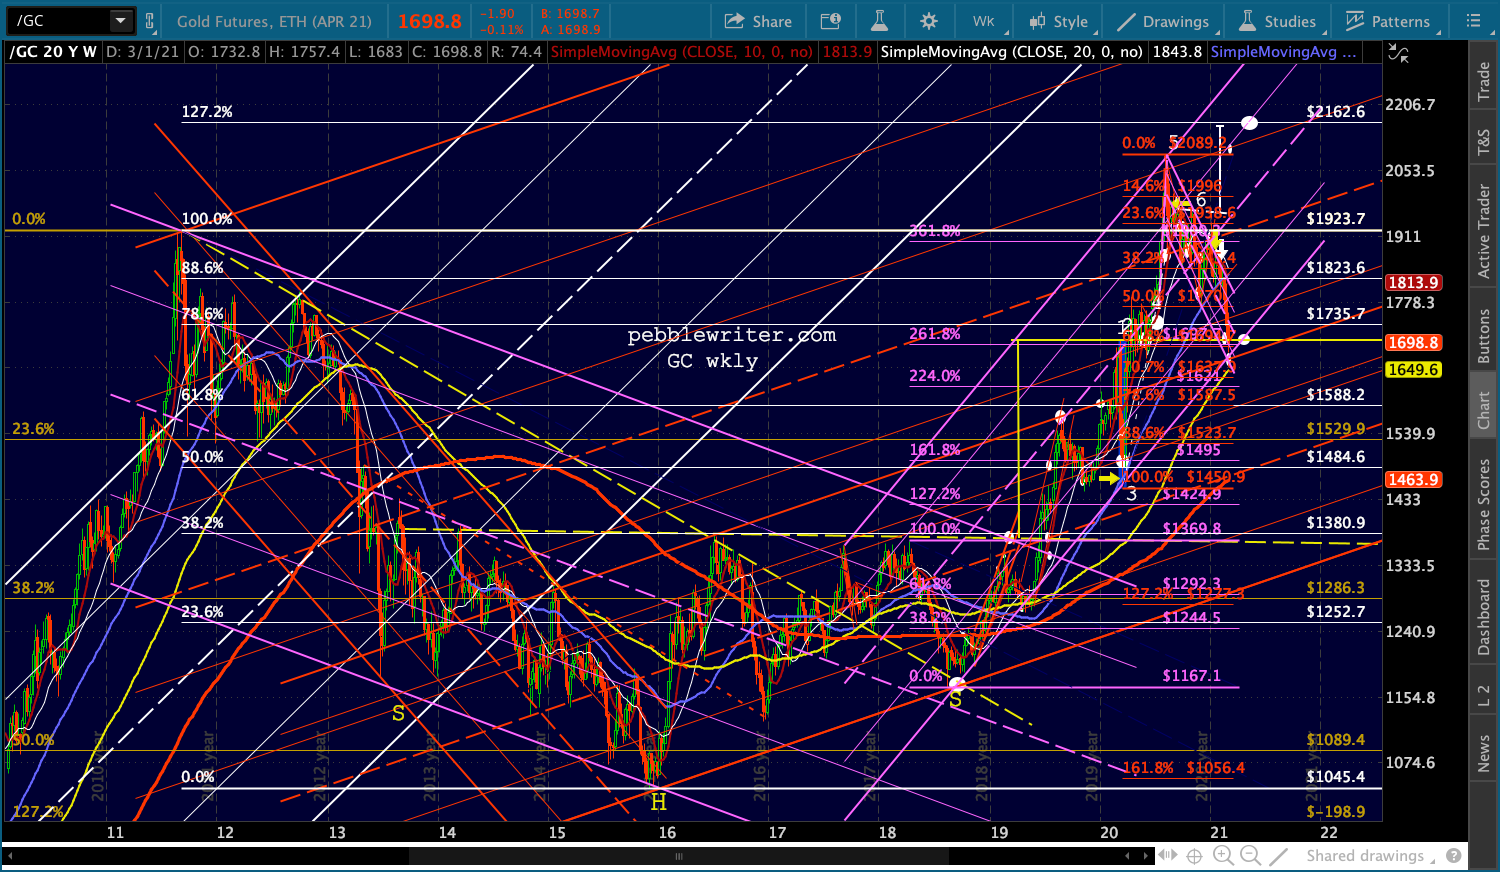 It is this purple channel bottom that GC just backtested again. It’s also the bottom of the falling purple channel from the July 2020 highs. Note that GC “thought about” breaking out of this falling purple channel around Jan 4, establishing 2/3 of a small IH&S that targeted the 1.272 at 2162.60. It would have made perfect sense, but didn’t play out.
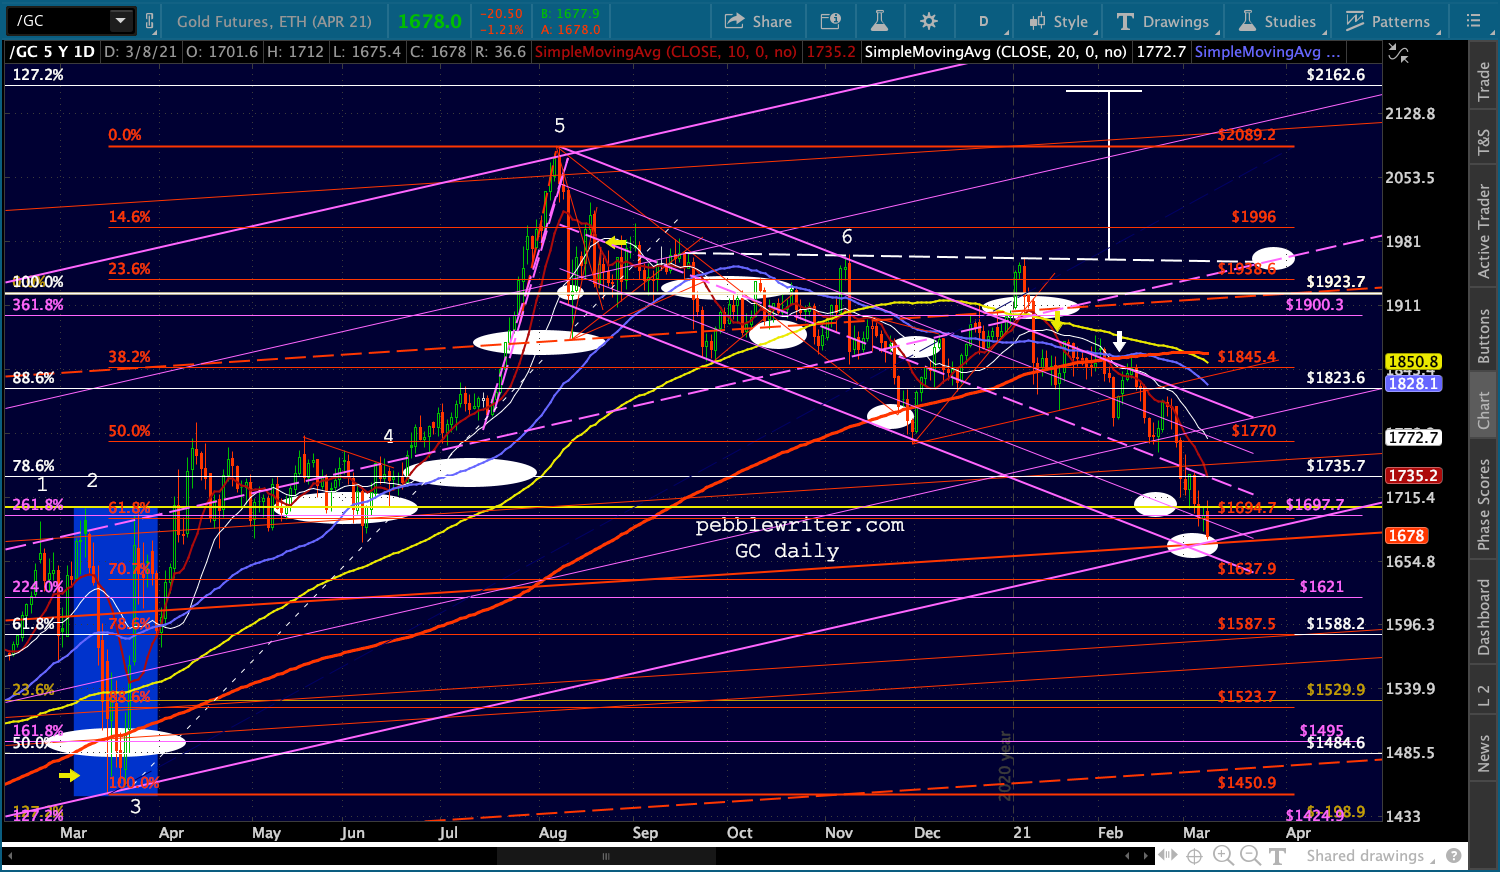 If this channel should break down, GC could easily find itself down at one of several downside targets such as the white .618 at 1588 or even the former IH&S neckline at 1380. But, let’s cross that bridge if the purple channel breaks down.
 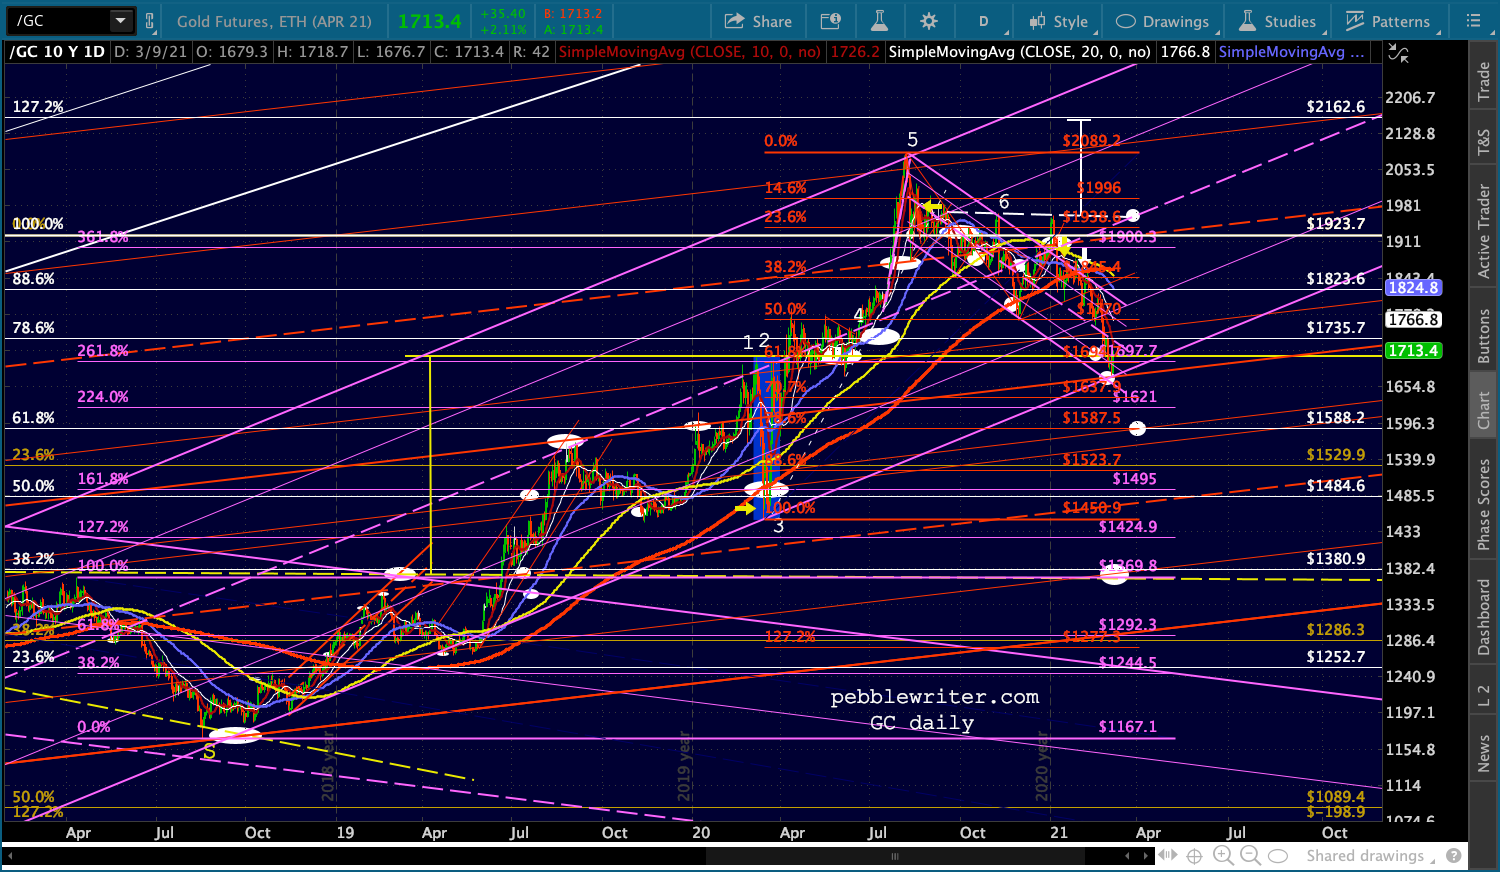 As we’ve noted many times, the 10Y note futures have been an excellent guide for the price of gold. It has tested a very important channel midline, lately, with equities having a fit every time it threatens to break down.
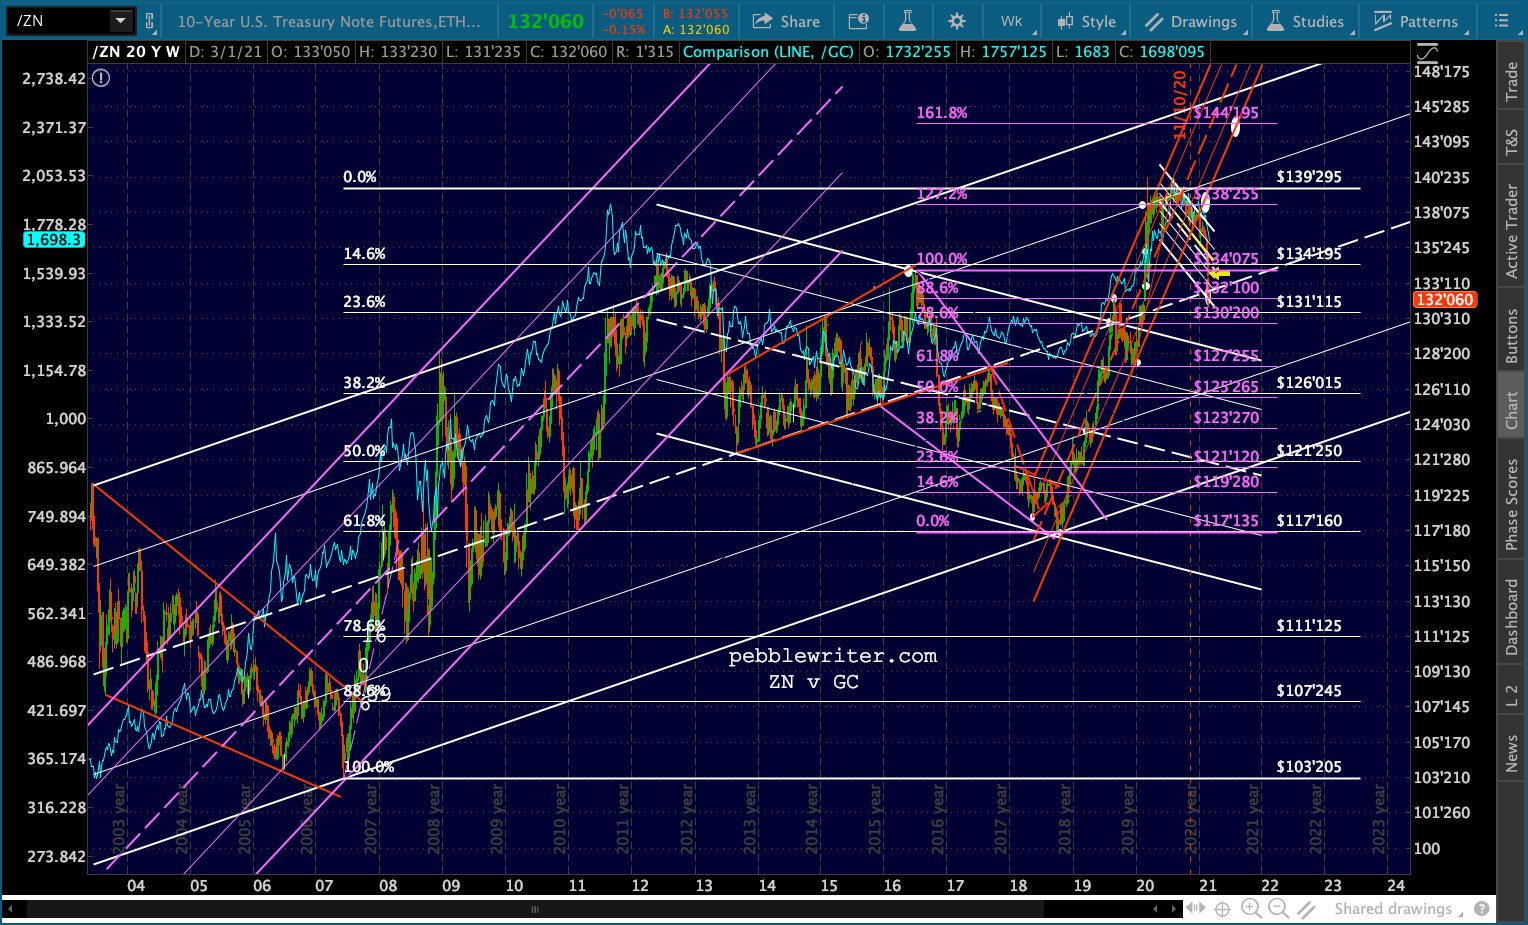
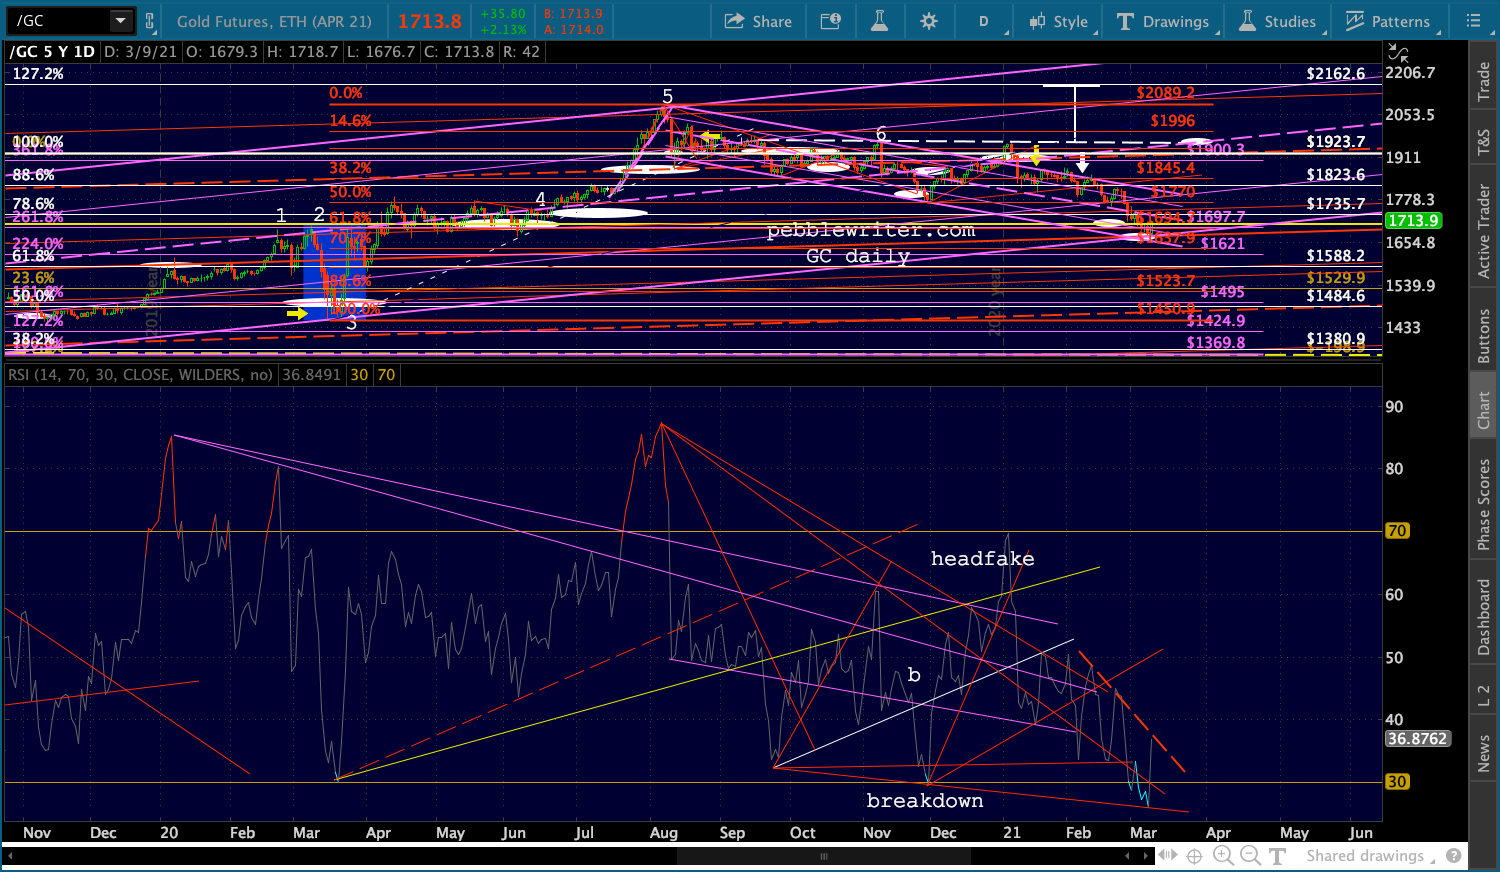
This offers some support for the idea that GC’s purple channel bottom will hold.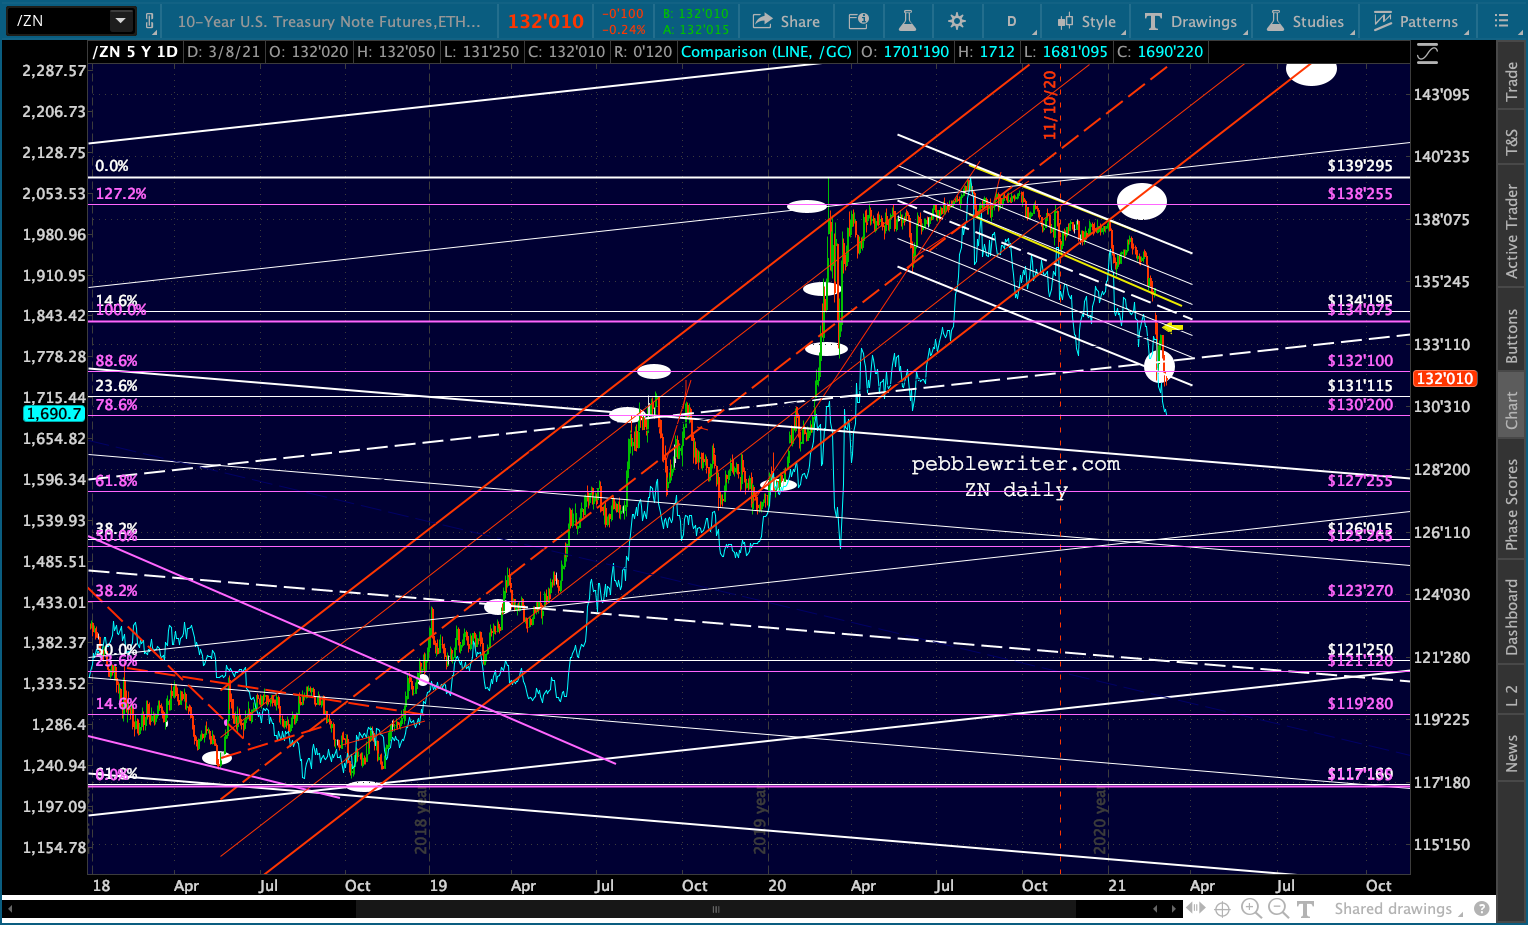 So does its RSI chart, which held a TL at its bottom and is testing another TL (dashed red) from early February.
 If the purple channel holds, which it seems likely to do at this point, then our upside targets are pretty clear: the falling purple channel top currently around 1793, the SMA200 currently at 1860, the white neckline around 1961, and finally, the 1.272 at 2161.60.
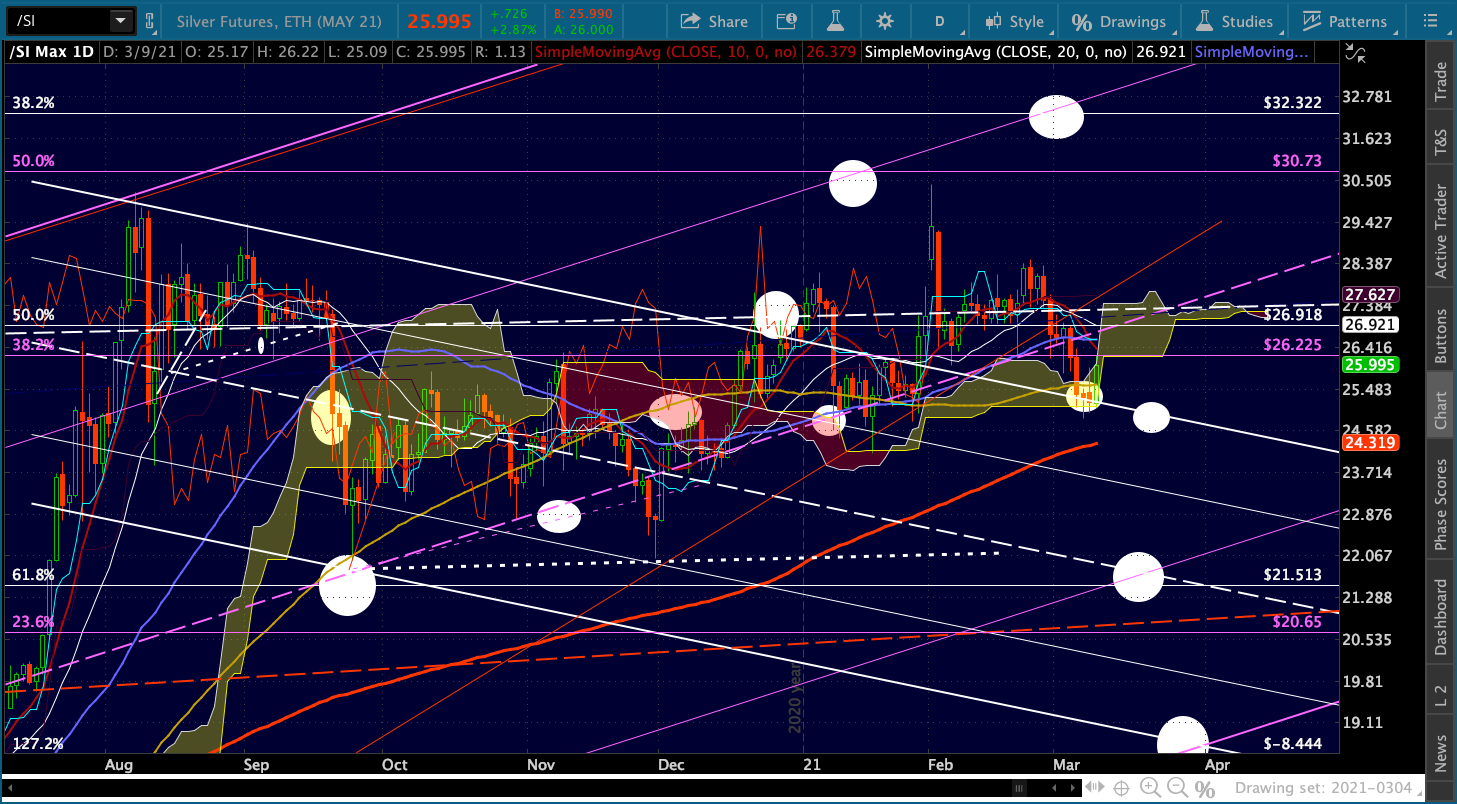
From a charting standpoint, silver is a somewhat different beast from gold. It also established a falling channel after reaching new highs last August. But, it broke out of that channel around New Years, fell back into it, then broke out again at the end of January and made a higher high before falling back to backtest the channel and its SMA100. 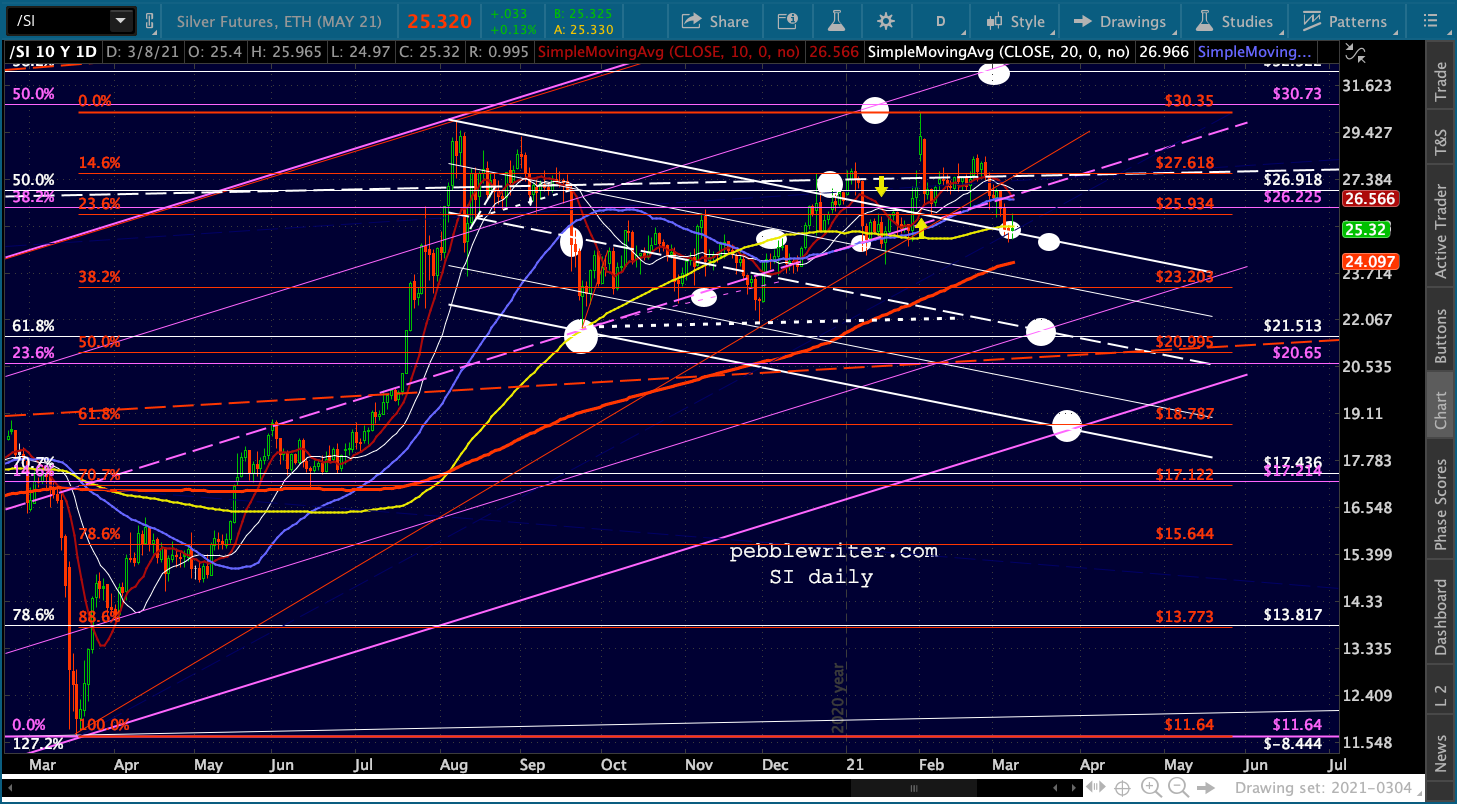 Since conducting that backtest, it has gone absolutely nowhere – leading me to believe it’s waiting for its SMA200 to come along and break out of the falling white channel (what’s left of it.)
Silver’s longer term charts are even more different from gold’s than its short-term charts. It’s essentially a huge megaphone pattern that broke down (Sep 2014), backtested the breakdown (Jun 2016), and broke down again (Jun 2018) before finally bottoming out about a year ago.
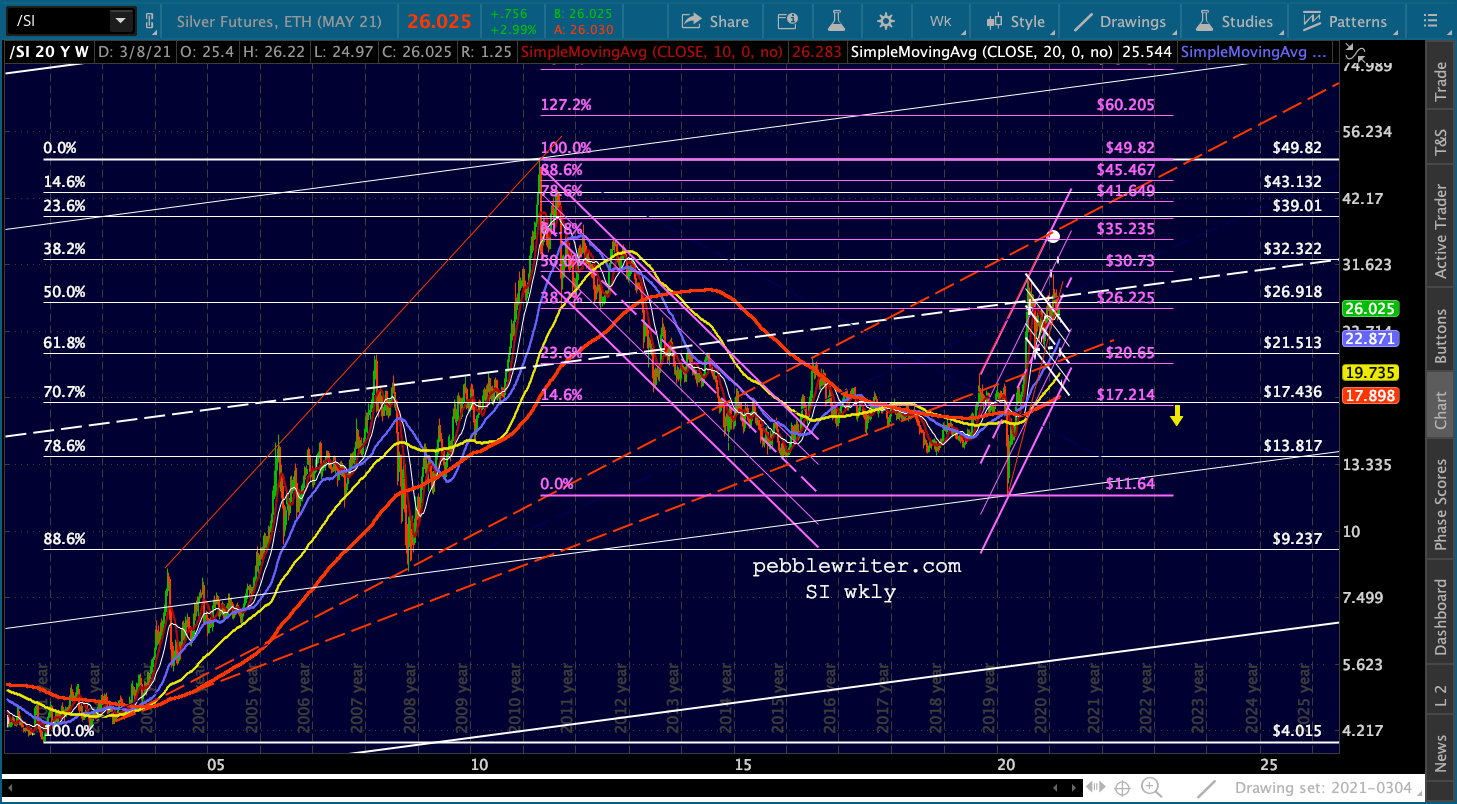 The bottom in Jan 2020 didn’t fit with any of the Fib patterns, but it did a nice job of confirming the gently rising huge white channel seen below on the monthly chart.
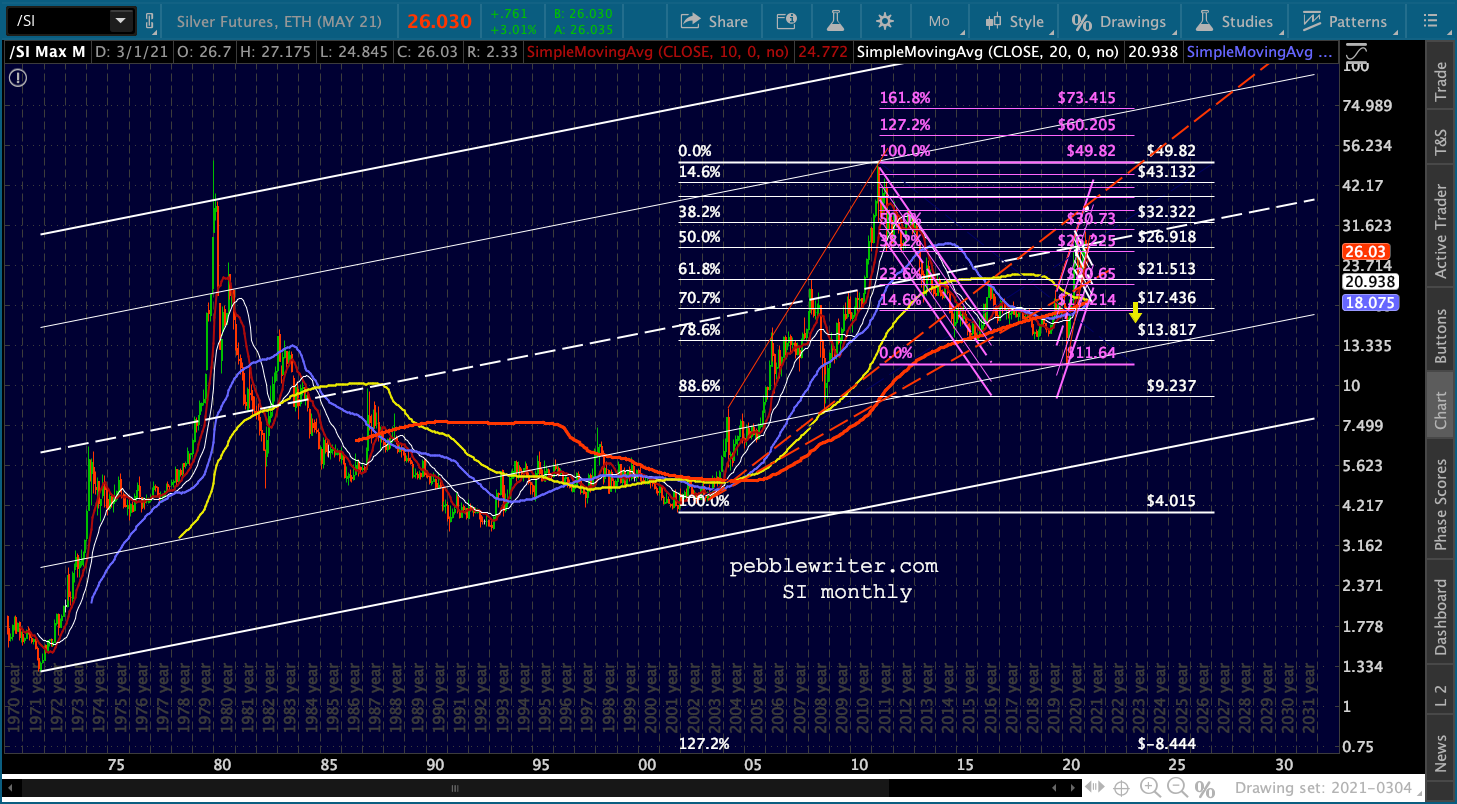 The other notable chart features are the dashed red fan lines off the 2001 4.015 lows. The upper one provided the Oct 2008 low and Jul 2016 backtest high. When SI backtested the white channel .236 line and broke above the midline and lower red fan line in 2020, it seemed likely that it would take a run at the upper red fan line again.
The logical point would have been this past December, when it could have backtested the upper fan line, the purple .618, and the top of the rising purple channel all at the same time at around 35.24.
SI missed its chance in Dec 2020 and again in Feb 2021.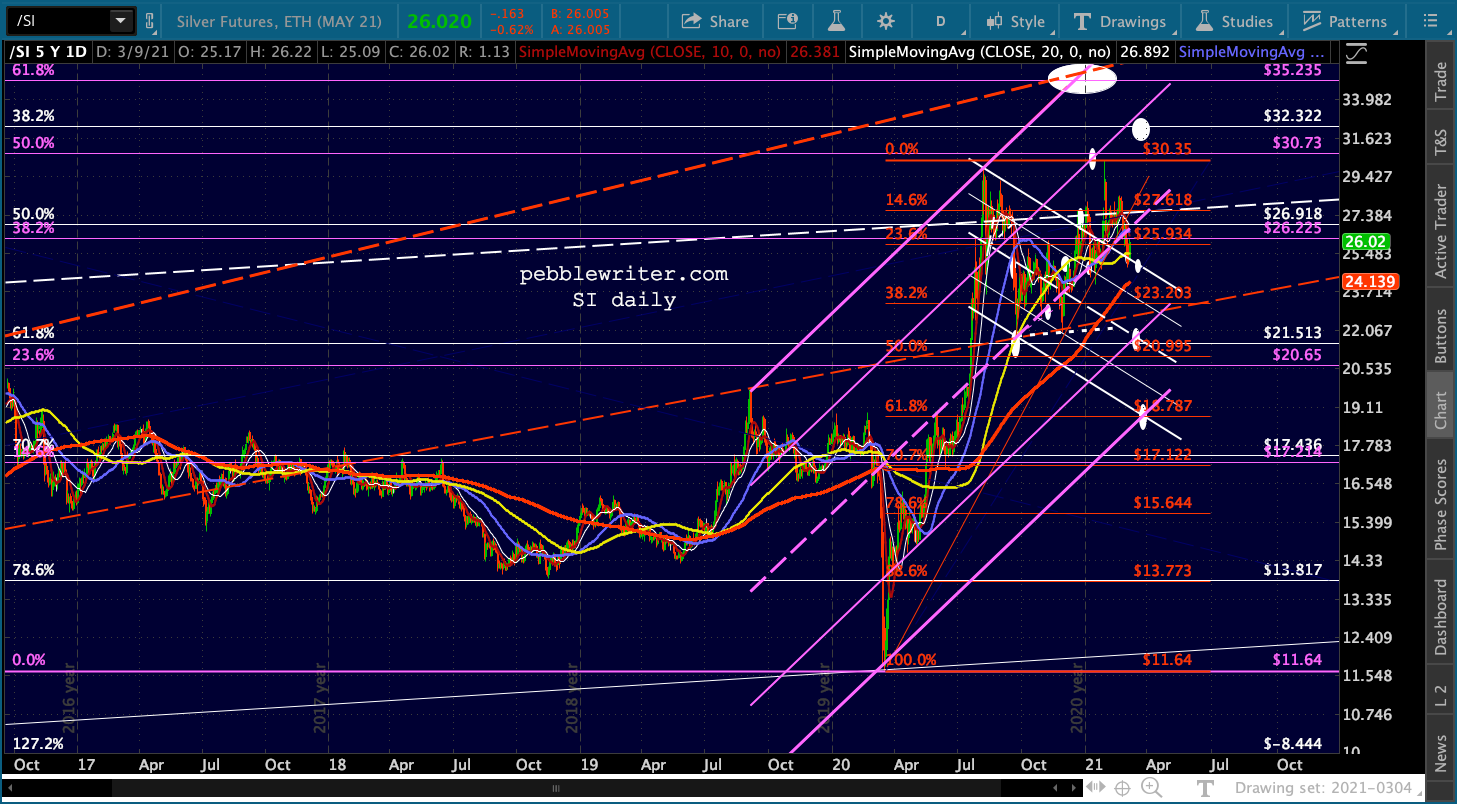 In the process, it has dropped back into its cloud, raising the risk of a breakdown.
 Its RSI broke below a TL from the Mar 20 lows…
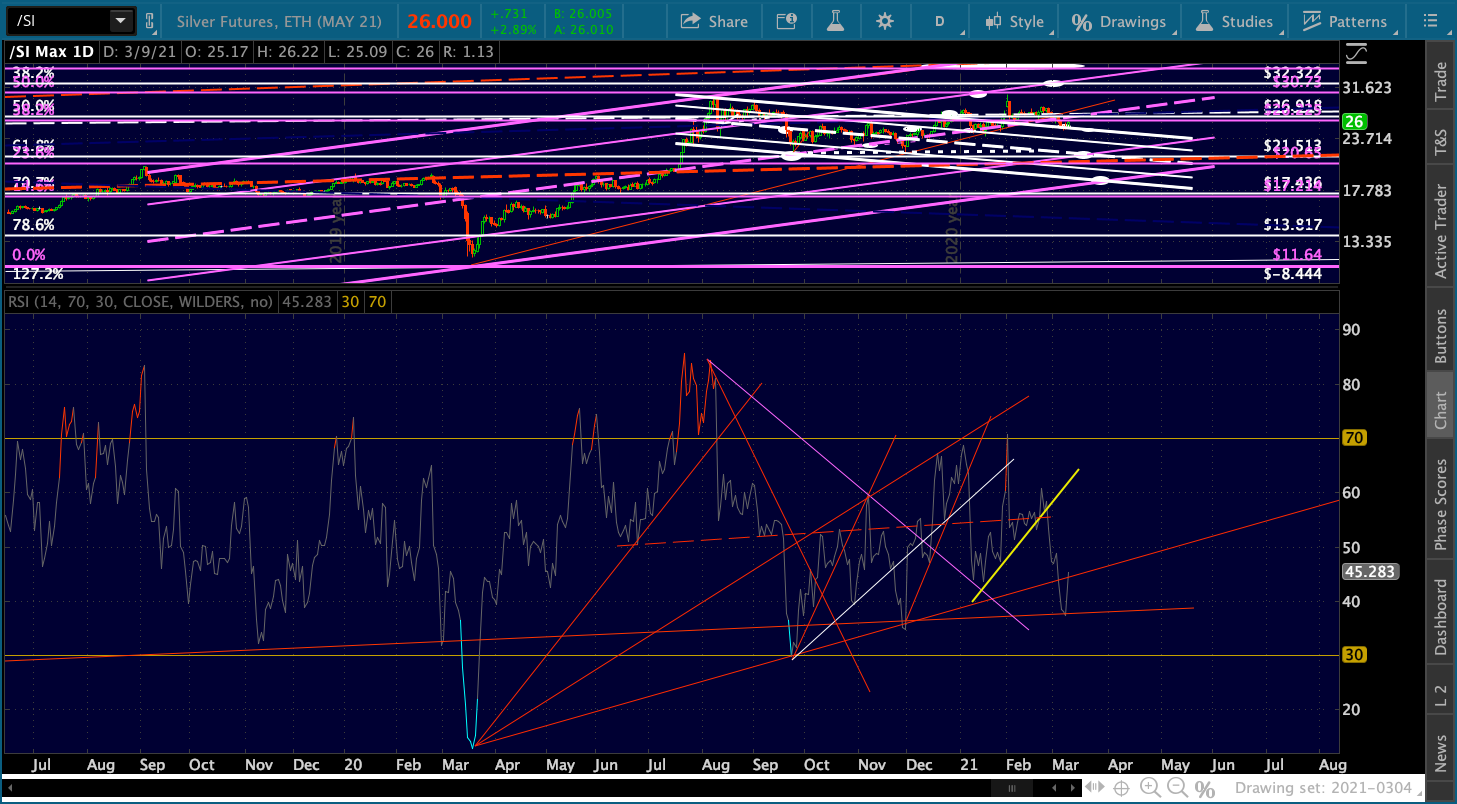 …but managed to hold another TL dating back to 2017. So, like GC, it’s at important support.
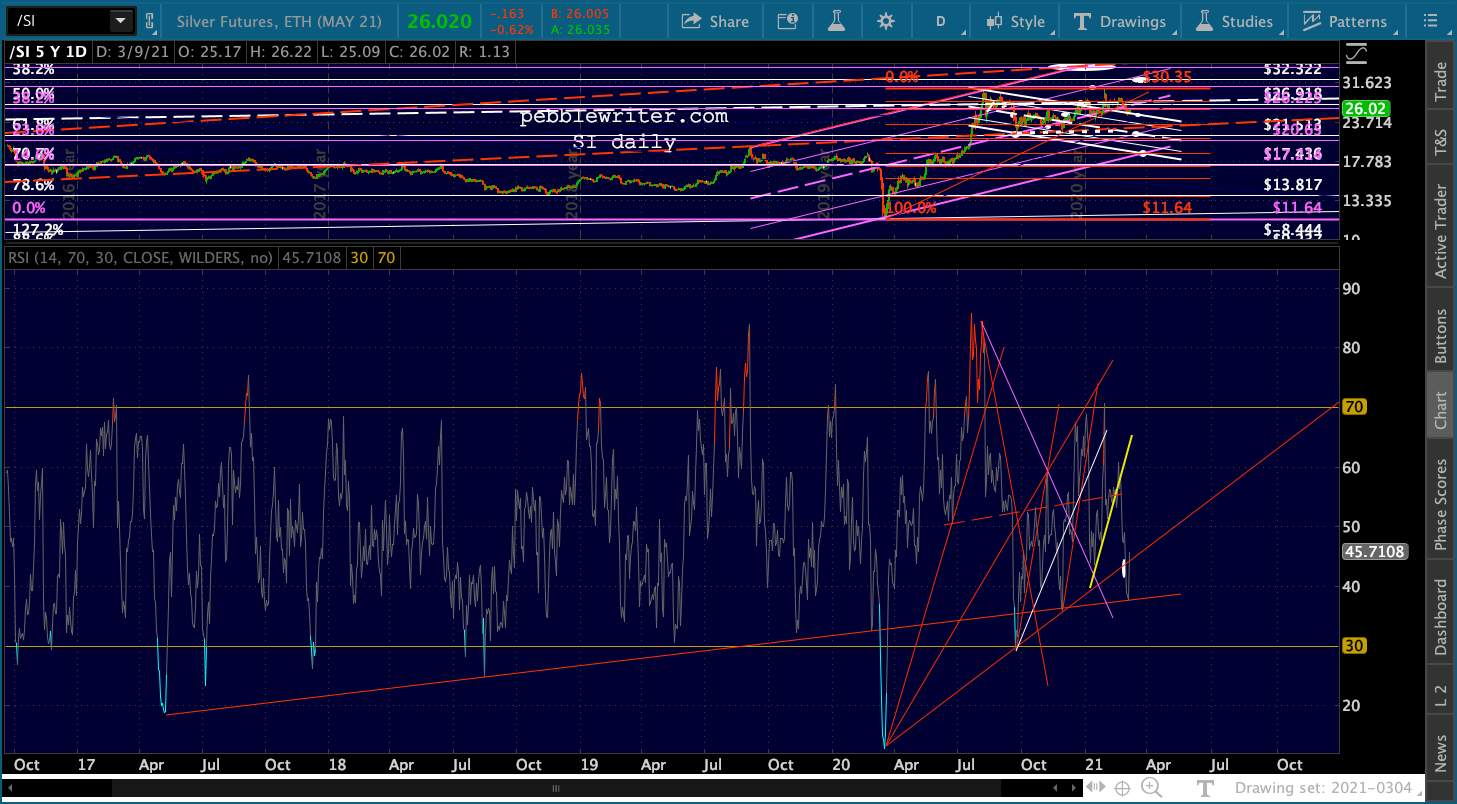 Should the backtest of the SMA200 happen before the end of the month, the falling white channel would be reentered again – with potentially negative consequences. Should the SMA200 break down, the most likely downside targets include the red fan line at 22.65, the red .618 at 18.79. But, if the SMA200 holds, then we should ultimately see 35.24 tested.
A quick housekeeping note…
Also – for anyone having trouble with logging in the past several days, I believe we’ve got the problem fixed. Our webhost installed a caching plugin which doesn’t play well with DAP – the membership management plugin we use. I’ve disabled the cache, which might slow things down a bit, but will work on getting it to work with DAP over the next few days. Apologies for the hiccups!
UPDATE: 11:45 AM
In the meantime, VIX’s breakdown = ES breakout.
 Very much higher and SPX will have broken out as well. Sigh…
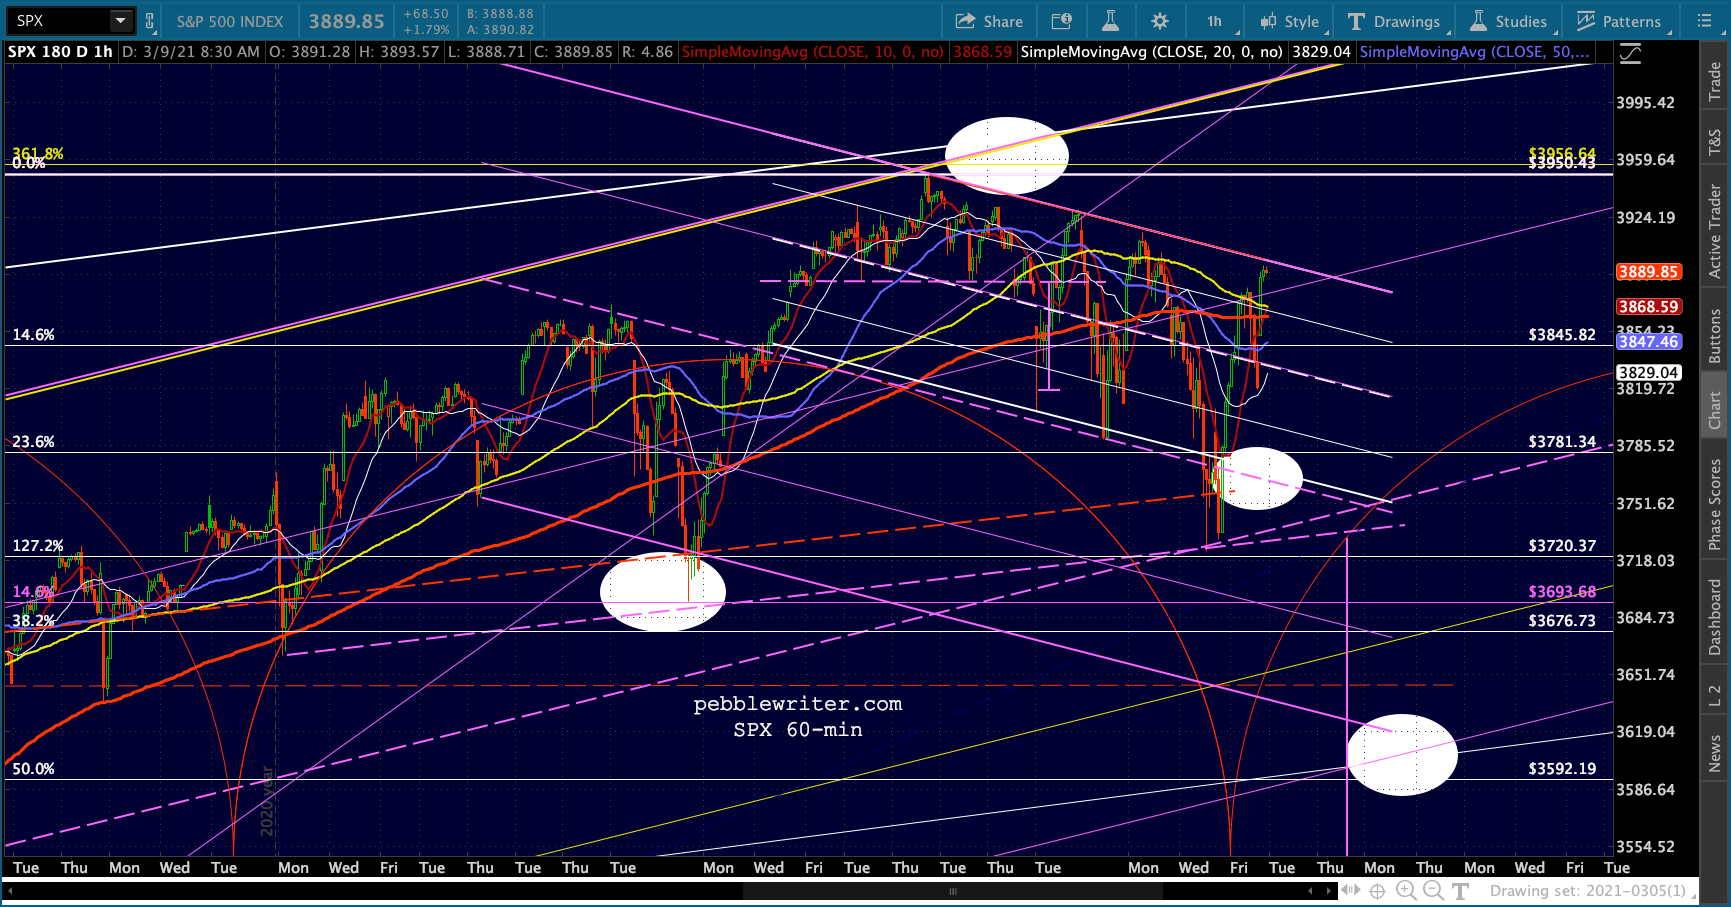 UPDATE: 3:55 PM
Having broken above that red TL, ES is now likely to backtest it…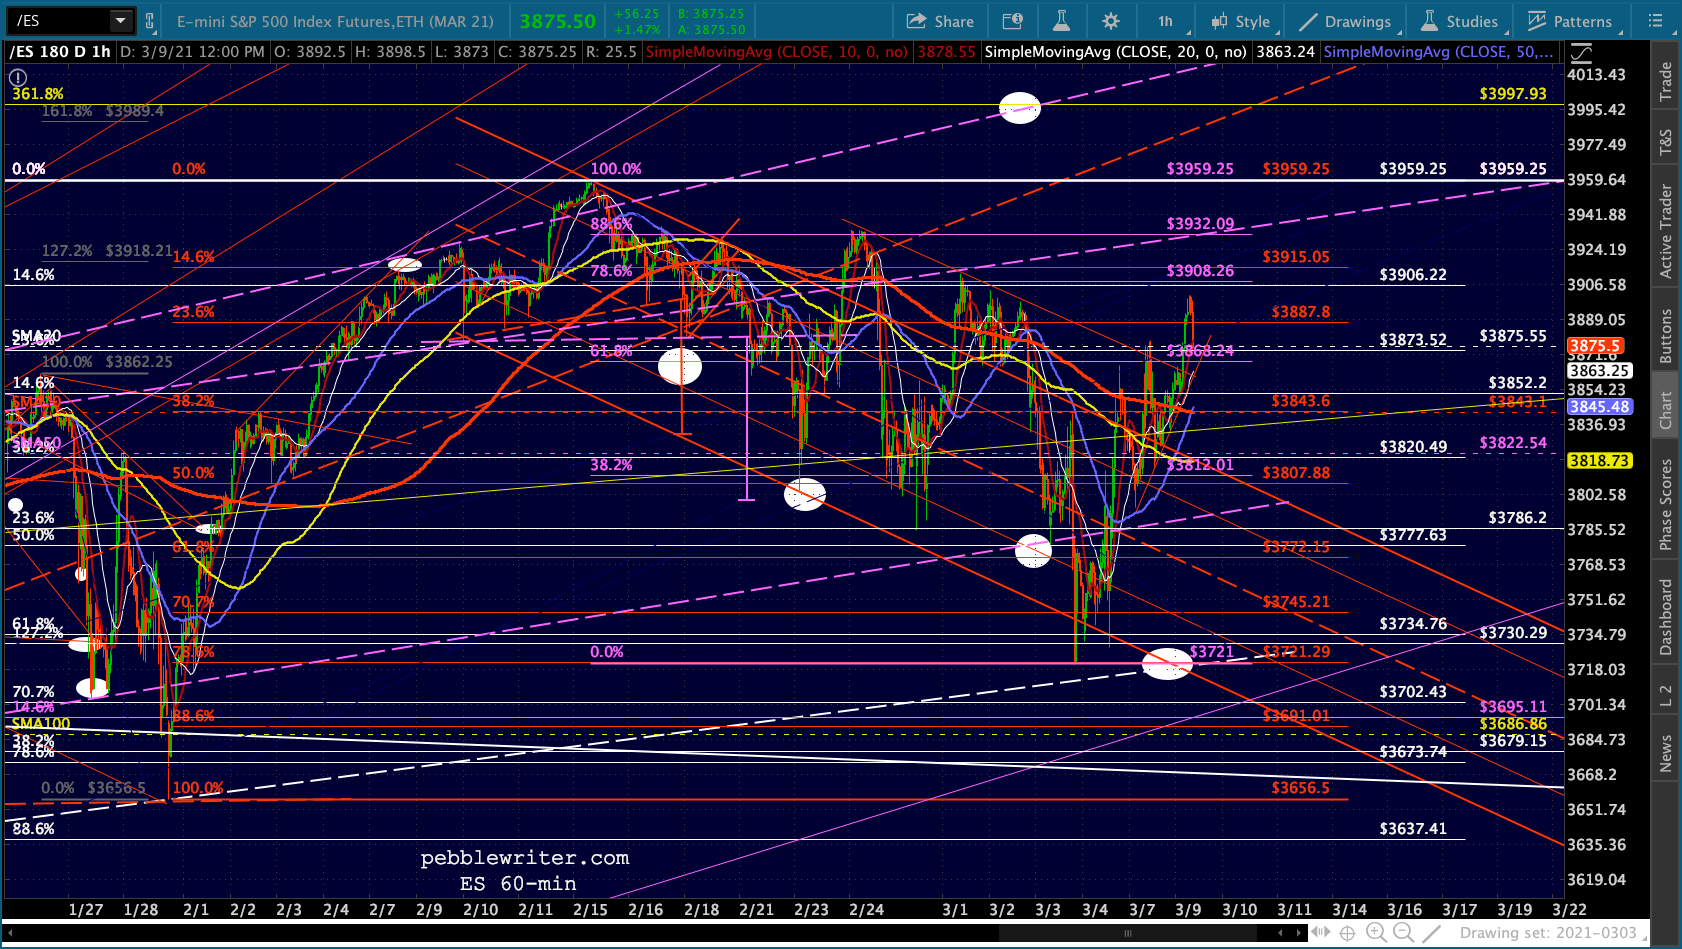 …as VIX breaks back above the TL it broke below in order to drive the algos higher.
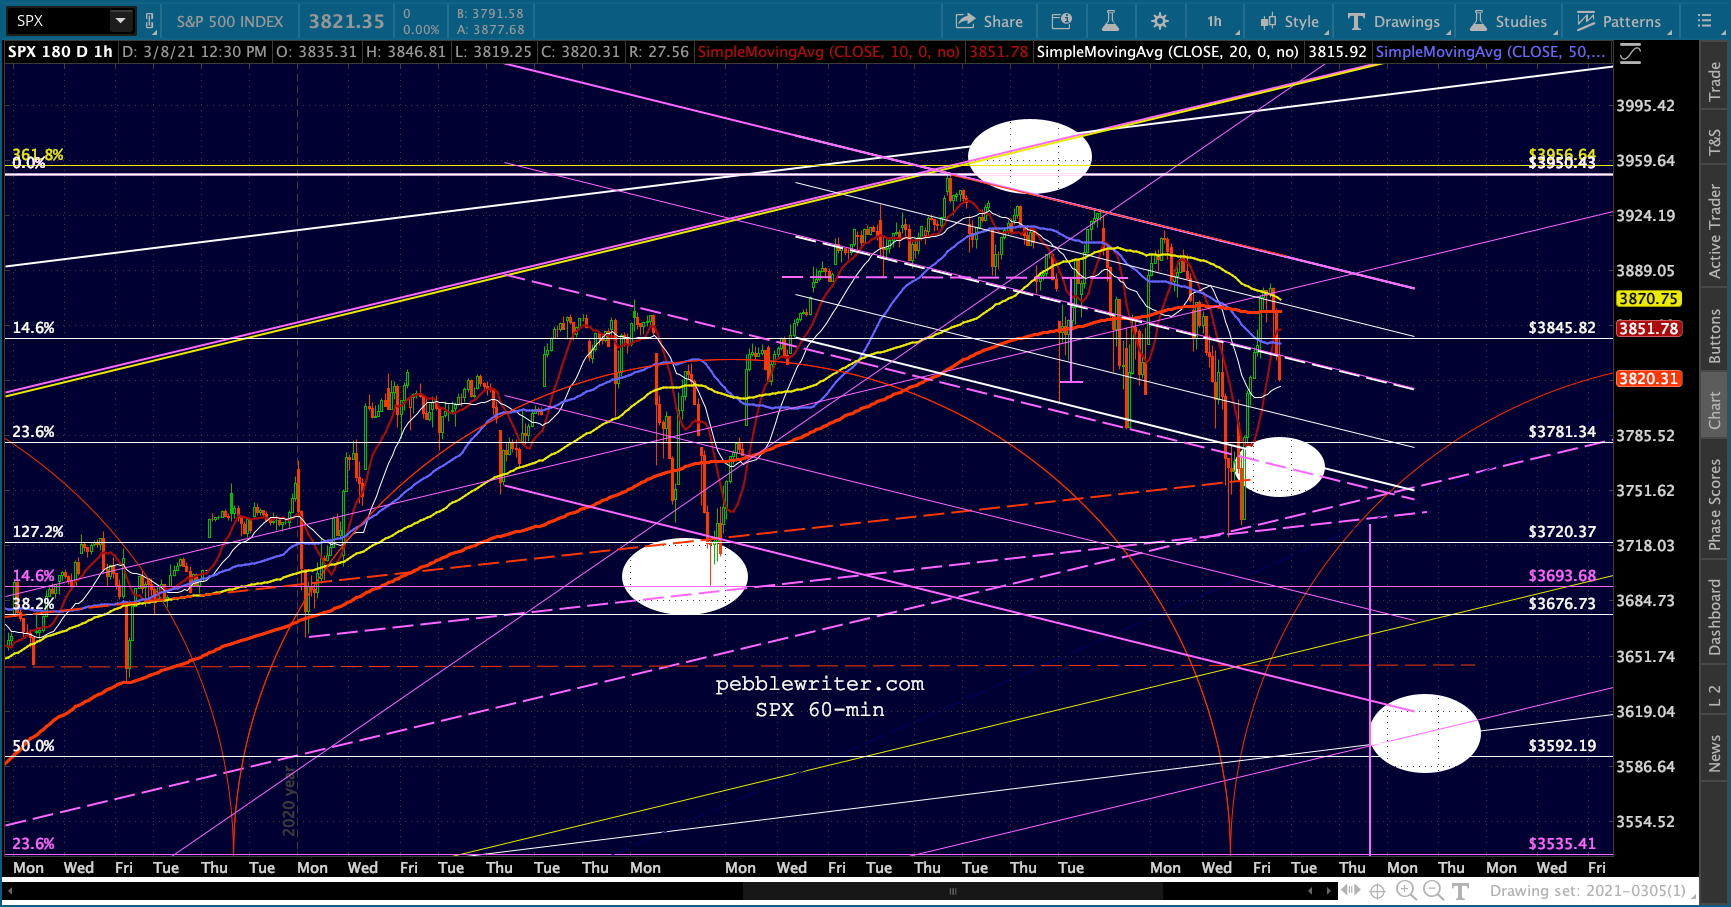
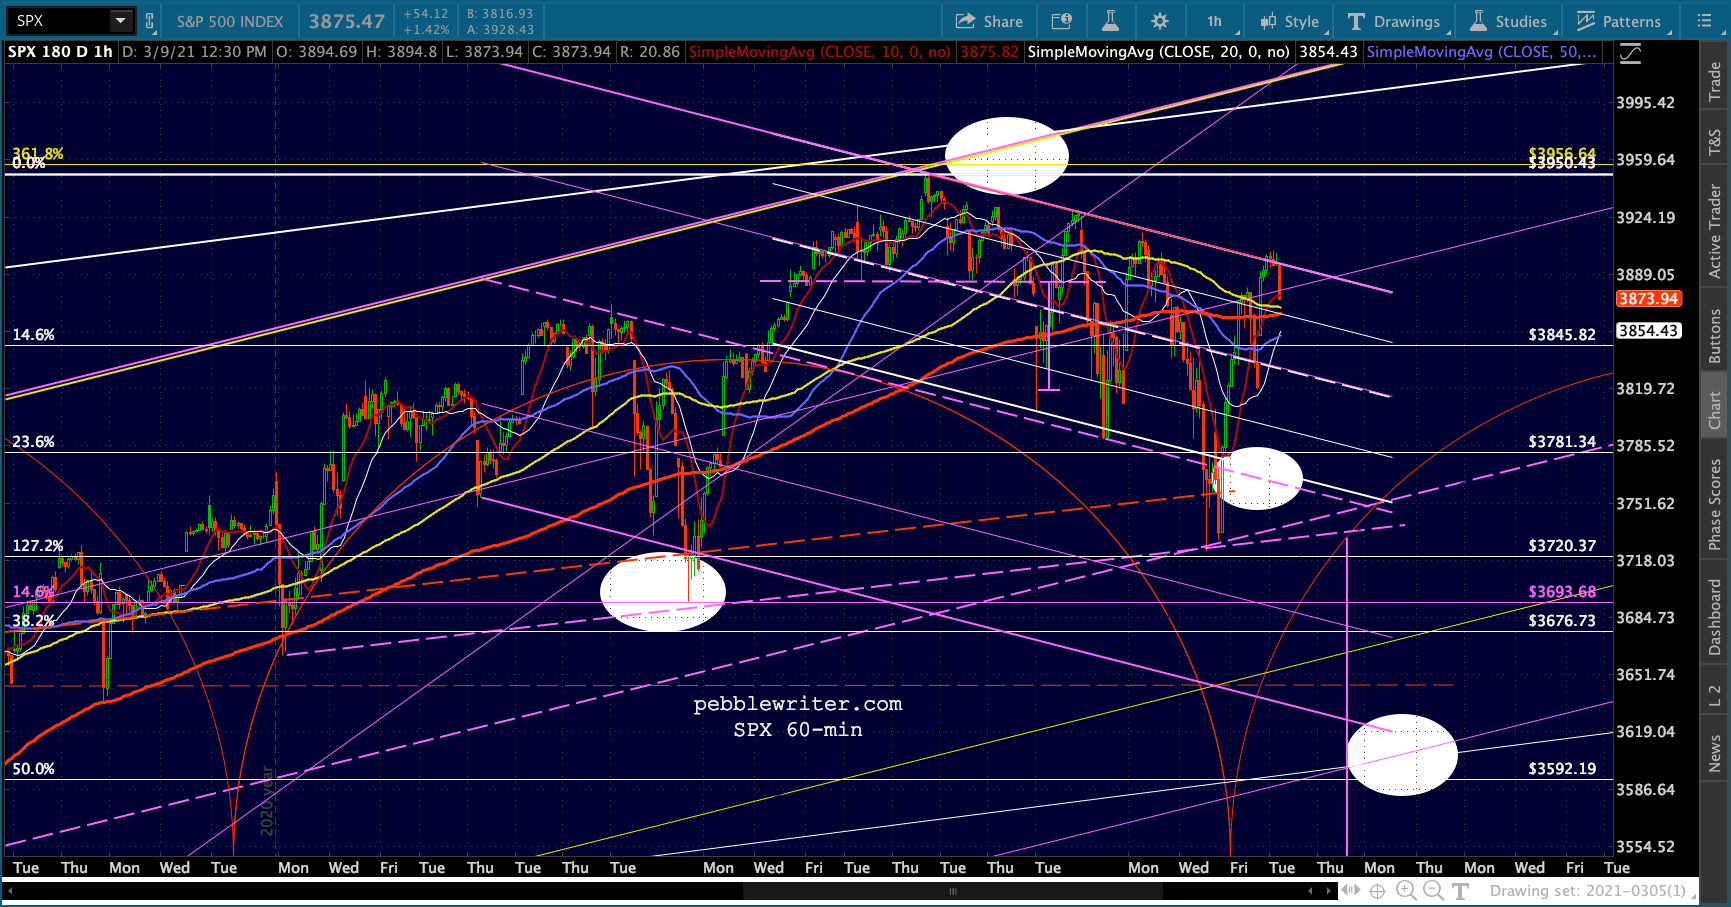
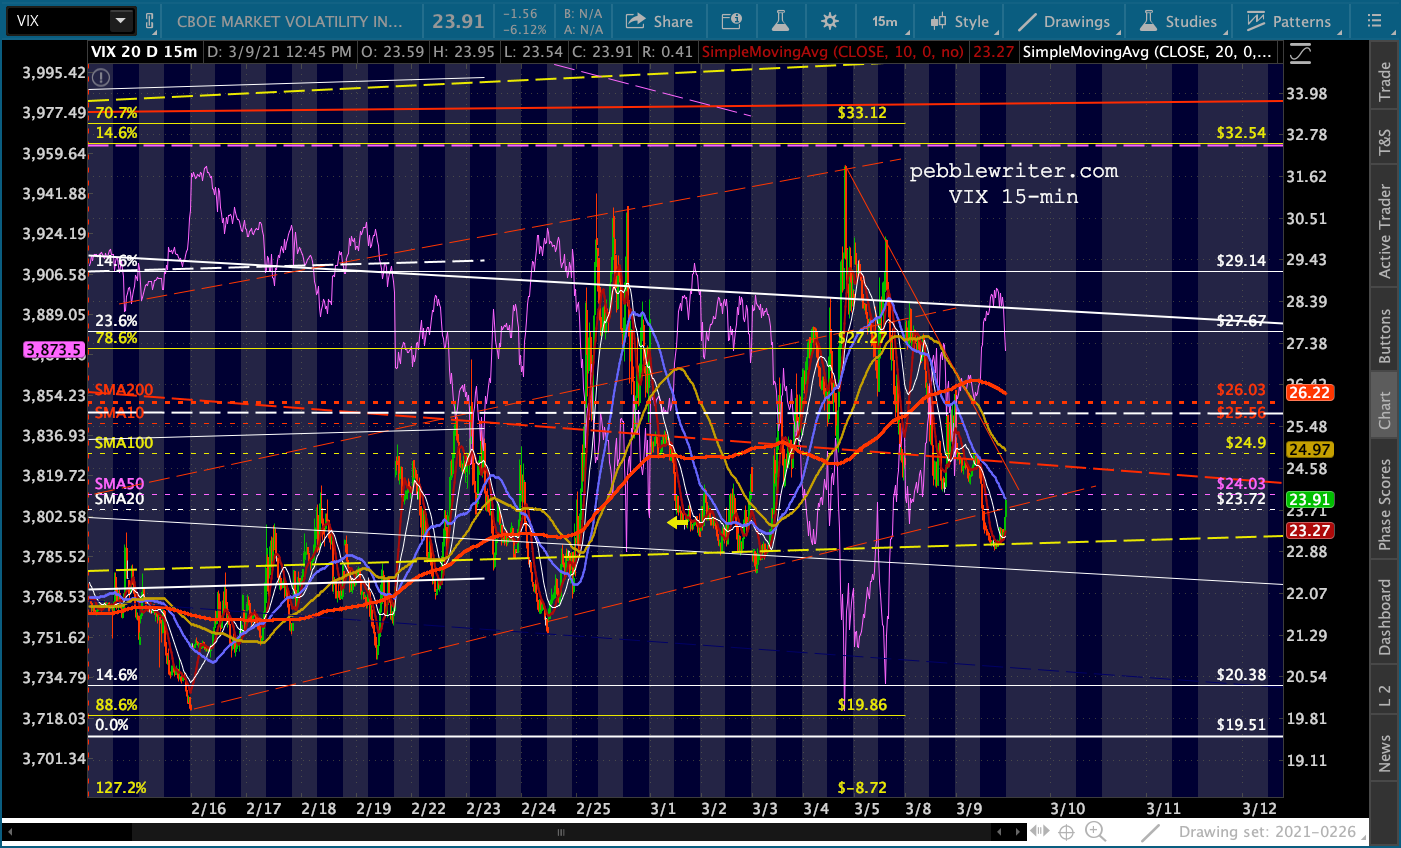 Realize that there is a decent chance that this whole exercise is just an effort to provide more room for a downturn tomorrow. Why do I say that? Simple: SPX never broke out.
Comments
One response to “Update on Gold: Mar 9, 2021”
QQQ wants to fill the gap at 328. Tesla has a gap at 780 to fill also. XLE hit the gap targets. My only question is when/if the VIX gap fills at 18…possibly when the stimulus bill passes? Also, GOLD stock has a gap at 17.86. So I question if the /GC selloff is complete yet? Mid-March tends to bring important turning points for the market since 2000 (tops or bottoms).