

ES has topped and backtested its latest falling channel overnight yet again.
 This time, however, SPX has actually tagged our upside target – an important Fibonacci extension that’s been on our radar since before the pandemic.
 With the algos poised to swing into action, today is shaping up as an important contest.
continued for members…
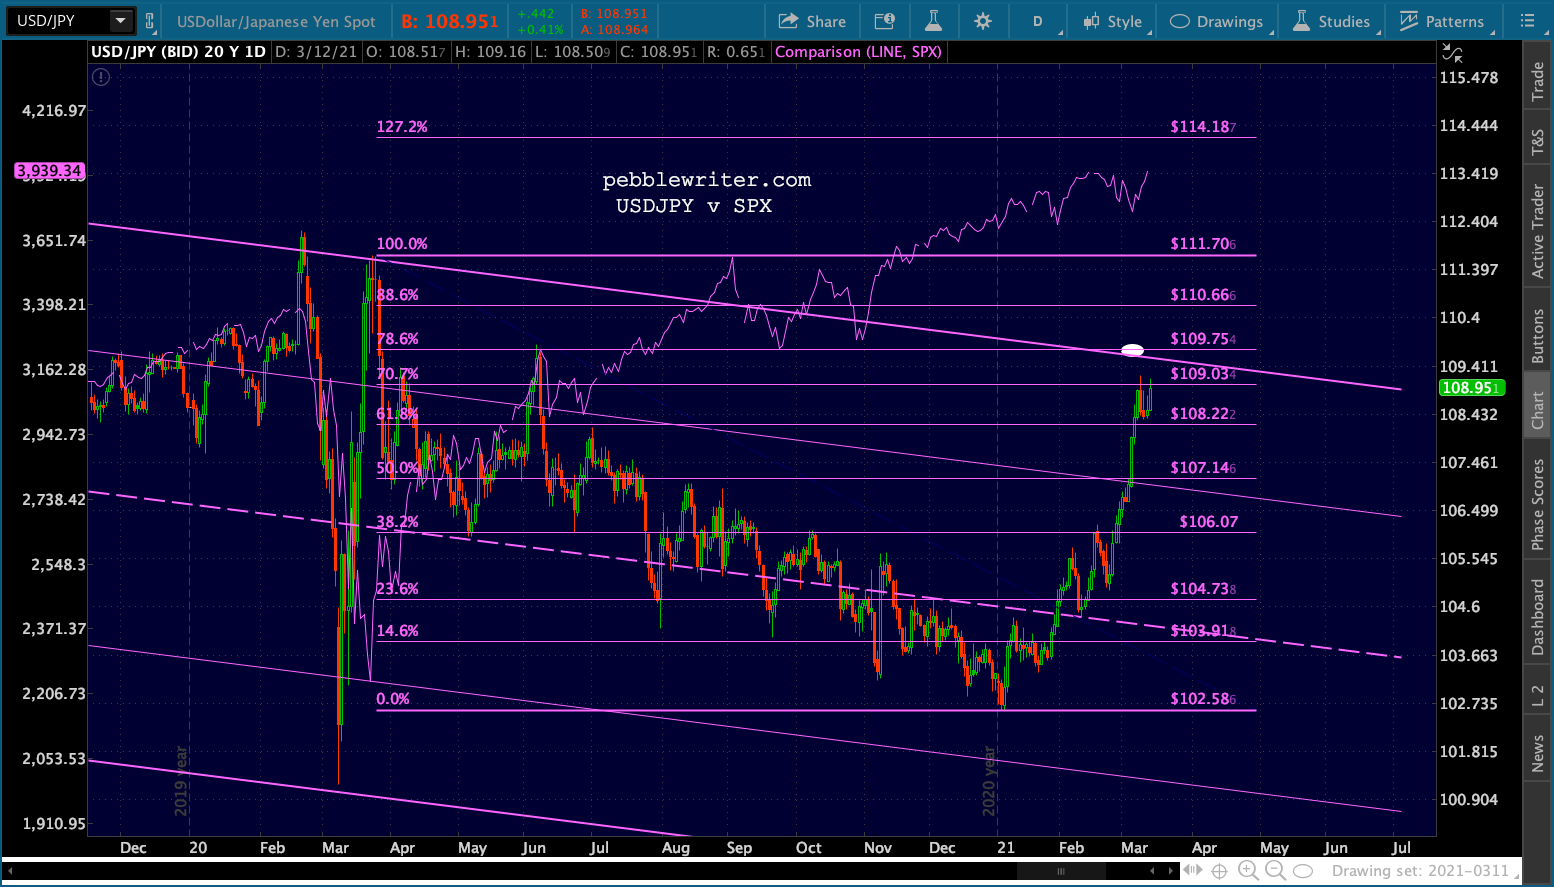
I have an appointment this morning, so I’ll post this morning’s charts and then return around 10am for the commentary. The key will be USDJPY and VIX.
 They are both positioned to lever stocks higher, especially USDJPY. But, will they?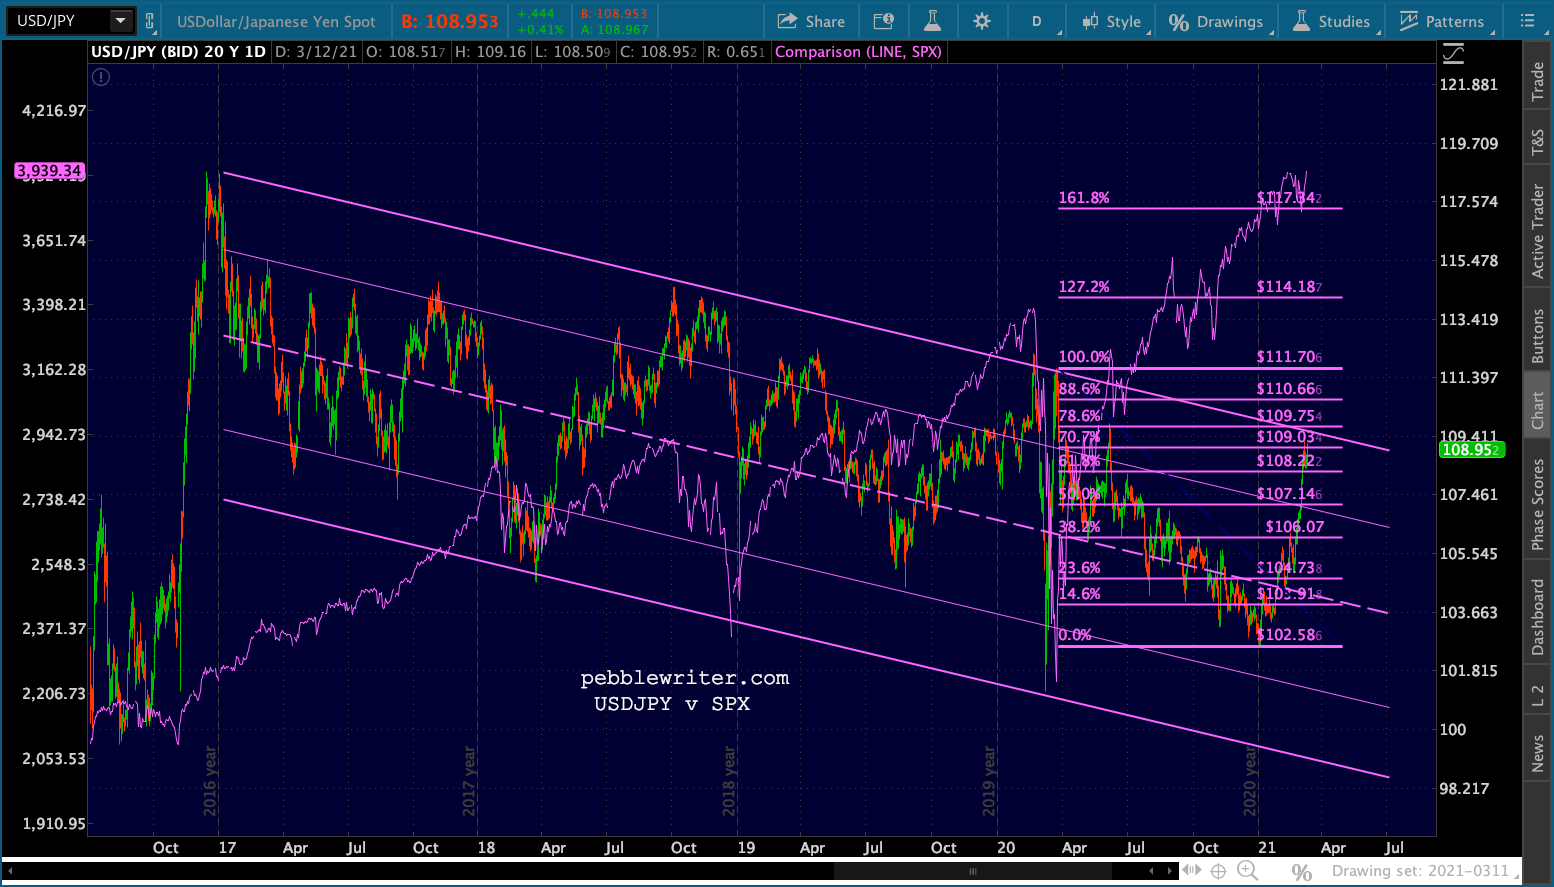
 But CL and RB could still make a statement if the Fed is willing to take the chance on surging inflation.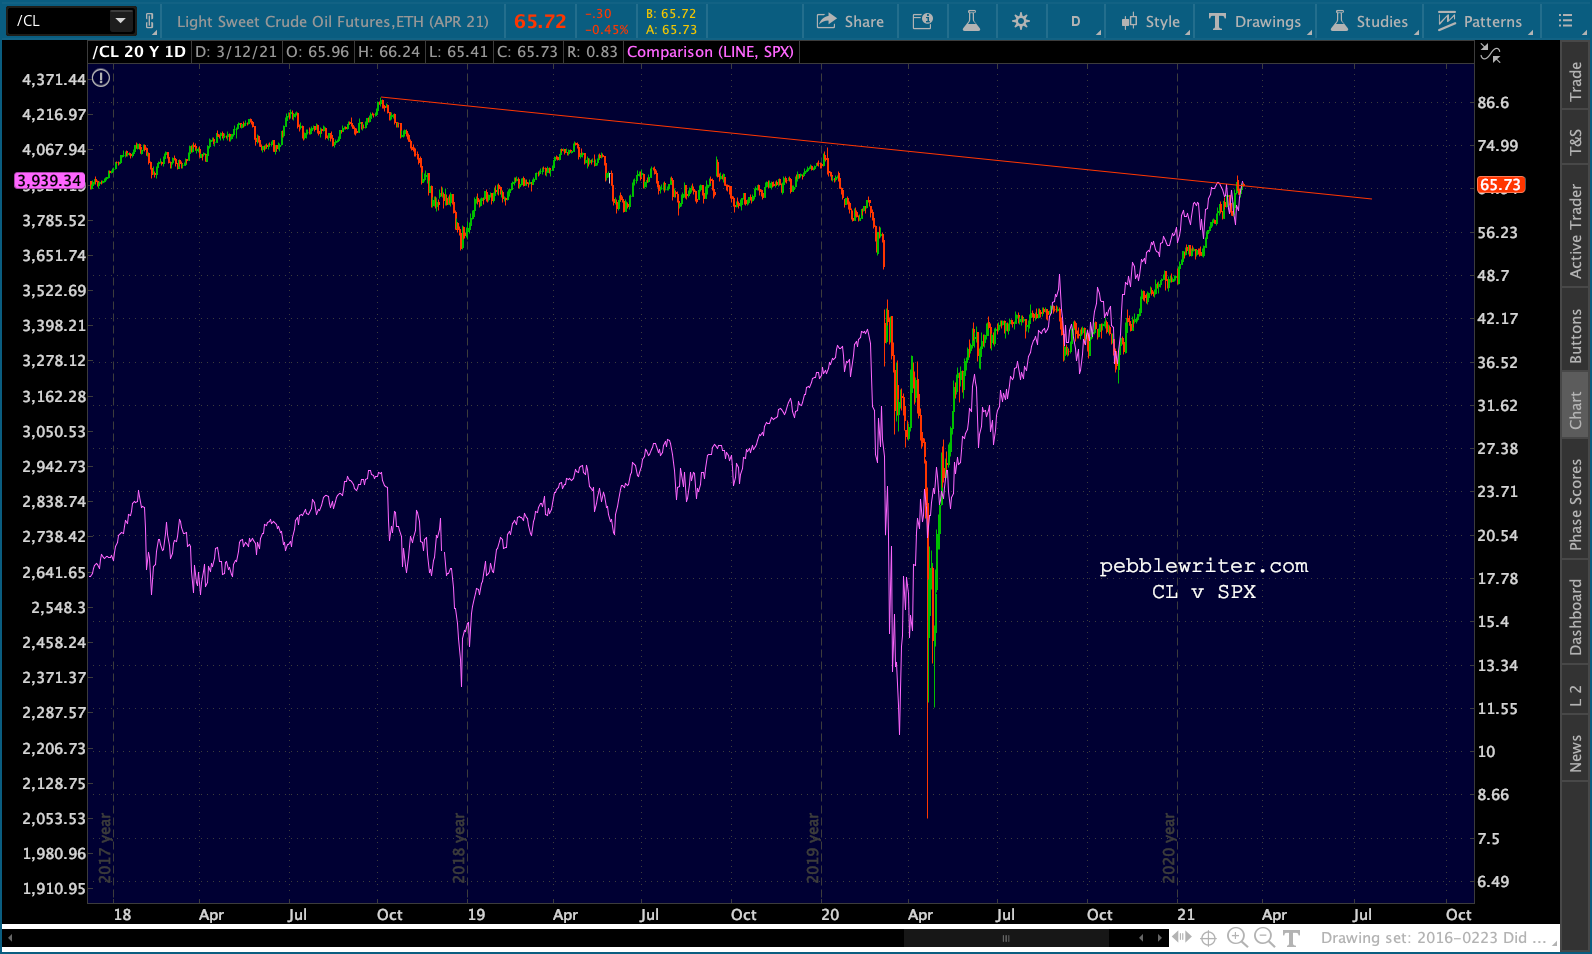

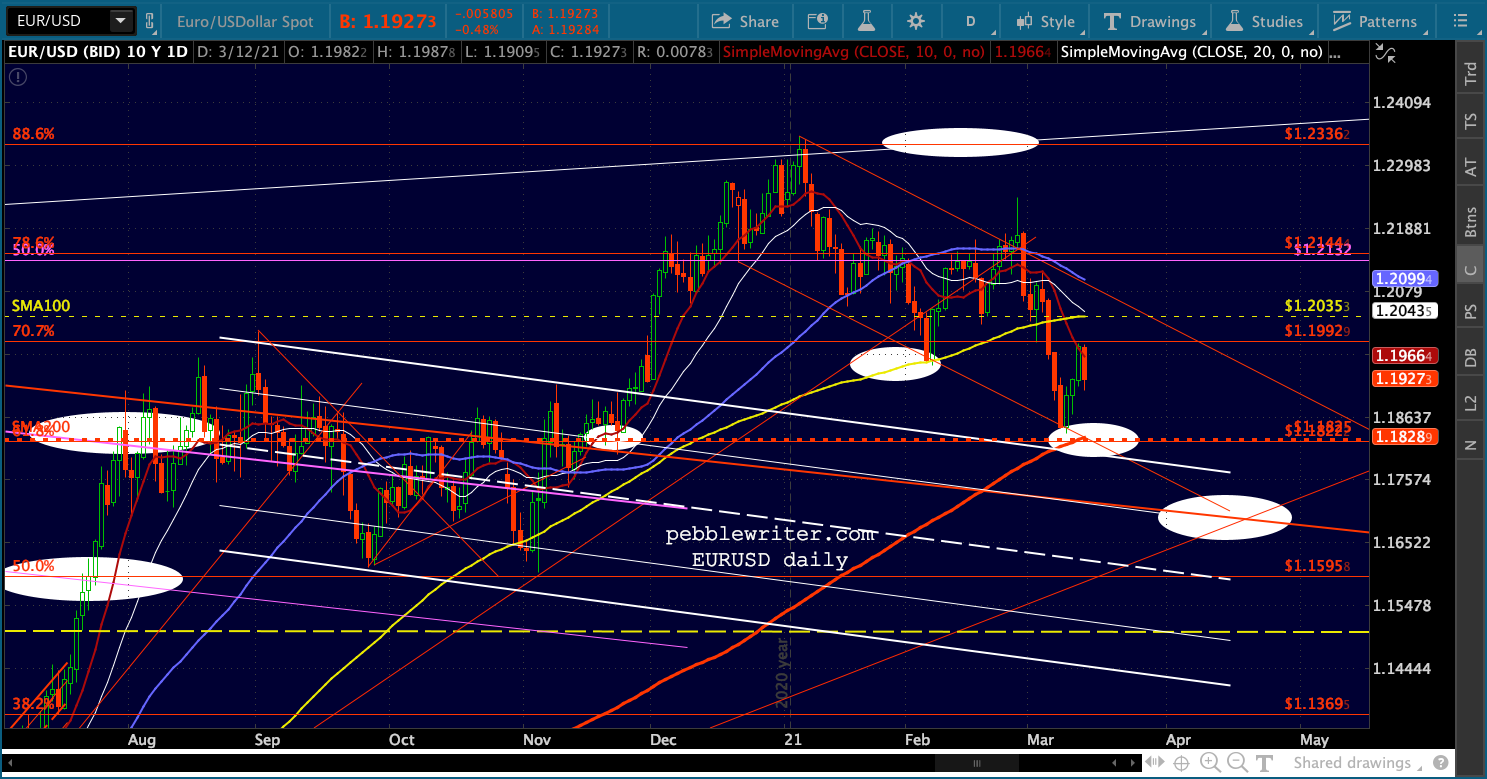
The rest of the charts:


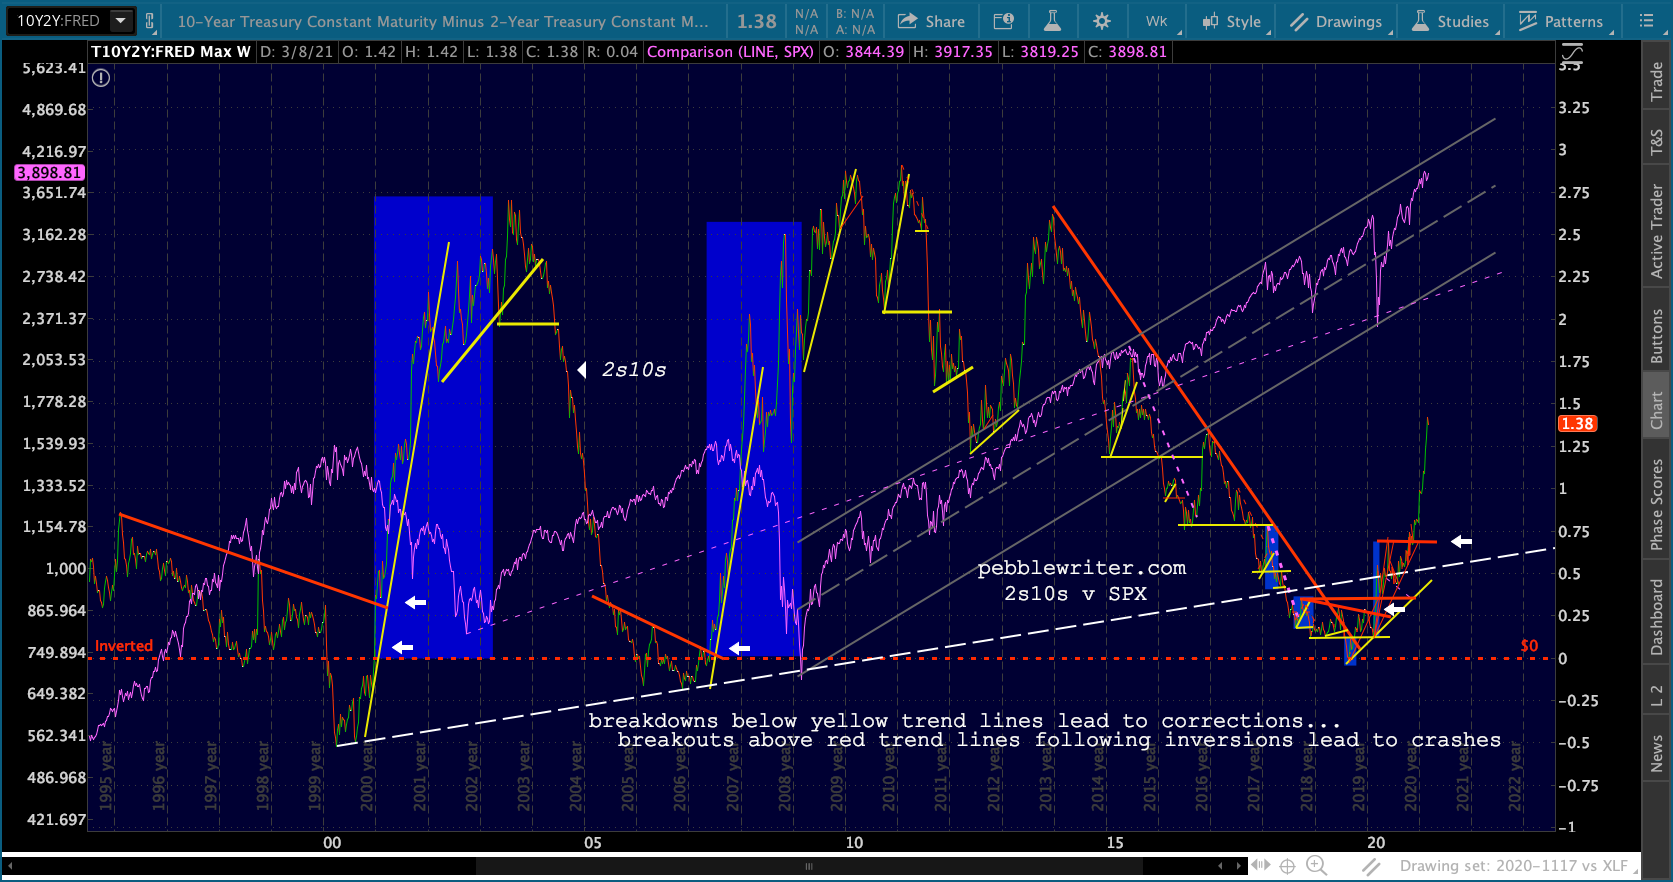
 ZN is back to the point where it could break down again.

UPDATE: 8:35 AM
PPI came in as expected, but clearly hot at 2.8% YoY thanks to oil/gas prices. Remember, next month is when TSHTF in oil/gas.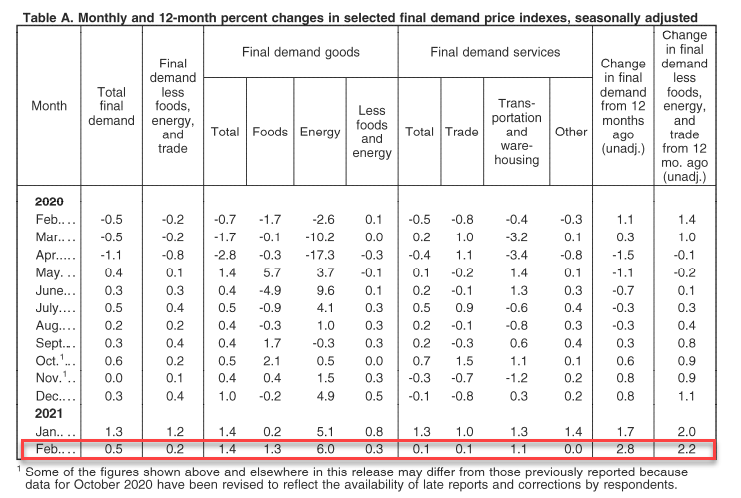 So far, VIX is holding…
 UPDATE: 3:00 PM
An hour to go and ES just can’t seem to break down. As is often the case, this leaves the door open on a Friday afternoon for a breakout over the weekend. Want to place a bet? You have to take weekend risk. Given the number of times these things go against the bears, it hardly seems worth it – especially given that ES’ 10/20 cross is only 13 points away and VIX’s bearish 10/20 cross is only 48 bps away.
For anyone wondering just how closely stocks are managed, today is a perfect example.
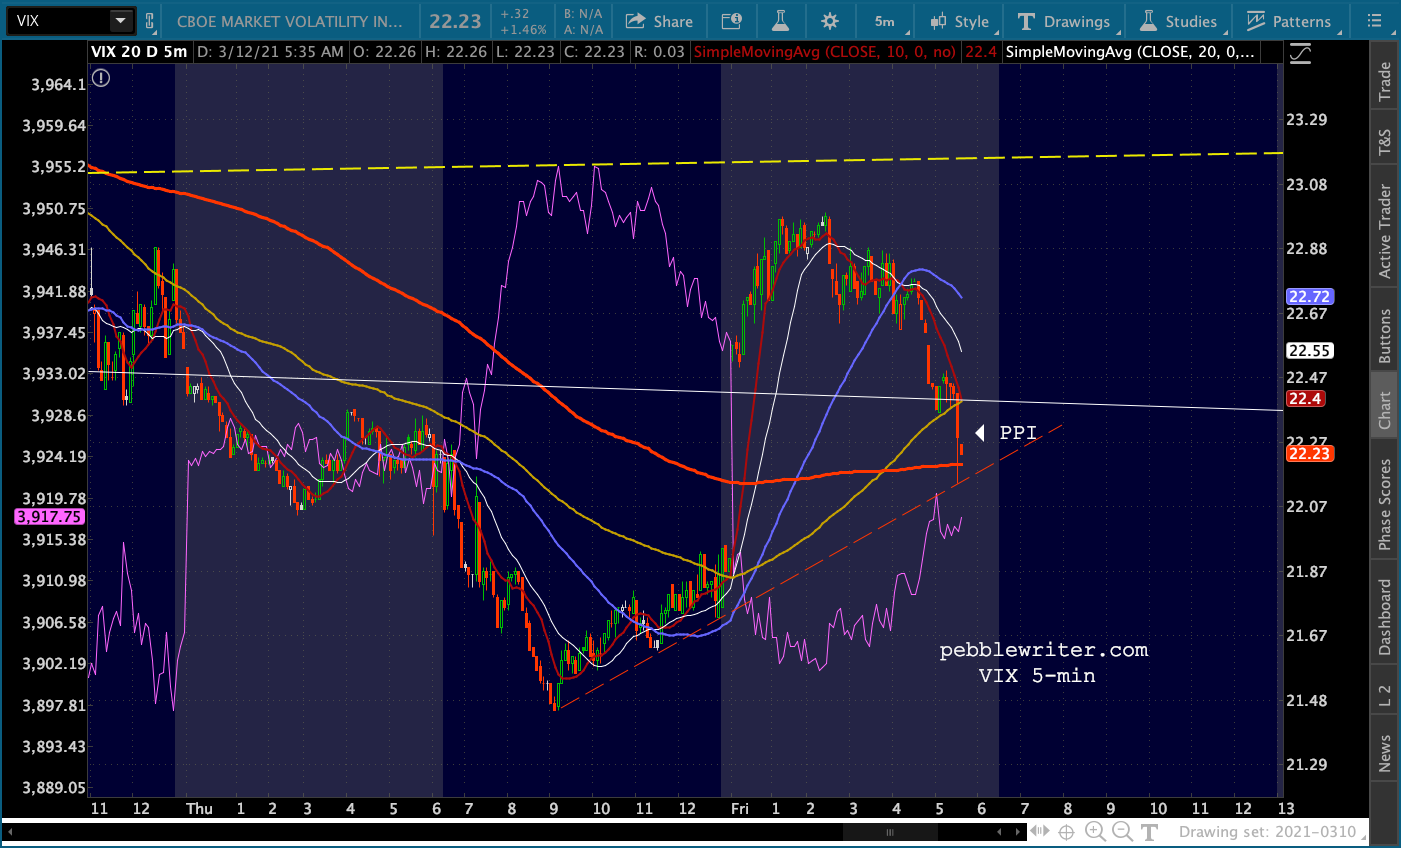
PPI came in so hot that the 10Y made new highs, with ZN seriously threatening to break down. Investors are obviously nervous about this. We saw just above, though, that VIX plunged to support within seconds of the news. This had the effect of preventing ES from falling back below the top of the falling white channel it broke out from overnight – the one it had just backtested.
 VIX bounced on this trendline, making one wonder if a decline might actually be in the cards now that SPX had reached its 3.618 extension (even though ES had not.)
But, the bounce lasted only long enough to backtest the dashed yellow TL from January 16.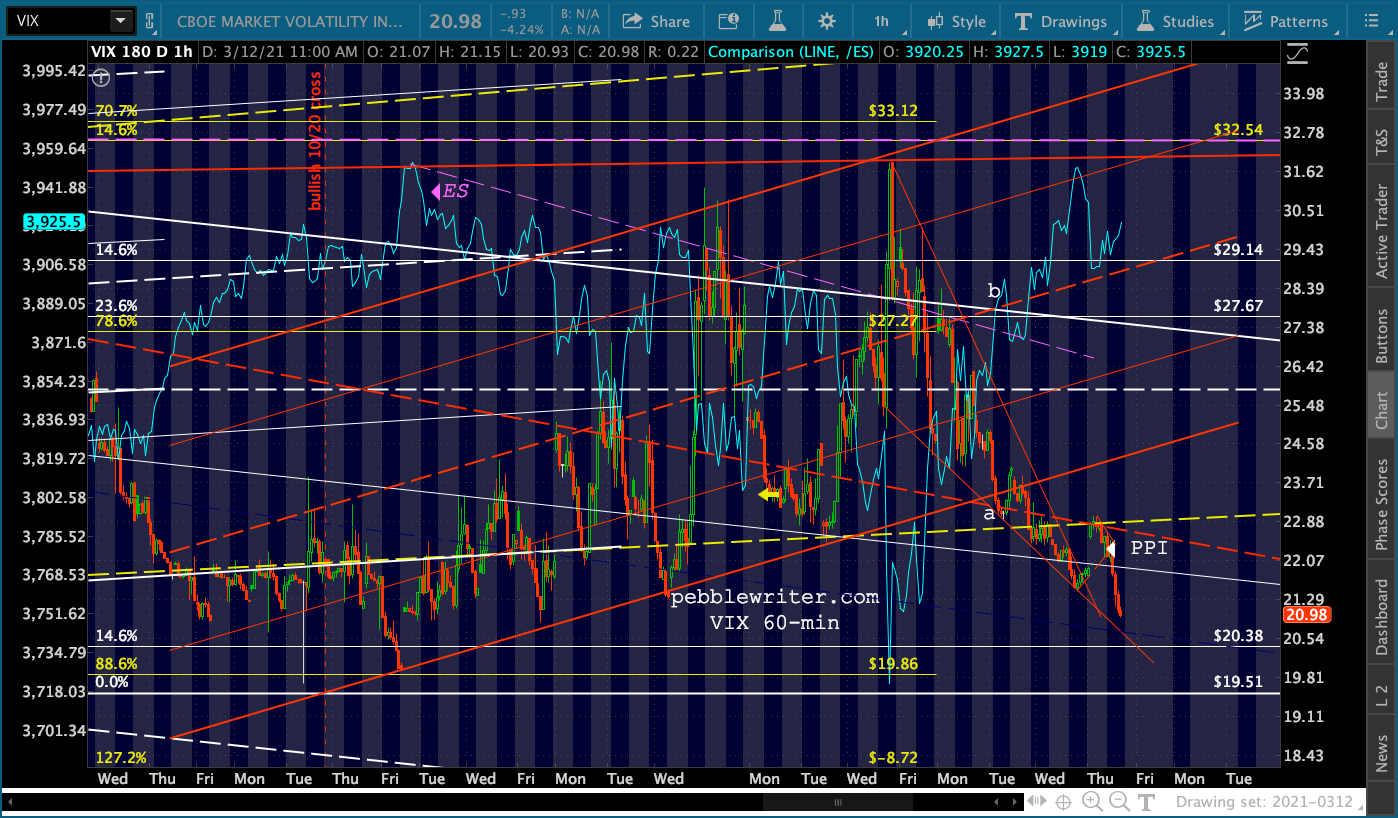 It can be seen better on the daily chart below. It wasn’t the first time this TL has been broke down. The last time it broke down on Feb 5, ES broke out to new highs.)
  This is the same thing that happened on Mar 9 when the rising red channel broke down (point “a” below) in order to help ES break out (“b”) above the falling purple TL shown below.
At the same time, SPX was finally able to break out of the falling purple channel shown below.
Though ES was oringally having a hard time making headway (it has been in the red most of the day) all it needed was for VIX to make a more noticeable nosedive. And, that’s exactly what it did. No fuss, no muss.
SPX, for its part, hasn’t broken down despite tagging that theoretically important Fib extension…
 If it can remain elevated for another session or two, it will complete a bullish 10/20 cross.
ES, which was off as much as 25 points early this morning, is now perfectly positioned to close in the green.
How low can VIX go? The .886 retracement of its rise from 11.42 last Nov 26, 2019 to 85.47 on Mar 18, 2020 has already been tagged – back on Nov 27, 2020.
 There’s no rule saying it can’t do it again. As long-time member Tim Melger pointed out a few days ago:
My only question is when/if the VIX gap fills at 18…possibly when the stimulus bill passes?
It’s looking like a pretty good call at this point. But, we’ll have to wait until Monday to find out. Sadly, TPTB don’t even care any more that the manipulation is so patently obvious.