In Harry Potter, these are the three magical objects which make their owner a master of death.
Tonight, we’ll look at three technical indicators that, while they may not grant immortality, will hopefully guide us safely through a dangerous market.

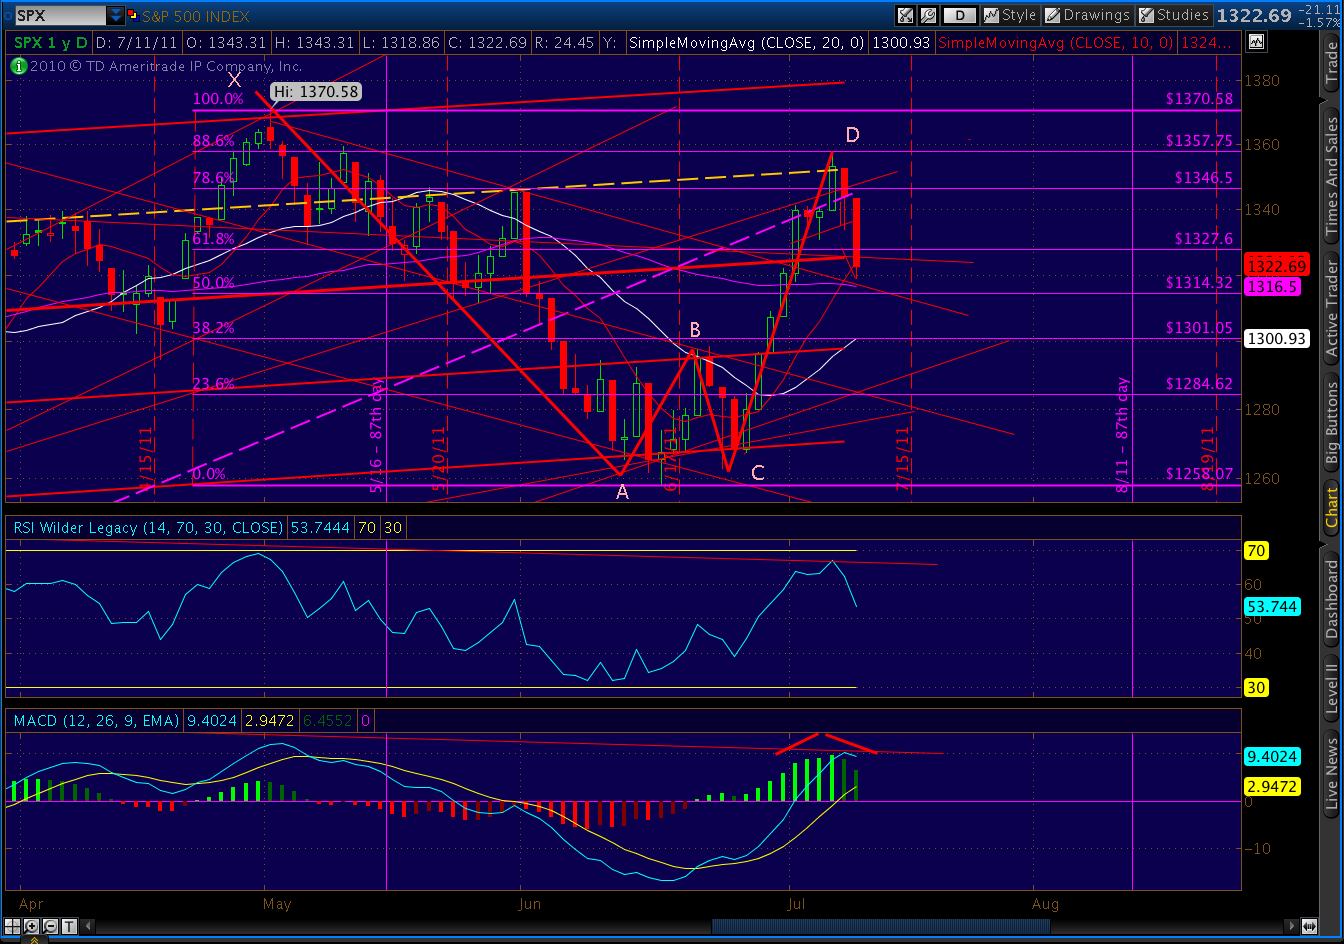
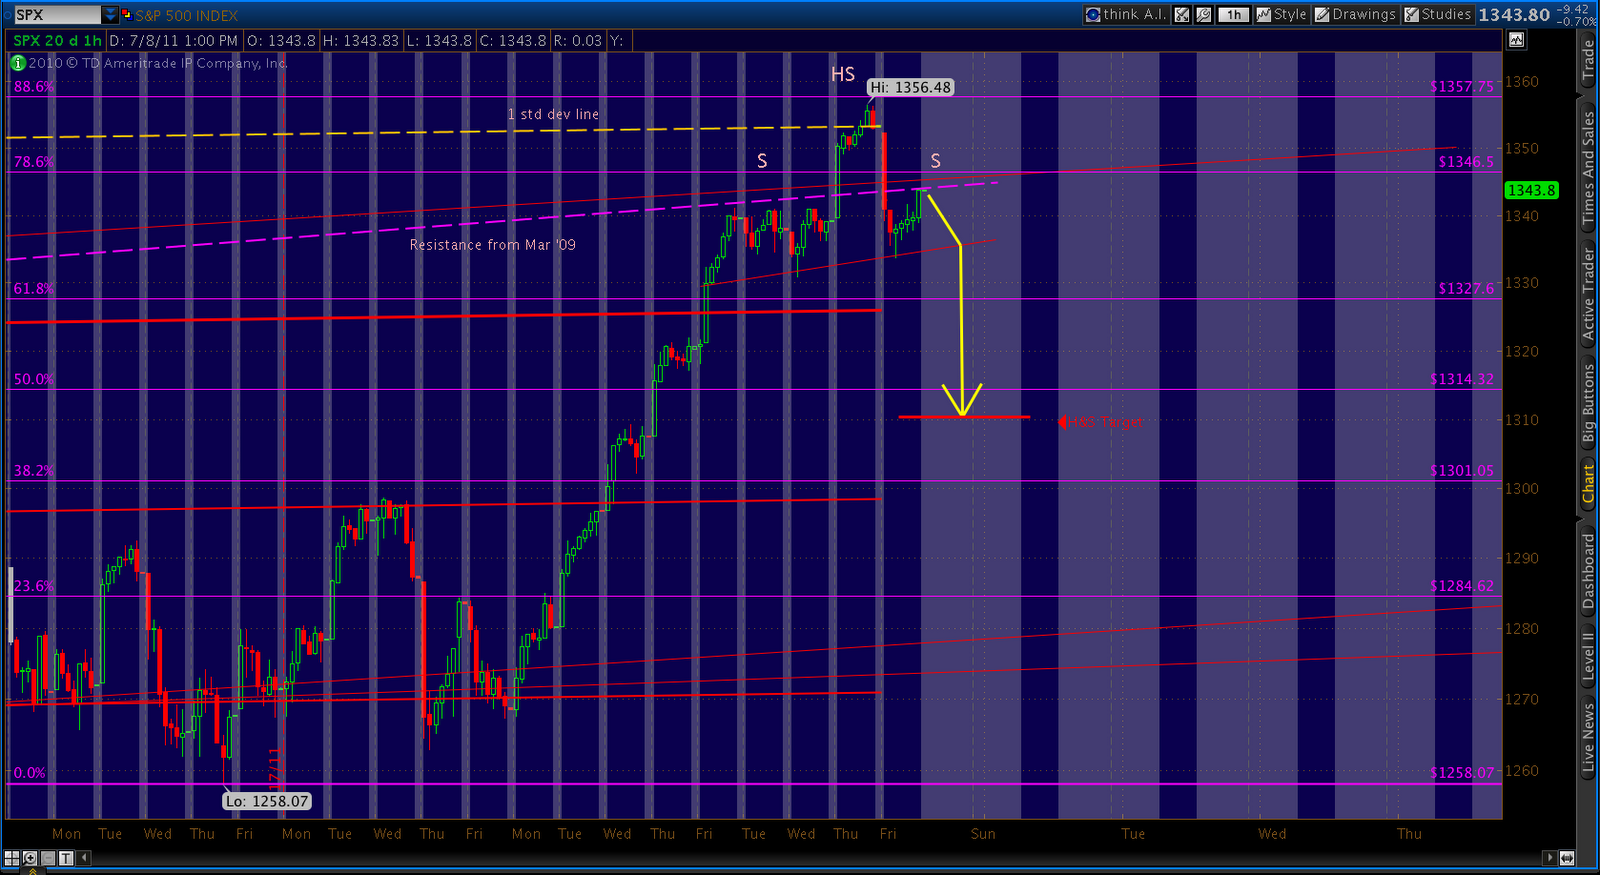
(1) Our harmonics patterns are working out exactly as expected. As we forecast in Patterns, Patterns and More Patterns back on June 27, SPX went on to form an extremely well-formed Bat Pattern (the big W in orange in the chart above.) The downside targets are devised by applying Fibonacci ratios against the DA measurement. In this case, that translates to:
(2) The regression channel has done an amazing job of defining almost all of the tops in this pattern. Look at the number of times one of the parallel red lines served as a limiting factor on either an advance or decline.
As the chart shows, the +1 standard deviation line limited advances on no less than 17 trading days since Feb 22. The midline was even more effective, defining tops or bottoms on about 20 trading days. The -1 and -2 lines defined about 19, and the +2 line marked the 1370 high.
Now that we’ve dropped beneath the midline, I think there’s a good possibility the -1 channel line will mark our next bounce. At 1299, it captures all of the Head and Shoulders downside (target is 1310) we anticipated in this past weekend’s update. And, the -2 channel line will ultimately mark our fall from this topping pattern.
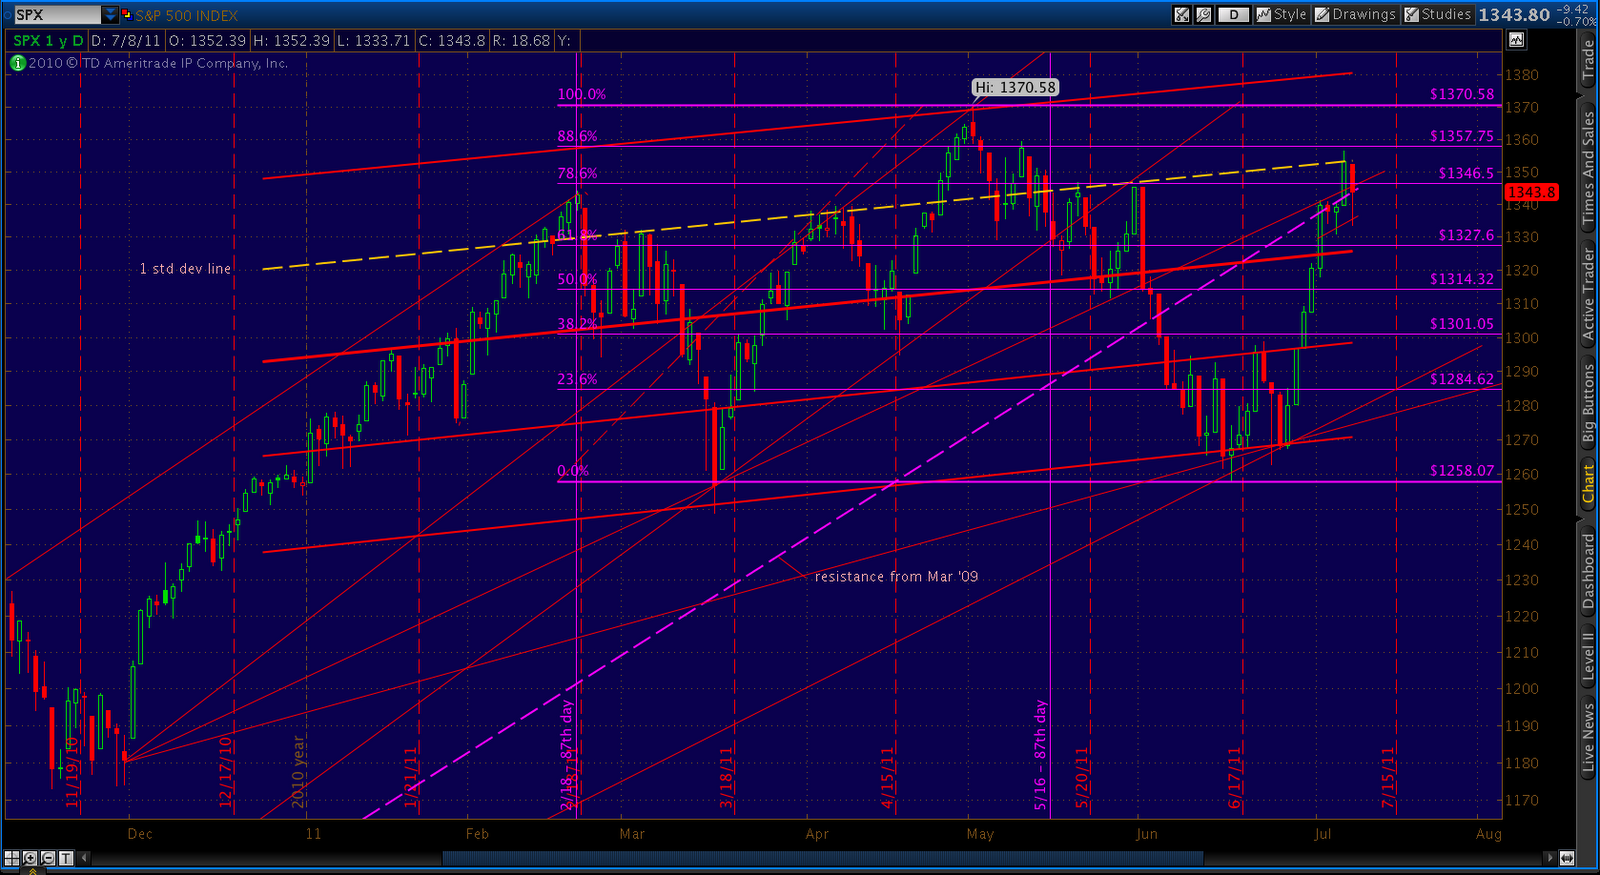
(3) The Fan Lines have been phenomenal at guiding the action on both the upside and downside. Combined with downward sloping channels, they allowed me to accurately forecast the highs on 2/18, 4/6, 5/2, 5/31, 7/6 and within 12 points of our latest top. More important, they gave me the conviction to initiate or hold positions when there was tempting evidence to the contrary.
Going forward, I expect the fan lines from Aug 31 to play an important role in determining turning points and bounces on the way down. If the regression channel midline doesn’t catch the next bounce, I expect the fan line through the Jun 15 bottom will do it. The downward-sloping channels drawn in the above chart will also consolidate our declines into predictable patterns.
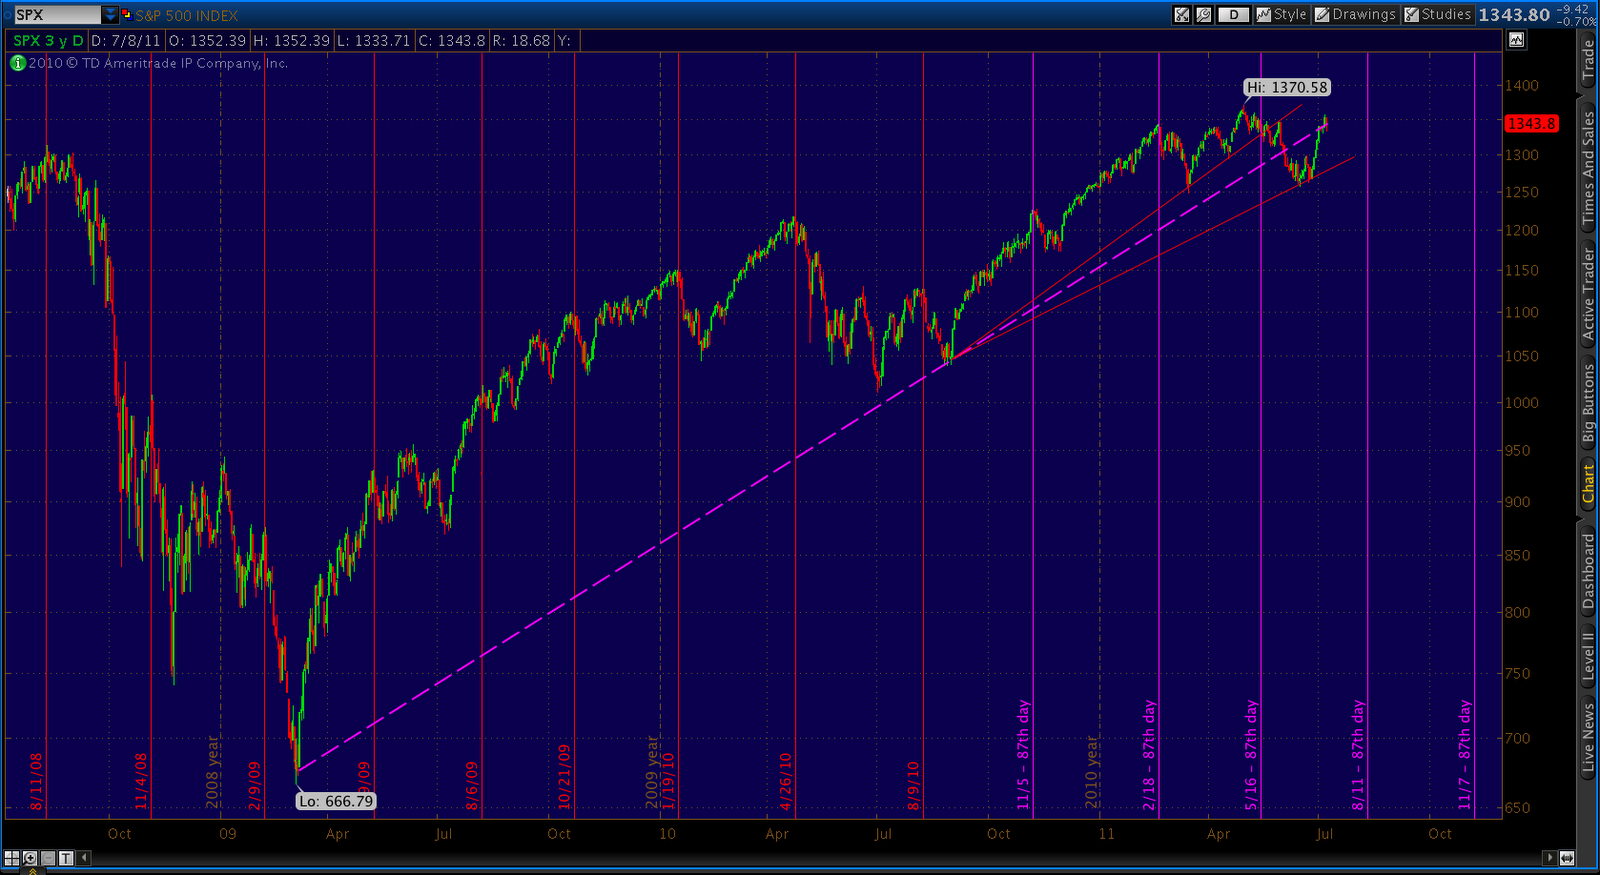
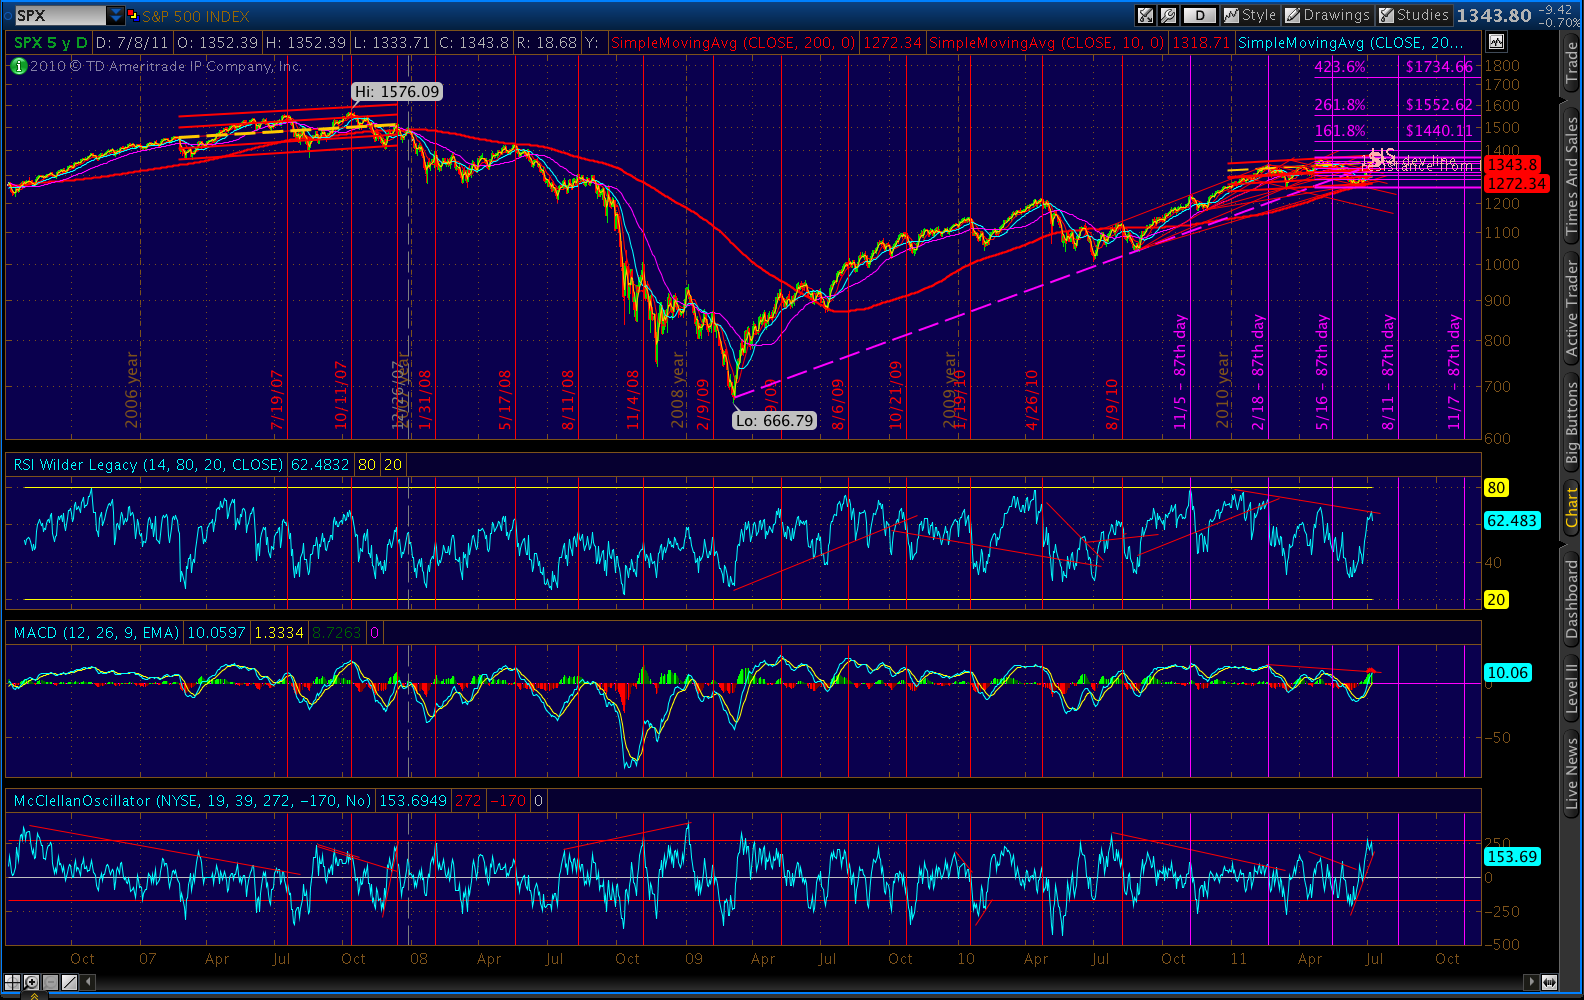
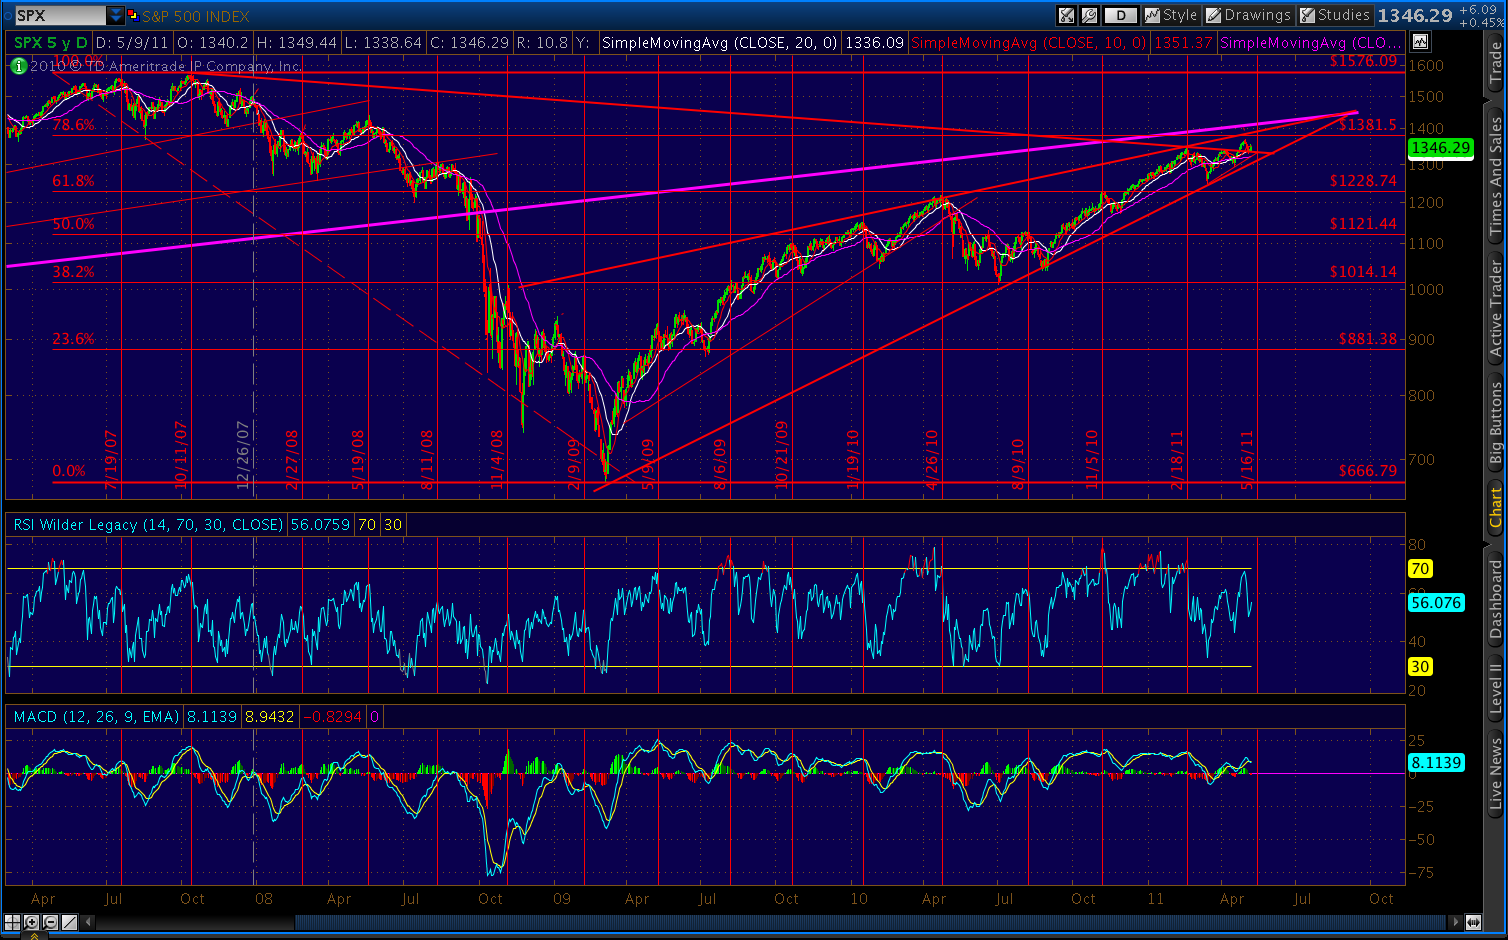
NEXT: As we talked about last Friday, the 87-day pattern I uncovered back in May [Sure, It Works in Practice] seems to play out on an accelerated basis in market tops. It happened in 2007, which is my model for this topping pattern, and it’s happening so far this time. Here’s my original chart from May 9.
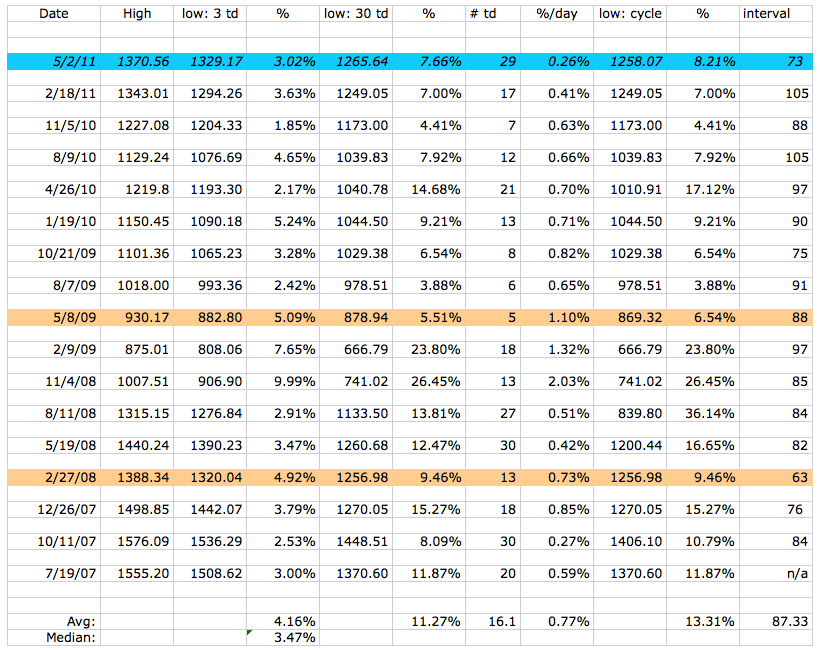
The pattern has been remarkably effective at marking interim highs. On average, every 87 days the market declined by an average of about 4% within 3 trading days and 11% within 30 trading days.
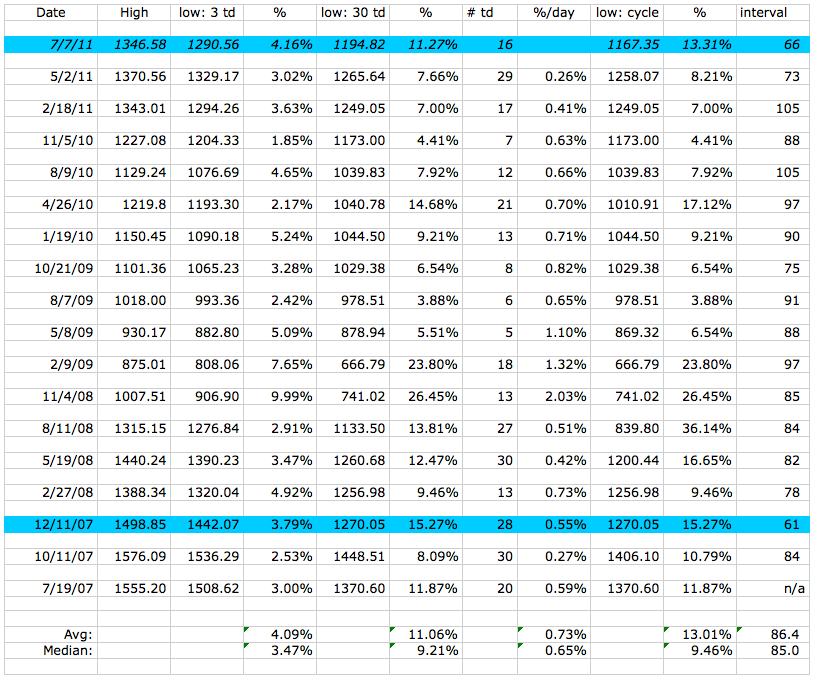
On 12/26/07, a 15% drop came along after 76 days. But, here I fudged a little. In reality, the decline started 10 days earlier on 12/11/07. The market dipped 88 points in 5 days, and recovered 63 of them by the 26th.
I initially thought to use the 26th as the starting point because: (1) the decline really picked up steam then, and (2) it was closer to 87 days. If I had used the 11th, it would have been only 61 days since the previous peak. Interestingly, the next peak came only 63 days after the 26th. I wondered, at the time, if the cycle duration “compressed” at market tops for some reason.
In retrospect, it seems obvious that the final interim high of a topping pattern should arrive after a shorter interval. After all, the reason it’s only an interim high is because it fails to go on and become a new pattern high. BTW, with this latest addition to the study, the cycle average has fallen from 87 to 86 days (I need a new name for it.) A decline that unfolds per the averages from here would reach 1290 by Wednesday and 1194 by August 18th.
Last, the huge H&S; pattern that’s been playing out since the start of the year indicates a downside of 1150. These targets coincide nicely with those suggested by my other indicators.
Good luck to all.