

I’ve been testing various methods of assessing market behavior, trying to make some sense of where we’ve been and where we’re going.
I’m increasingly partial to the Fan Principle, discussed by John Murphy in Technical Analysis of the Financial Markets (p. 74). The basic premise is that support lines act as such until they’re broken. They then become resistance lines that contain the ensuing rally (backtest) until the next lower level support line is established. Once broken, that new support line becomes resistance, etc. etc.
Most practitioners believe that after breaking the 3rd fan line, the market is heading lower (than the original pivot point, at least) — kind of a three strikes and you’re out approach.
It’s pretty easy to see over the past 25-30 years. The S&P; 500 is cruising along until 1994, when it suddenly develops an extremely bullish hair. It triples in 5 years, soaring to over 1500 in 2000 before falling back to 945 by Sep ’01. I draw trendline A to this point.
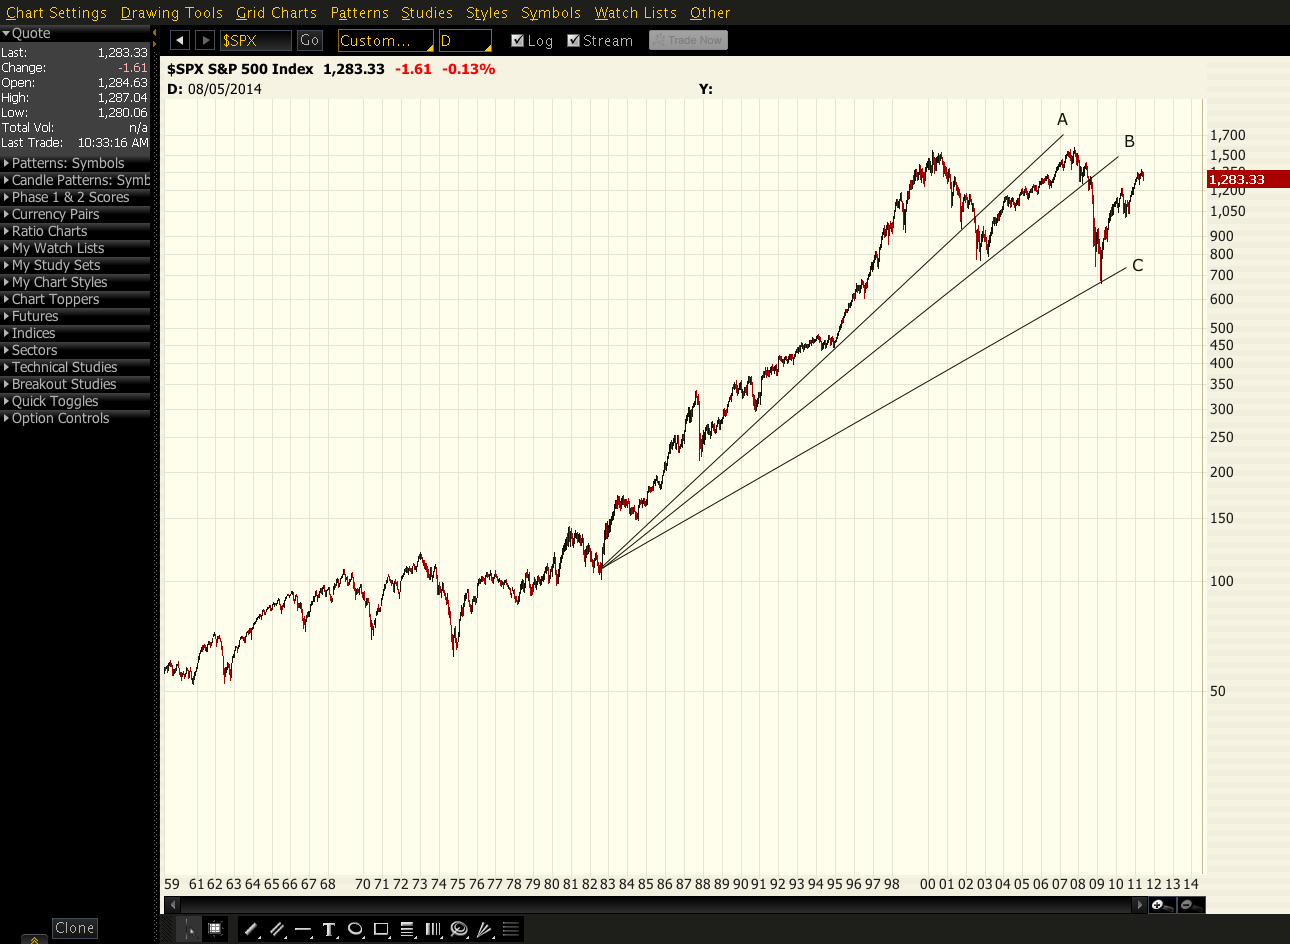
It reverses here, gaining over 200 points before running out of steam and falling back to TL-A. This time, however, it plunges through, shedding another 250 points on its way to 769 in Oct ’02. I draw another line here (TL-B). The market then backtests TL-A, now resistance, eventually giving up in Oct ’07.
It plunges through TL-B, and goes in search of TL-C, finding it in Mar ’09 at 666. Since then, we’ve been in backtest mode, trying to claw our way back to TL-B. Pretty simple, right?
There are plenty of details to consider. For one, which peaks and troughs are major enough to be pivot points for one of the trendlines?