

A reminder: There are still 3 days left on our membership promotion: a $100 discount on the first quarter of a Quarterly Subscription and an $80 discount on the first month of a Monthly Subscription. Former Annual Subscriber? Contact us to to inquire about renewing at your previous rate. For details and to sign up: CLICK HERE.
* * *
Six weeks ago we looked at the unsustainable relationship between interest rates, inflation, oil and gas prices and stock prices. A few of the charts from Bonds: More Turmoil Ahead turned out to be quite prescient.
We expected the 10Y, then at 1.85%, to reach and drop below its all-time lows at 1.34%.  It did so yesterday.
 We also forecast oil and gas, then at 59 and 1.65 respectively, to drop to at least 51.62 and 1.42.
  CL is currently at 49.66 and RB reached as low as 1.43.
 We suggested that VIX, then at 12.8, was due for a nice bounce with targets ranging from 16.97 to 34.97.
 Yesterday, it reached 30.25.
  We looked for the Dow, then at 28823, to drop back and test its SMA200, then at 26833.
  Yesterday, it slipped slightly below its (now higher) SMA200 and reached 26997.
 And, we looked for S&P futures, then at 3272, to test 3336 before reversing to 3190 and, if the absence of a bounce, to drop to 3076.
  They climbed to 3397 before finally reversing and reached 3091 yesterday.
 The key to the accuracy of all these forecasts and others was the observation that oil and gas prices were not compatible with the then-current interest rates and would need to fall sharply in order to maintain an accommodative monetary policy.
CPI came in on target the following morning, and the divergences are in the process of being “ironed out.” Our long-term forecast and cycle study for TNX has more than proved its worth. What is it saying now that rates have dropped to all-time lows?
continued for members…The falling channel and the regularity of the 10Y’s periodic lows cannot be ignored.  The white channel has obviously broken down and, though we might see a bounce here, that support is now suspect at best.
 ZN has reached the top of the purple channel, but there are bigger fish to fry.
 Perhaps the most disturbing development for stocks is that oil and gas now have a very compelling narrative to go with what our charts have said for months: oversupply and falling demand. CL is hitting new cycle lows this morning. But, we’ll see new EIA inventory data at 10:30 ET.
 The weekly chart indicates the rising white channel, which had faltered, is again breaking down.

 My long-term forecast is still extremely bearish.
 As expected, USDJPY has broken out in order to offset oil and gas’ drop. But, it has become very difficult to devalue the yen in light of the coronavirus pandemic.
 The breakout has reversed and is bouncing of a backtest of the long-term channel top. But, it’s hard to imagine the USDJPY soaring by 10-20% as might otherwise been the case given Japan’s economic problems which are now more likely than ever to worsen.
 With EURUSD having reached critical long-term support, it is very likely to at least maintain these levels…
 …which means that DXY’s ascent is probably done unless — and this is a very big IF – unless the US really does dodge the coronavirus bullet. This seems very unlikely to me. I heard just this morning that we don’t even possess effective tests yet and that only 500 tests in total have been conducted in the US – about 16 per day nationwide.
Given the sheer stupidity of enacting 14-day quarantines for an extremely contagious virus with a 28-day incubation period, it seems to me it’s only a matter of time before the thousands of people fleeing China, Korea, Japan, etc. infect unsuspecting Americans.
If DXY stops rising, inflation will face continued upward pressure unless oil and gas prices continue falling — which would be a net negative for stocks.
I expect a negative Q1 GDP print for China. Given the connectivity of global economies, I suspect we’ll see flat to negative prints around the world unless a cure pops up in the next week or two – highly unlikely given that most experts suggest the time required to develop a vaccine is a year or longer.
This leaves the markets increasingly dependent on falsified data (e.g. this morning’s new homes sales numbers), algo games and monetary easing. They have certainly been effective before, but we’ll see them tested in conditions they’ve never before faced.
Here’s where things stand as of 9:00 this morning. ES has reached its 1.618 and 1.272, not to mention its yellow IH&S neckline. These are all good support levels we’ve been watching.  But, I suspect we’ll test the 2.618 at 3076 sometime between now and when the SMA200 reaches it.
 SPX has not reached its 1.618 nor its 1.272, so the argument is even stronger here. Note that its SMA200 is now right on top of its 2.618 Fib at 3047 — a very compelling target. Its neckline is currently around 3088.
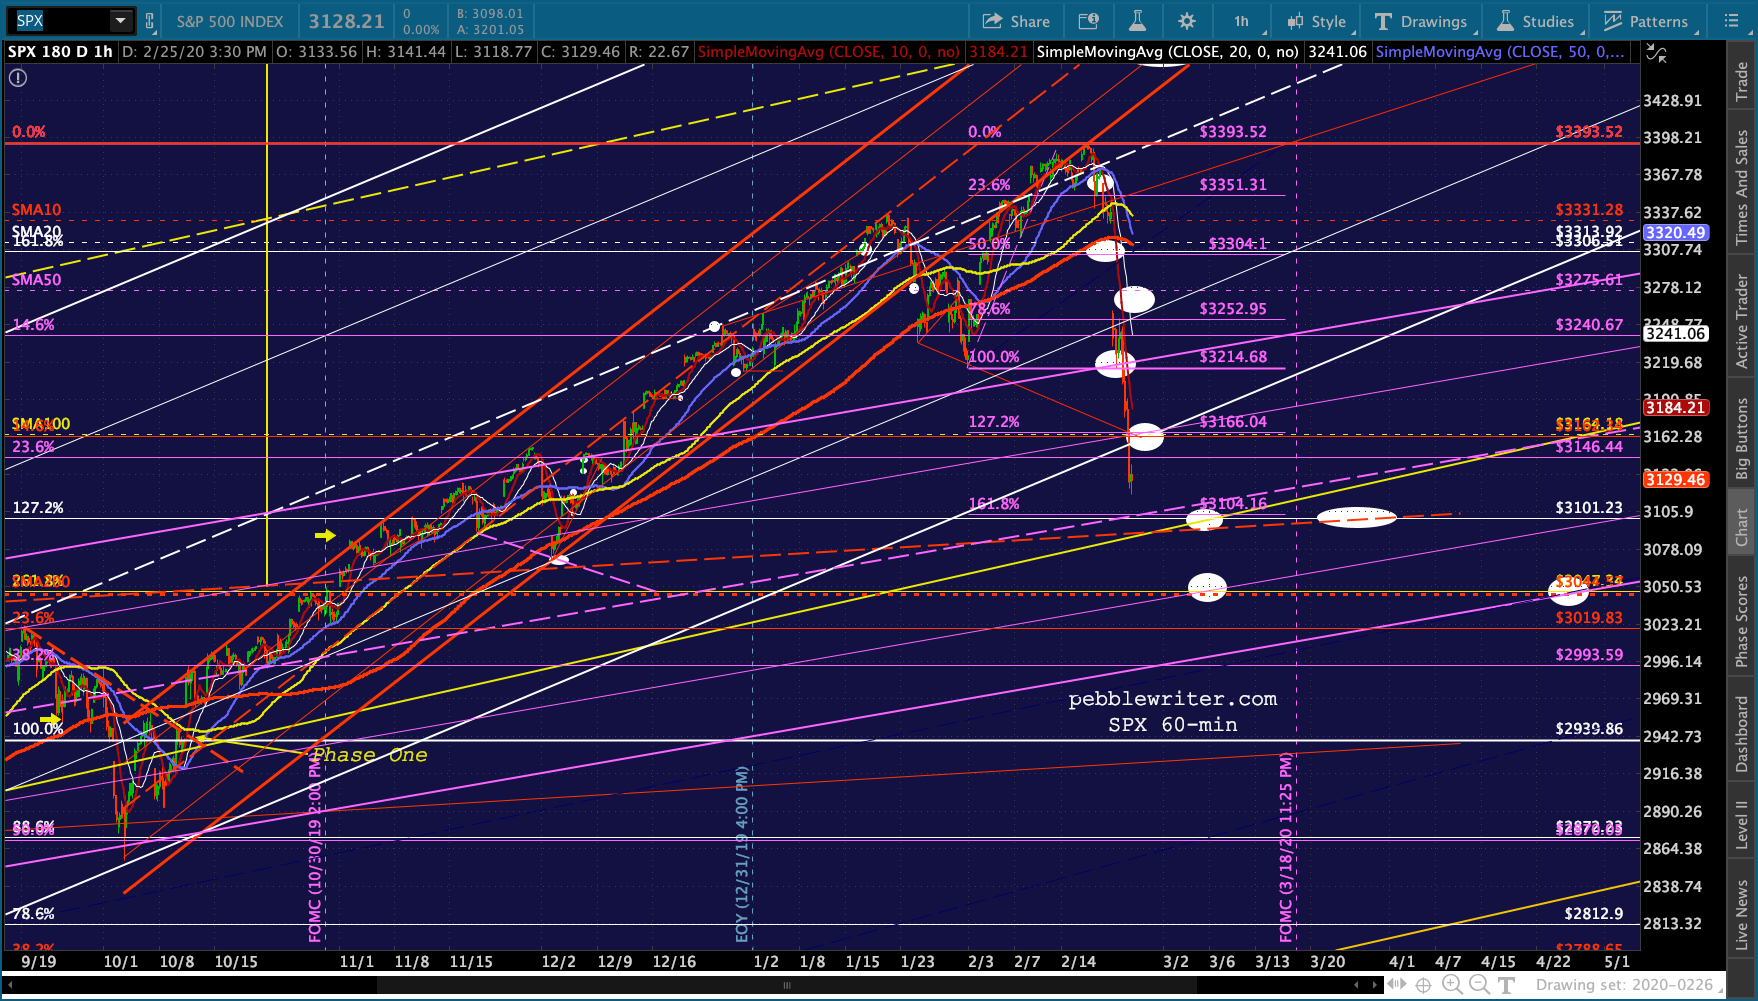
 The insinuation, then, is that the current bounce won’t last. Though, it goes without saying that not every SMA200 tag which should have happened over the past two years actually happened.
 The 2Y is still well below 1.4% and still falling.
 While the 2s10s is still bearishly aligned and merely backtesting an internal trend line.
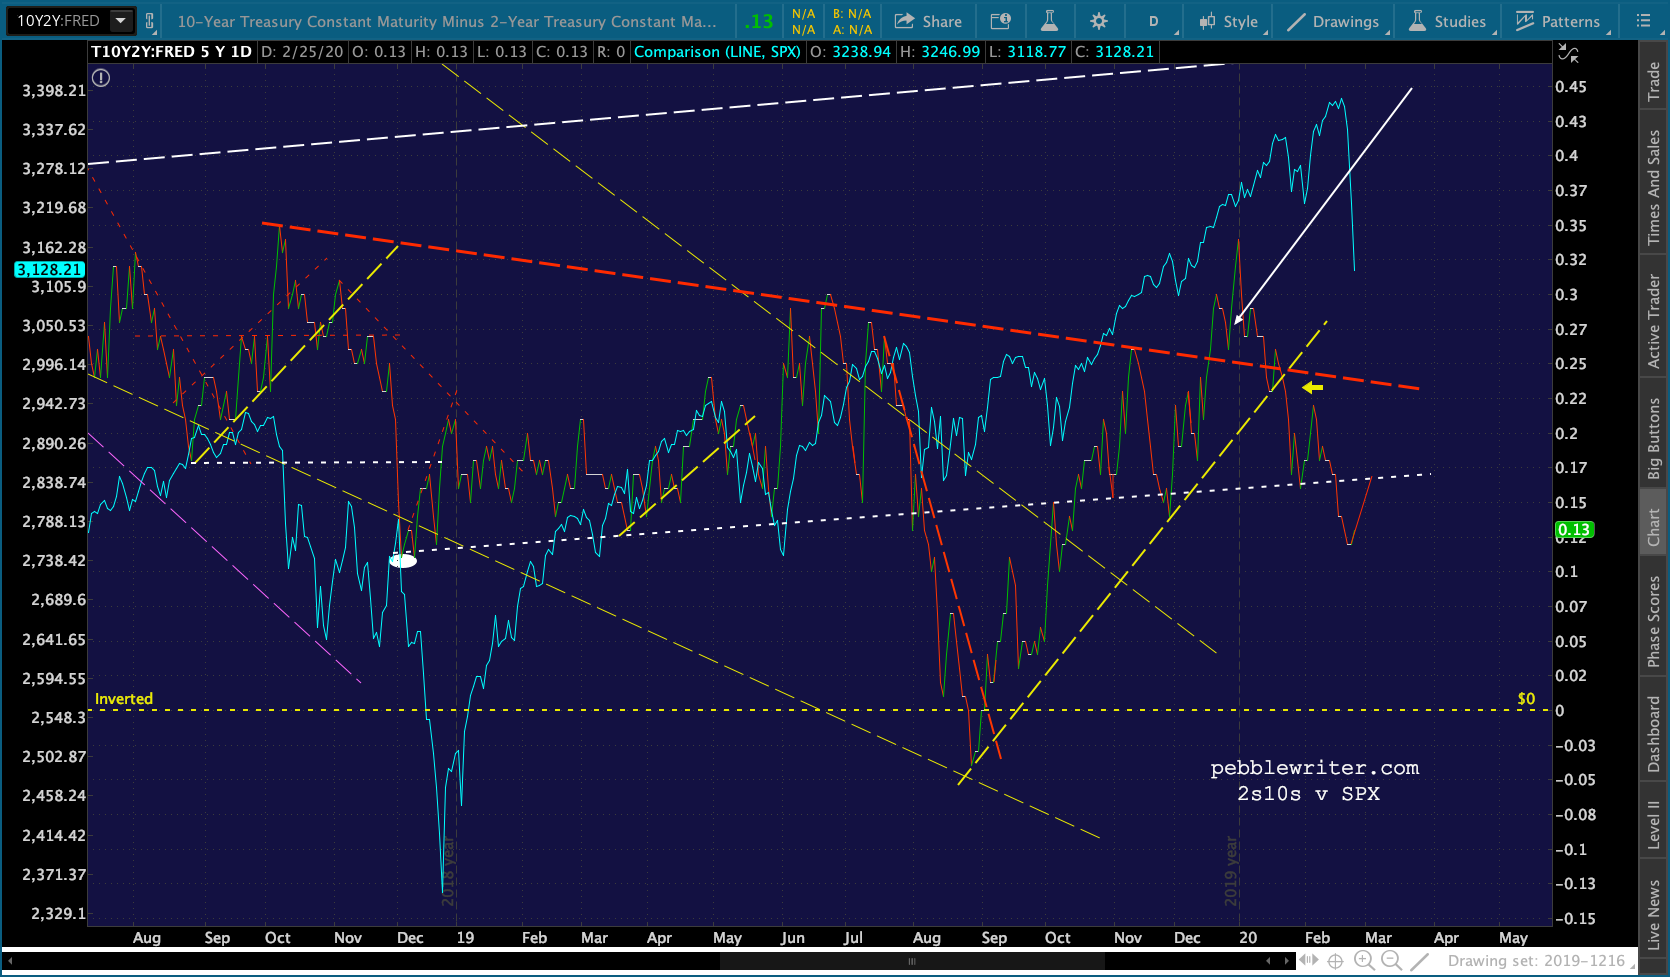 And, GC – while delayed by the white channel top – still has upside potential.
  There are signs that the worst is over. Like DJIA, RUT has reached important support.
 And, AAPL is testing the bottom of its rescued white channel and an RSI trend line (though not yet oversold.)
 We will have plenty of economic data to chew on over the next couple of days — much of it misleading due to the lag factor.
 In the meantime, anyone playing today’s bounce should be especially cautious. Additional downdrafts are fairly likely.
More later.
UPDATE: 2:45 PM
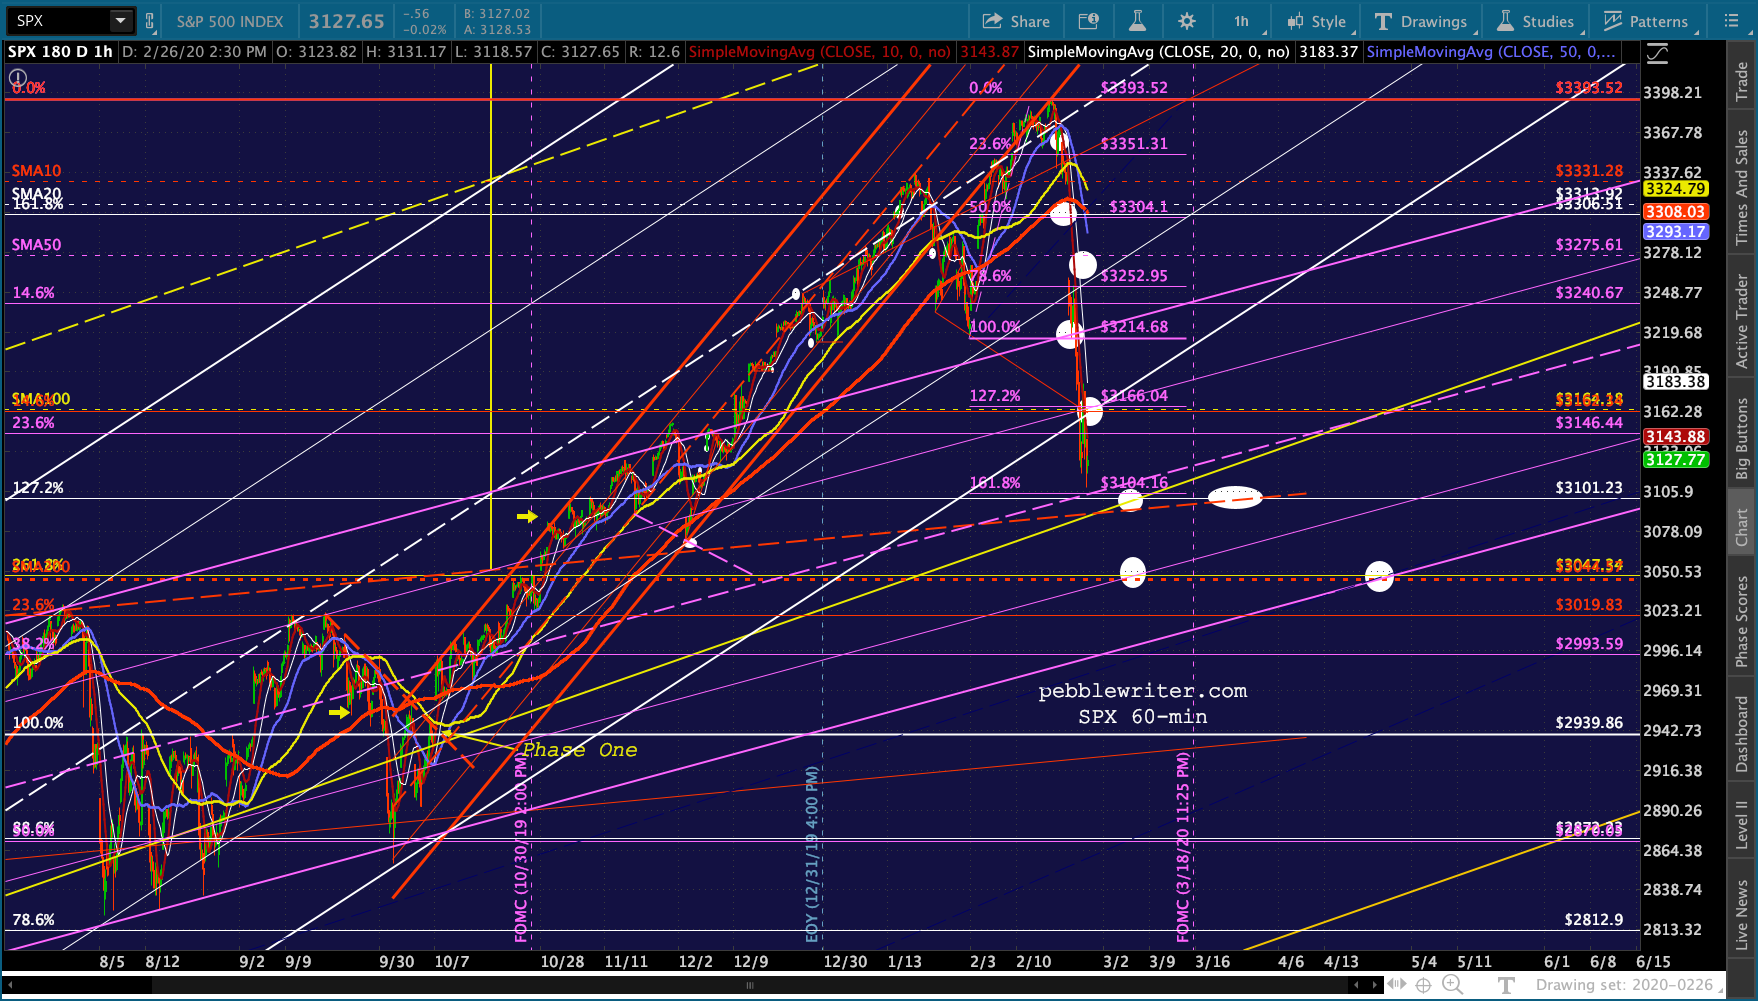
Back to a sea of red… Futures are most of the way back to yesterday’s lows, about 40 points from the 261.80 at 3076.93 – which would put SPX at 3084 – no man’s land. So, my hunch is we’ll see SPX tag 3047 and ES overshoot its 2.618. VIX, CL, USDJPY, RB and TNX are all cooperating.


 I have a 3:30 appointment, so won’t be able to watch it play out. I should get a chance to post around 5 or 6pm.
GLTA.
UPDATE: 8:00 PM
ES just got within a point of our 3076.93 target.  As discussed earlier, this leaves SPX 61 points short of its 2.618, so there’s still a possibility we’ll get a downdraft overnight which allows SPX to tag its 2.618 and SMA200 at 3045.75 tomorrow morning.
  CL still has some downside potential and rates are still sliding lower.
 BTW, in response to a good question from @docjayinok yesterday, the 30Y is at a logical bounce point. However, I believe that, like the 10Y, we will see rates continue to fall.
