

We posited yesterday that after over a year of constant bond market manipulation (the latest instance), TPTB had broken the link between lower interest rates and lower stock prices. It was a strong positive correlation that we wrote about quite some time ago in forecasting a stock market correction (that obviously never happened.)
 That correlation worked both ways insofar as rising interest rates were often (but, not always) a sign of a recovering economy and, hence, stock market rally. The correlation broke down altogether in early 2014 when interest rates fell, but stocks continued soaring.
We wondered whether it would, thus, be difficult to reestablish the correlation (or, at least the perception thereof) in the event that rates continue to rise (and, bond prices fall.) The past two weeks have suggested it might just be.
 Yesterday’s call to short SPX at 2121 worked out well, and — with the eminis currently off 10 points — our downside targets are looking better by the minute. Factors?
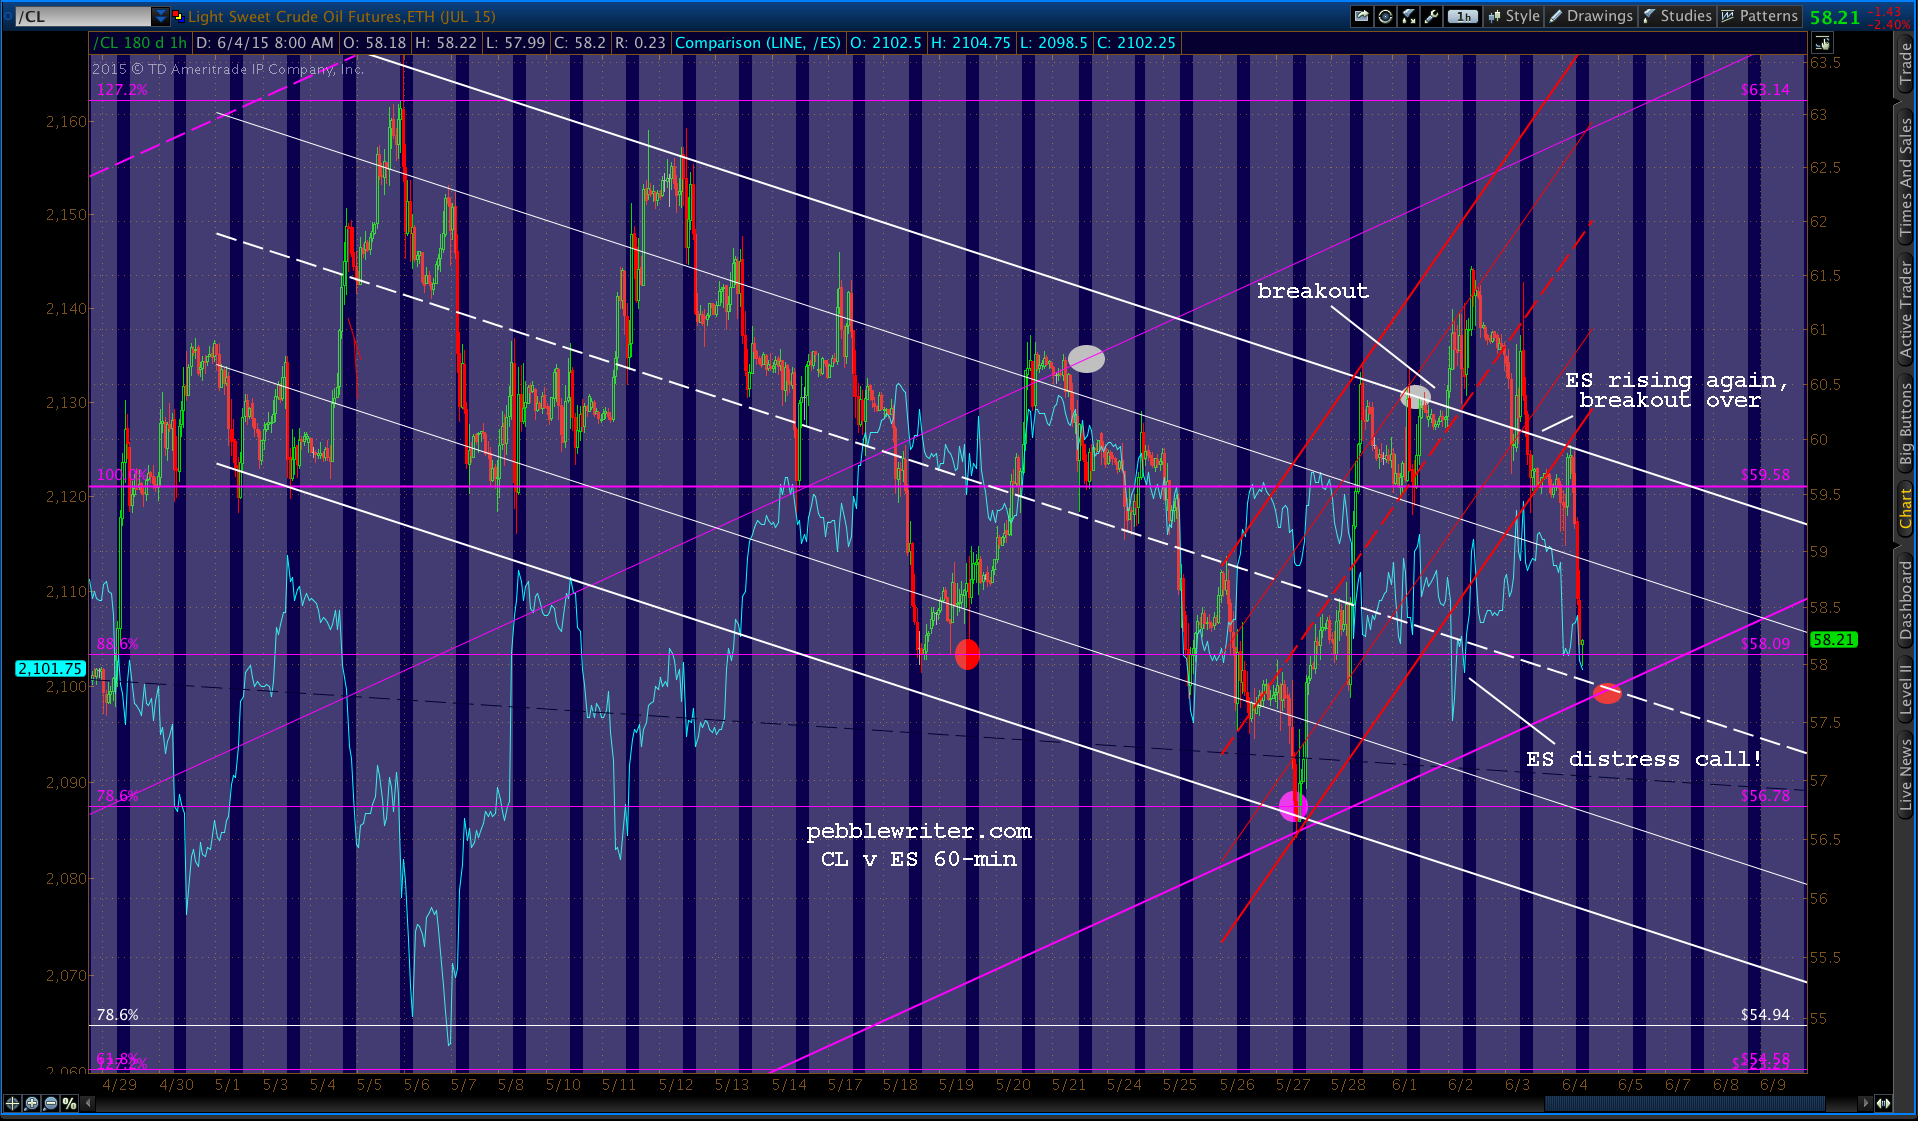
China broke down again — and, recovered again — overnight.  While, CL is again faltering. The rising wedge that became the rising red channel is now a broken channel, and CL is solidly back in the month-old falling white channel (though the rising purple channel bottom isn’t far below at 57.59ish.
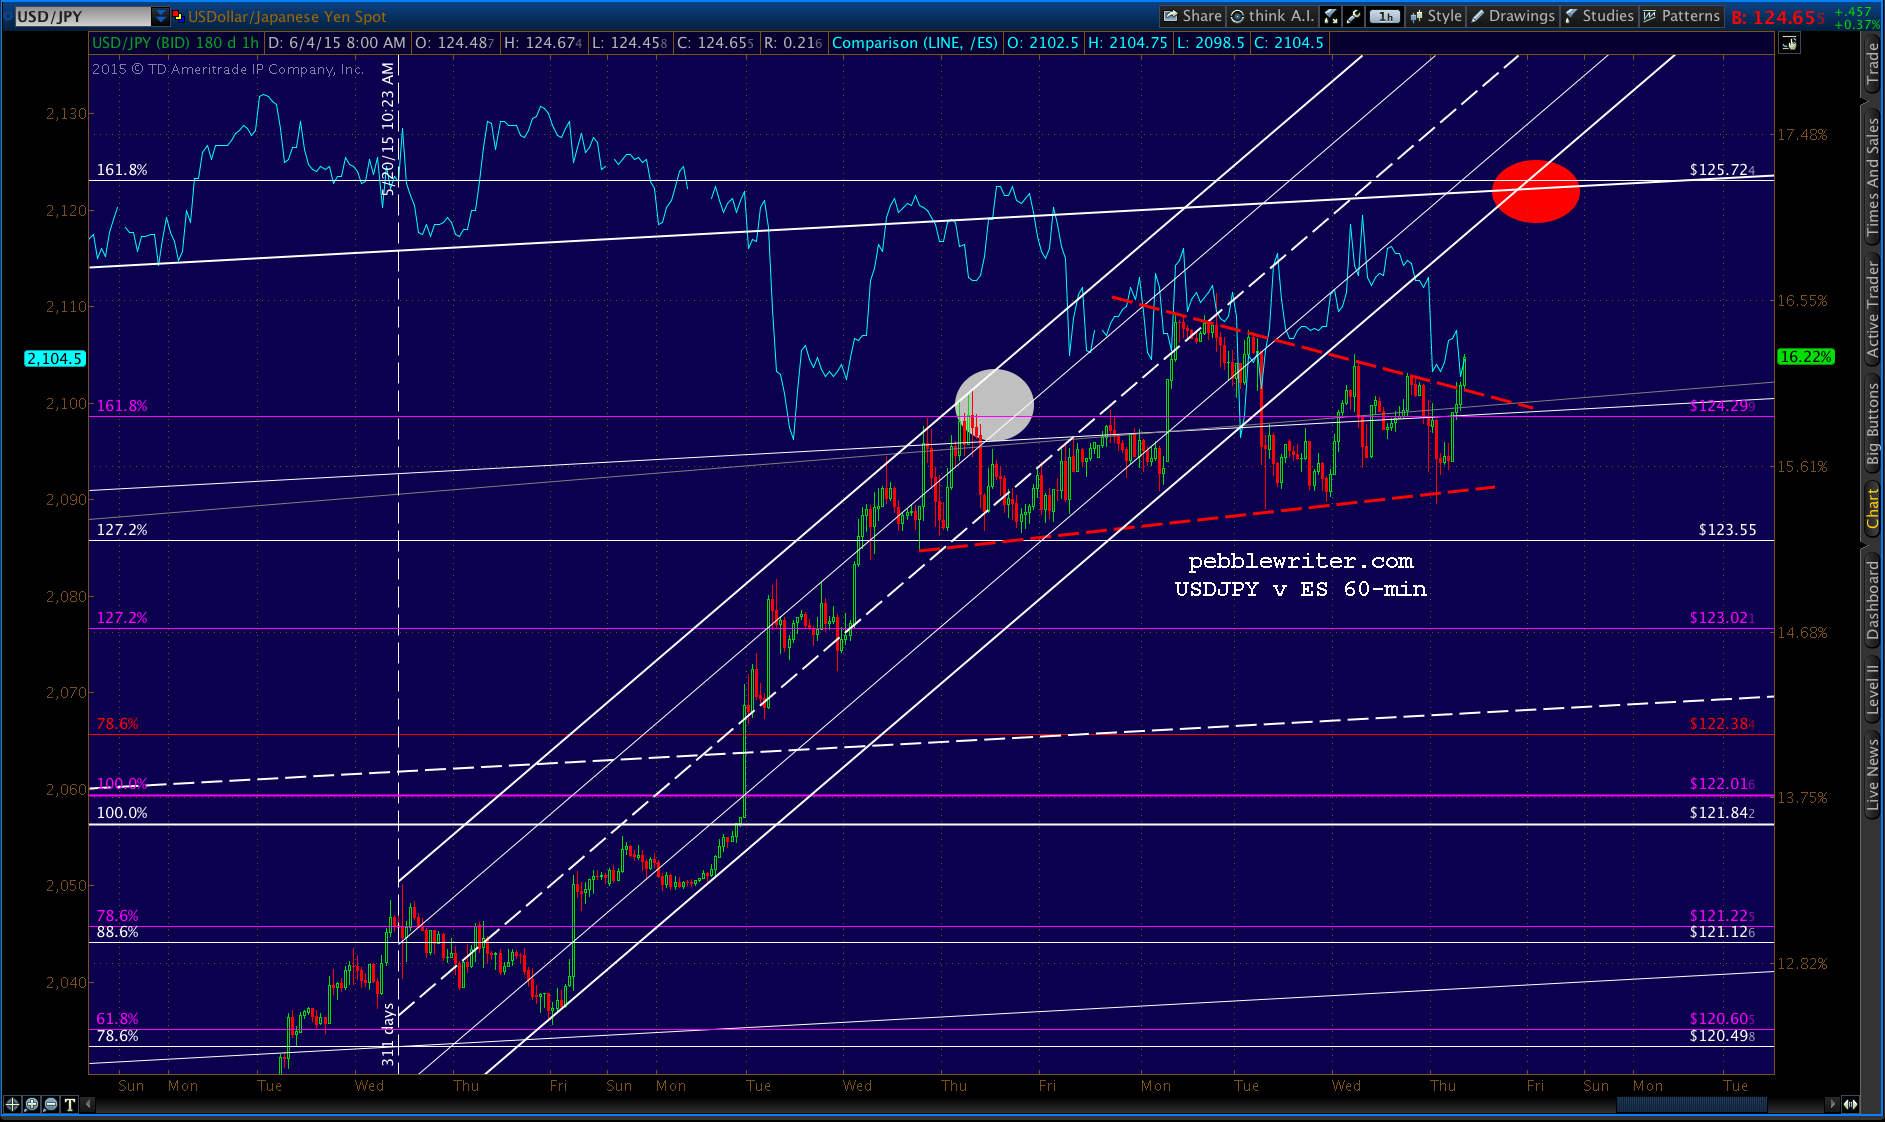
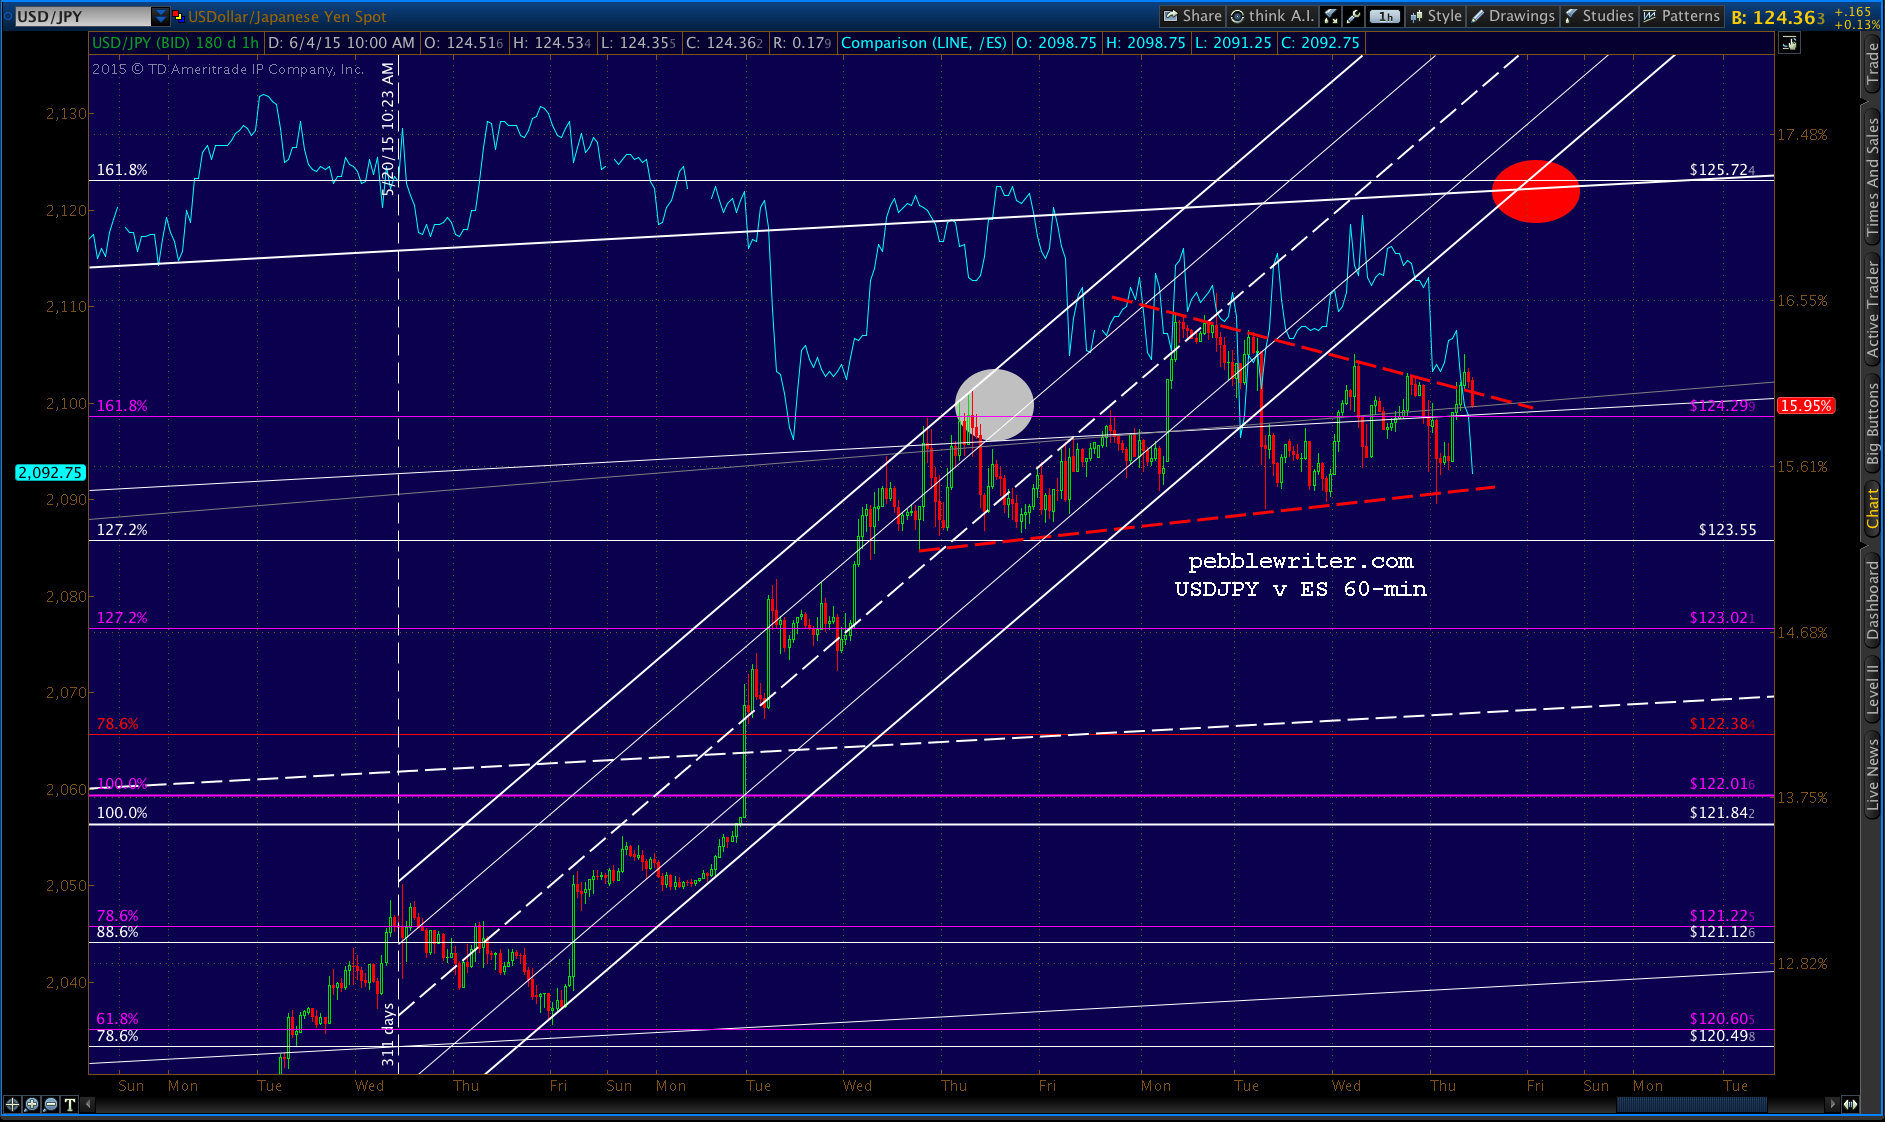
 The only question is whether USDJPY will get another stock-saving bounce off the red trend line (neckline?) that’s prevented a more serious sell-off over the past week.
 Updated SPX charts in a moment…
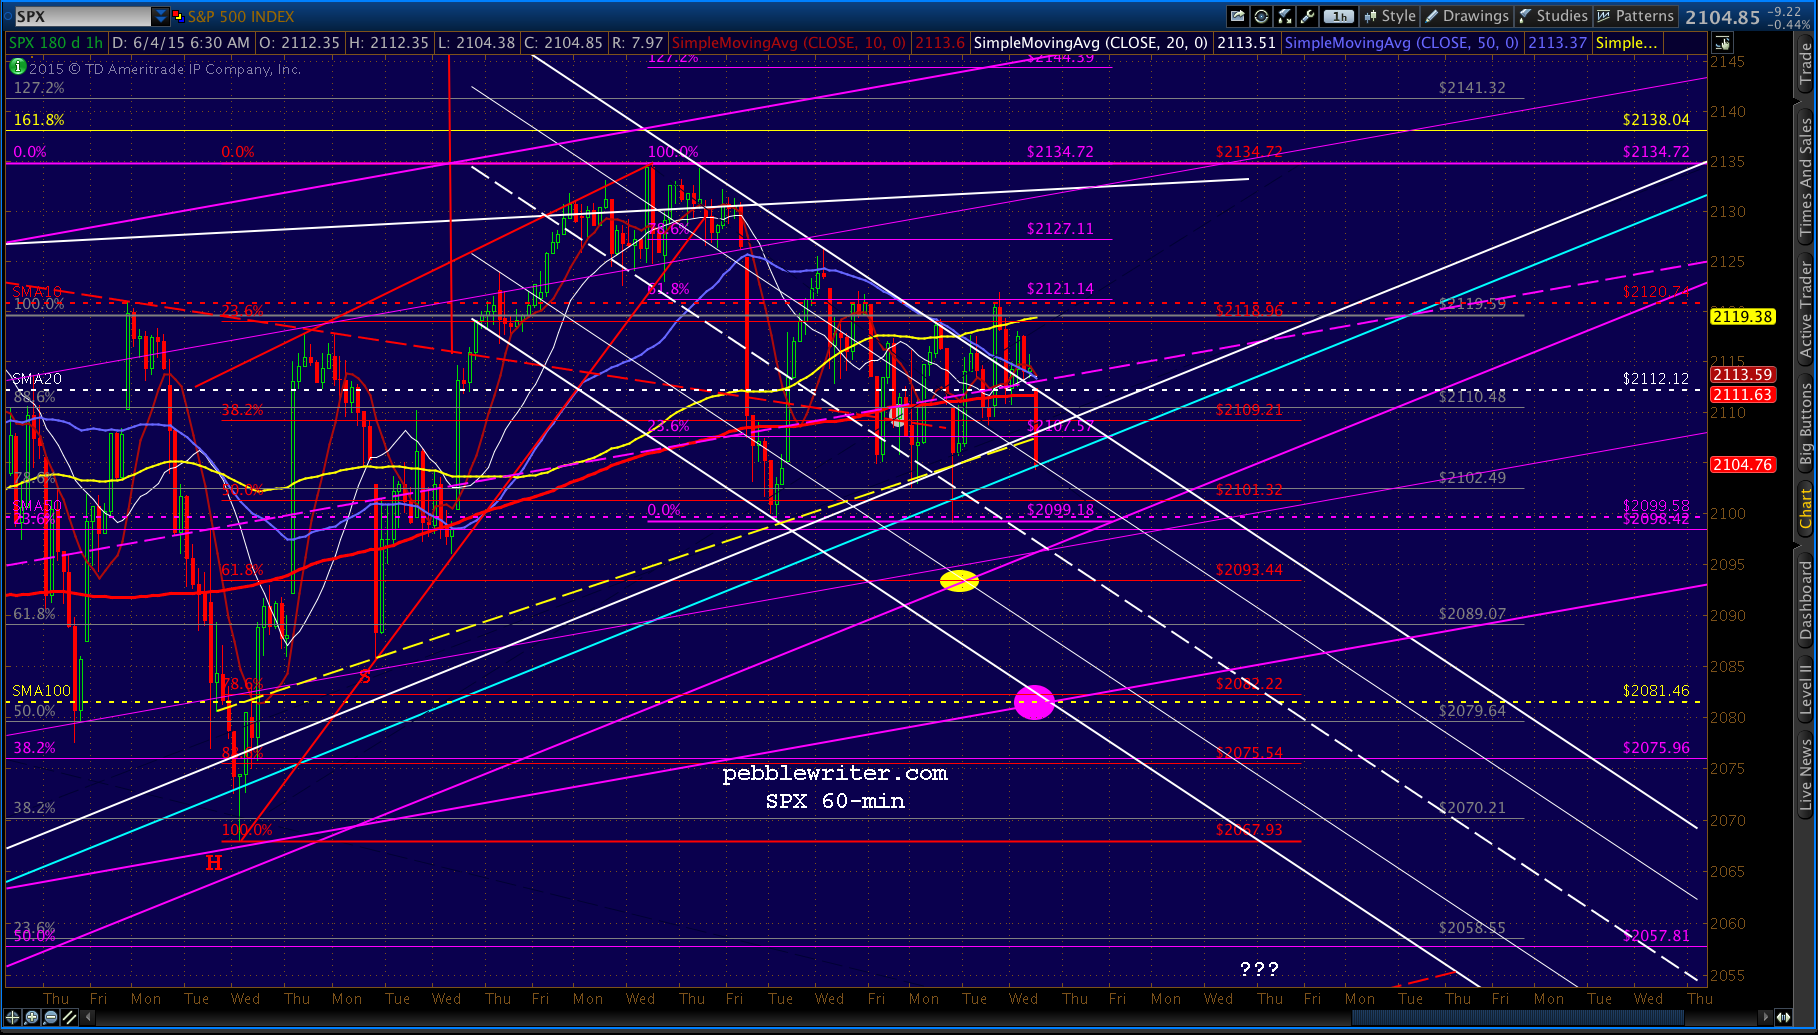
continued for members… For those who stuck with the downside call, SPX is making good progress. The biggest impediment is the rising white channel line at 2104ish. It marked a line in the sand Tuesday, and it could happen again today.
A drop to the .618 at 2093.44 would require a strong intra-day push; and, the .786 at 2082 outright capitulation by CL and/or USDJPY.
 CL is where the downside case could really fall apart. The falling white channel — which experienced a (failed) breakout on Monday in order to save stocks’ bacon — is running into the purple channel bottom today.
Since the 1.272 extension (63.14) was reached on May 6, CL saw a pullback to the .786. Today, after a nice bounce, it reached the .886. The purple channel bottom is around 57.59 or so, and would represent a .786 retrace of the bounce off 56.78 and a test of the falling white midline. A strong reversal here would put stocks back on an upward slope.
 If so, SPX should get the benefit of a rising CL as USDJPY — which just broke out of a triangle — settles back down. Will it backtest the broken white channel at the 1.618 (125.72)? Perhaps. Then, again, the best headfake would be a near miss in order to maintain a strong upside target for later.
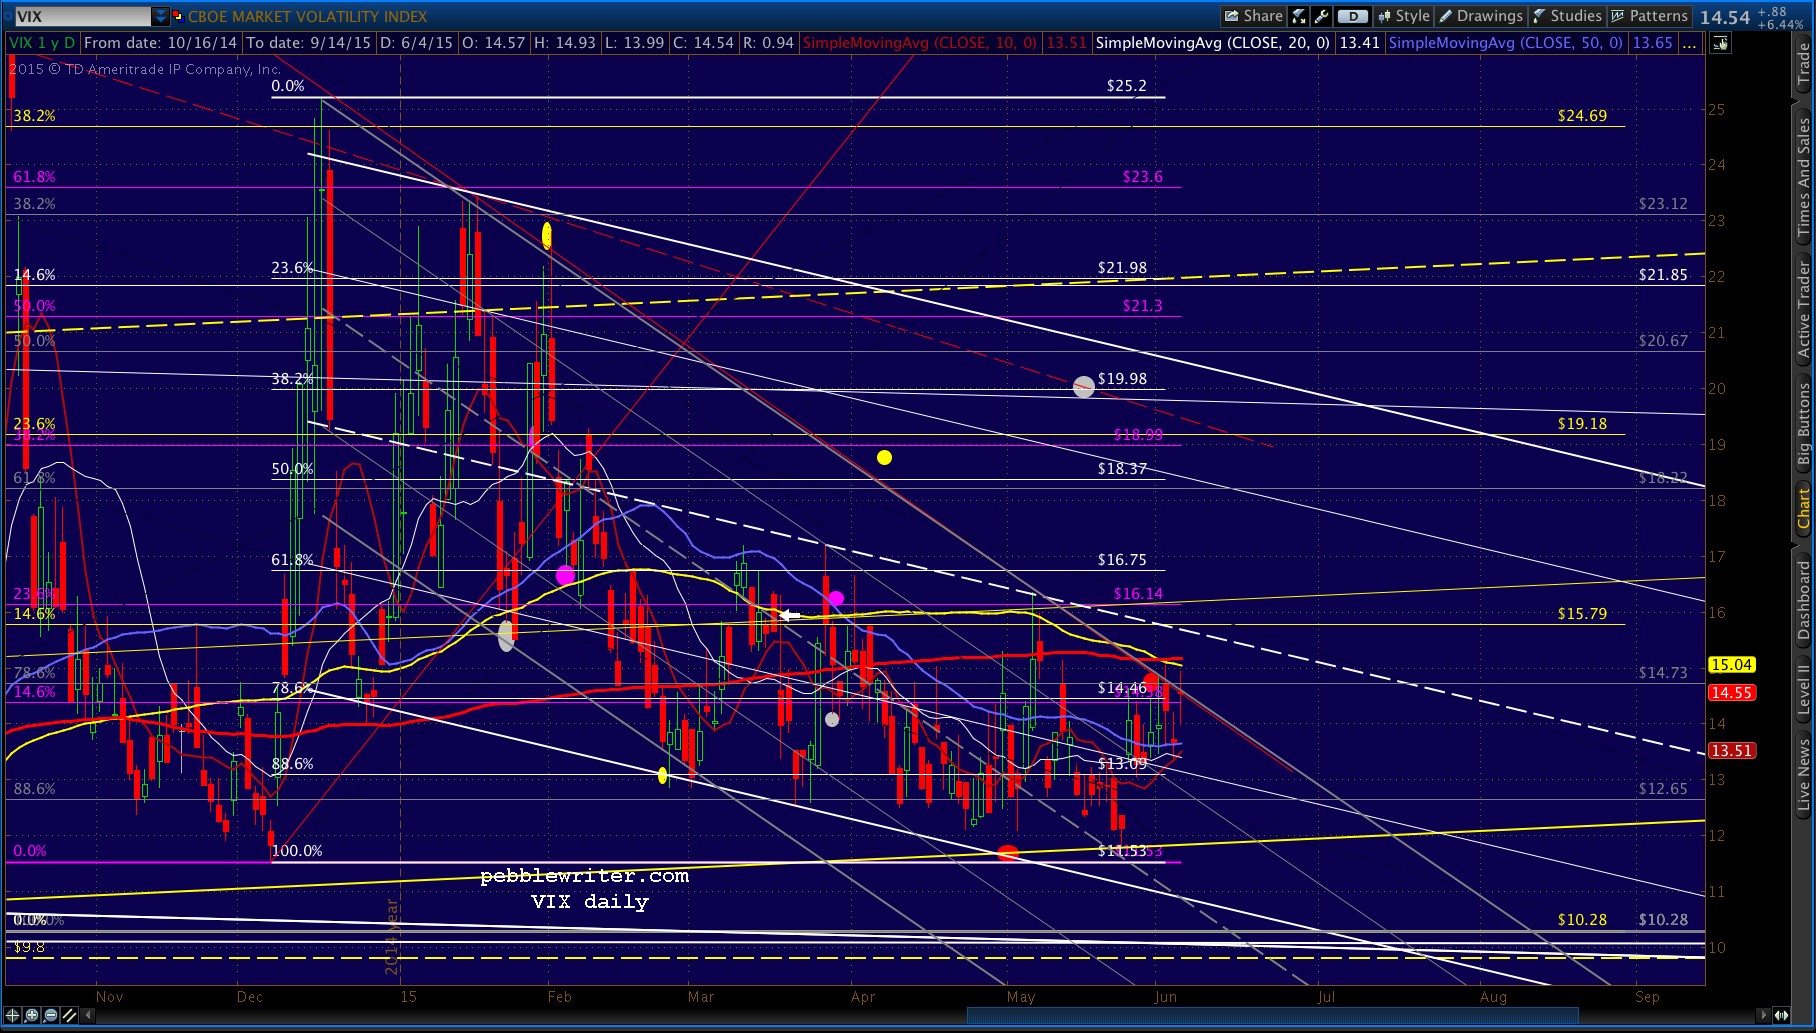
 VIX certainly seems to support a bounce here — though there’s room for a little more intra-day downside if USDJPY stops inching higher.
 UPDATE: 1:22 PM
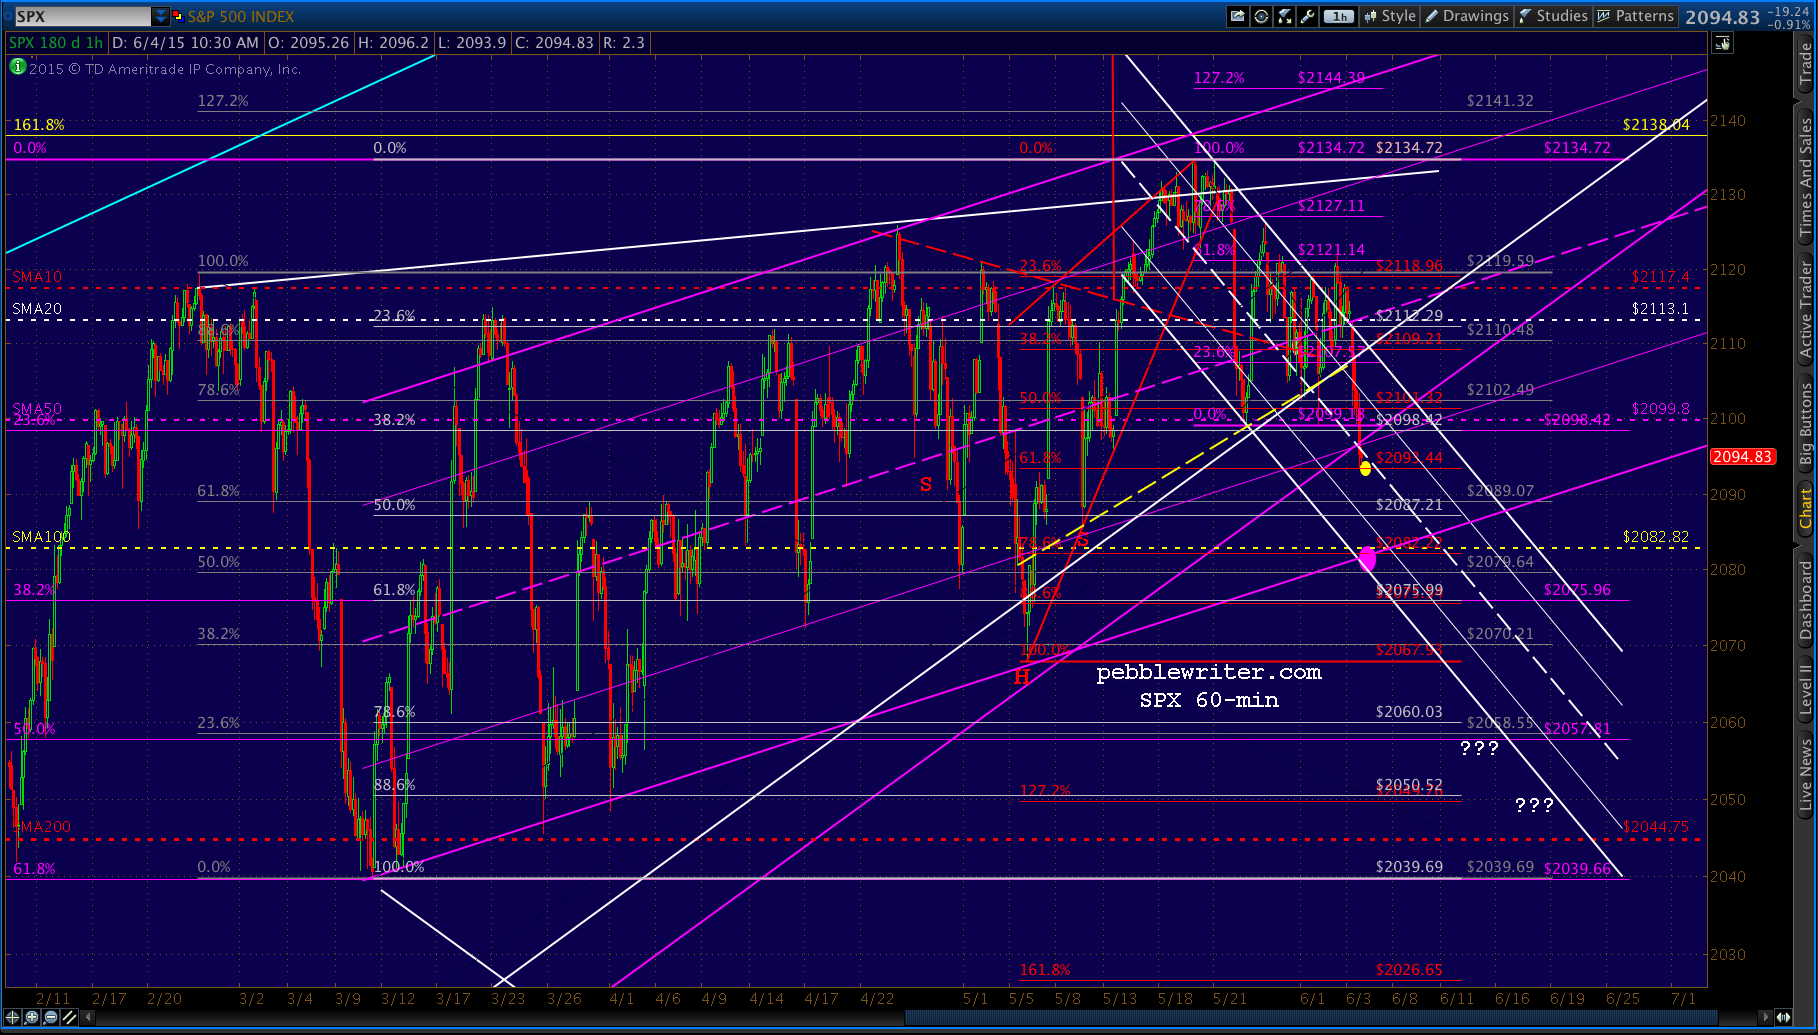
SPX just tagged the .618 at 2093.44 — our initial downside target first posted on May 26.
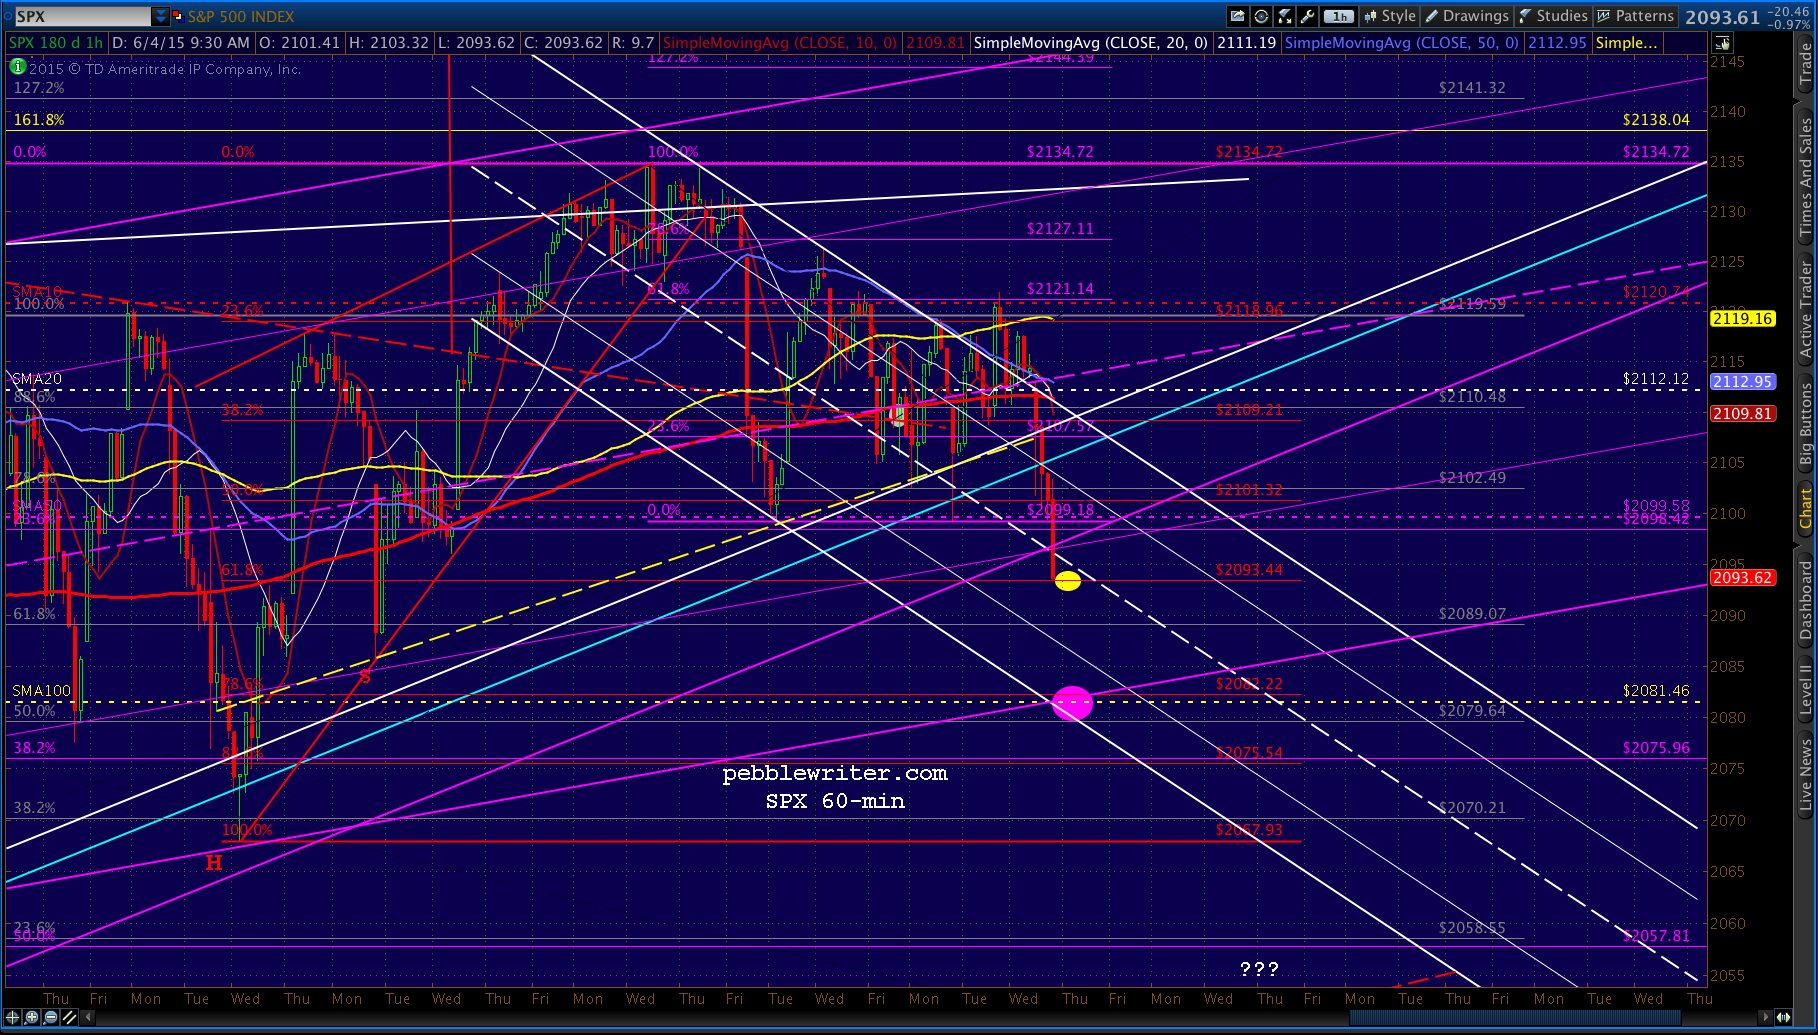 Since USDJPY has backtested the red triangle and CL has backtested the falling white channel midline, we’ll look for a substantial bounce here at 2093.59. If either of those two drivers of price break down (or, more accurately, fail to spike higher immediately) then the 2082 target starts to look pretty good.
I like it because it would mean another SMA100 tag, and at the .786 would set up the red 1.272 extension which coincides with the peach .886 at 2050.
Remember, we still have a H&S target down around 2058 — the ???’s we put there last week. The SMA200 is around 2044, but should reach 2050 in the next few days and 2058 next week.
 As I type this, USDJPY is dipping below the triangle upper bound. Hmmm…
 For those who are wondering about those possibilities, the white channel line is from the 2009 low drawn through the other obvious lows along the way, while the purple is drawn through the Oct 15 opening low (not including the tail.)
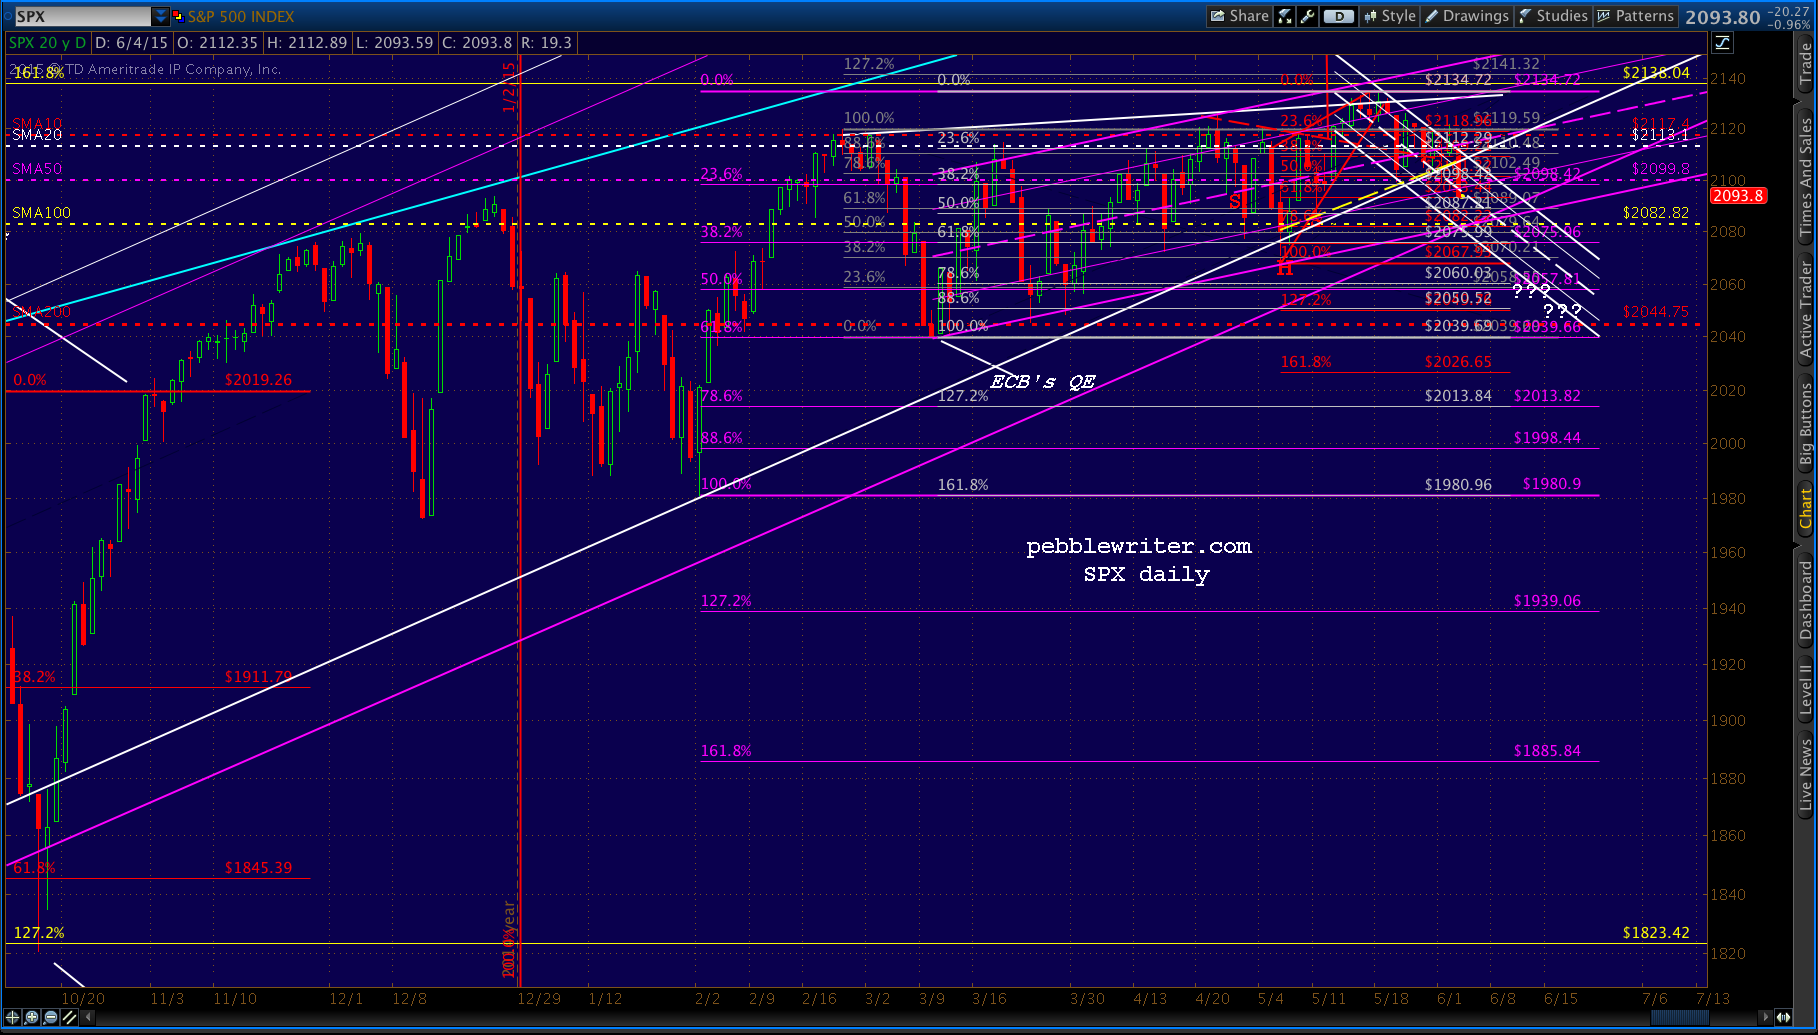 Obviously, we never had much of a retracement of the rise from October’s 1823. If we hit 2060, for instance, it would amount to a whopping 23.6% retracement! For scale purposes, a .618 retracement would take SPX all the way to 1940 — which is almost exactly the 1.272 extension of the rise from 1980.
Would TPTB allow such a plunge (which would clearly signal that either of those two channels is broken)? No reason to think they would. But, that’s probably your best black swan event right there: 1940 (-7.4%), followed by 1885 (-10%.)