

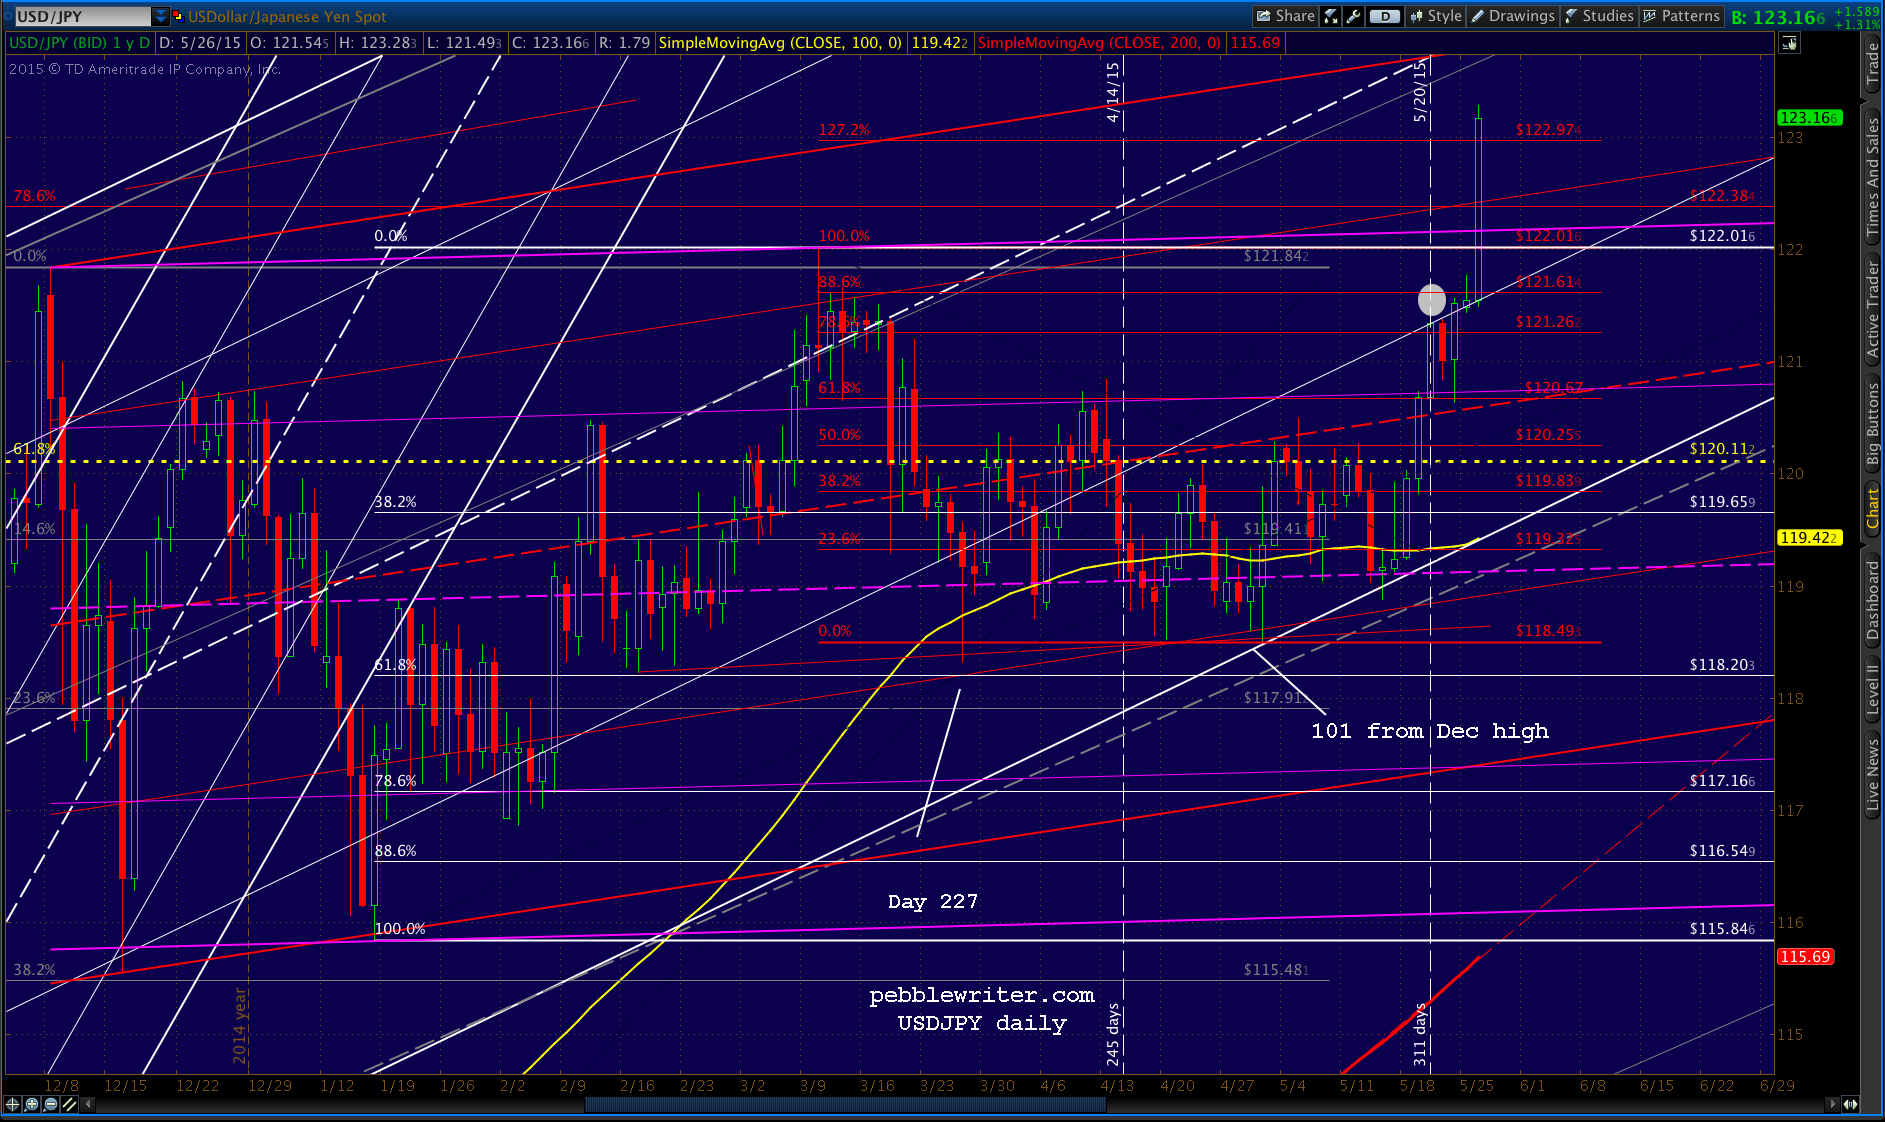
After surprising durable goods and Case-Shiller reports, the futures are currently off 6 points — but, only after massive yen bludgeoning in the FX markets in an attempt to blunt the effect of the recently completed Butterfly Pattern we discussed last week (and, yes, I’d call 3.32 points away from the 2138.04 target close enough — after 1,470 points.)
USDJPY is current up over 1.3% — the biggest ramp job in over three months.
 It was enough to send the dollar back into the broken channel.
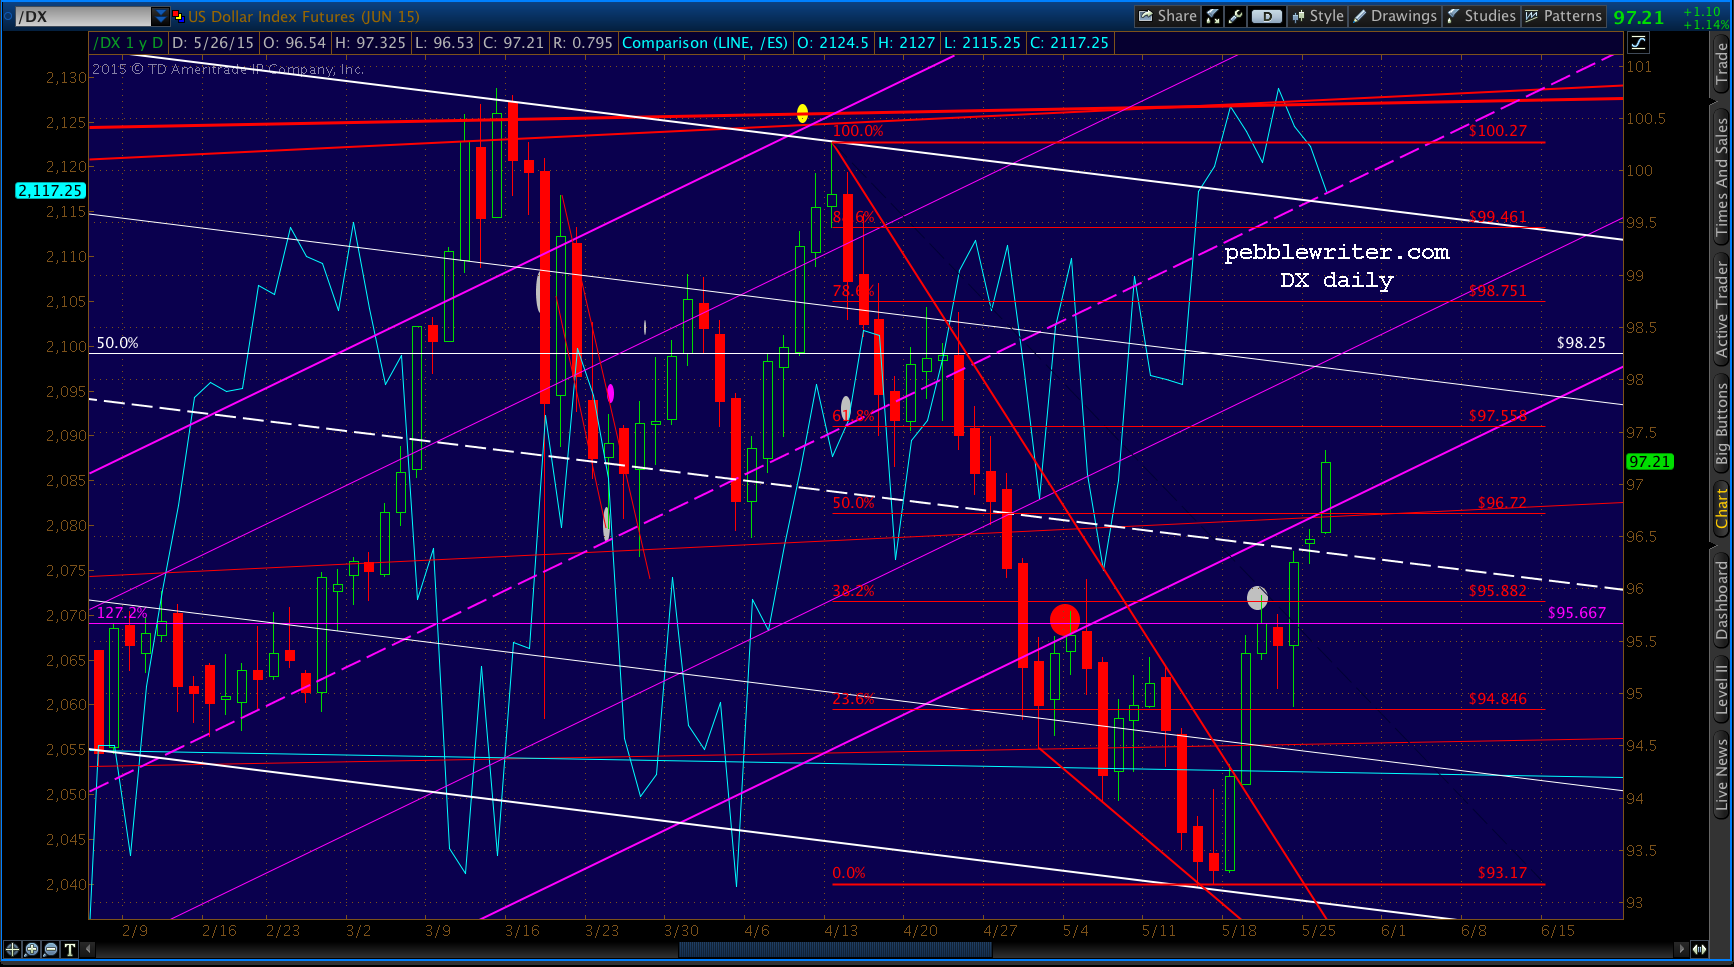 Obviously, this delays/derails the rebound that was in store for CL. It has nearly retraced .886 of its rise from May 19 in a pretty well-formed Bat Pattern.
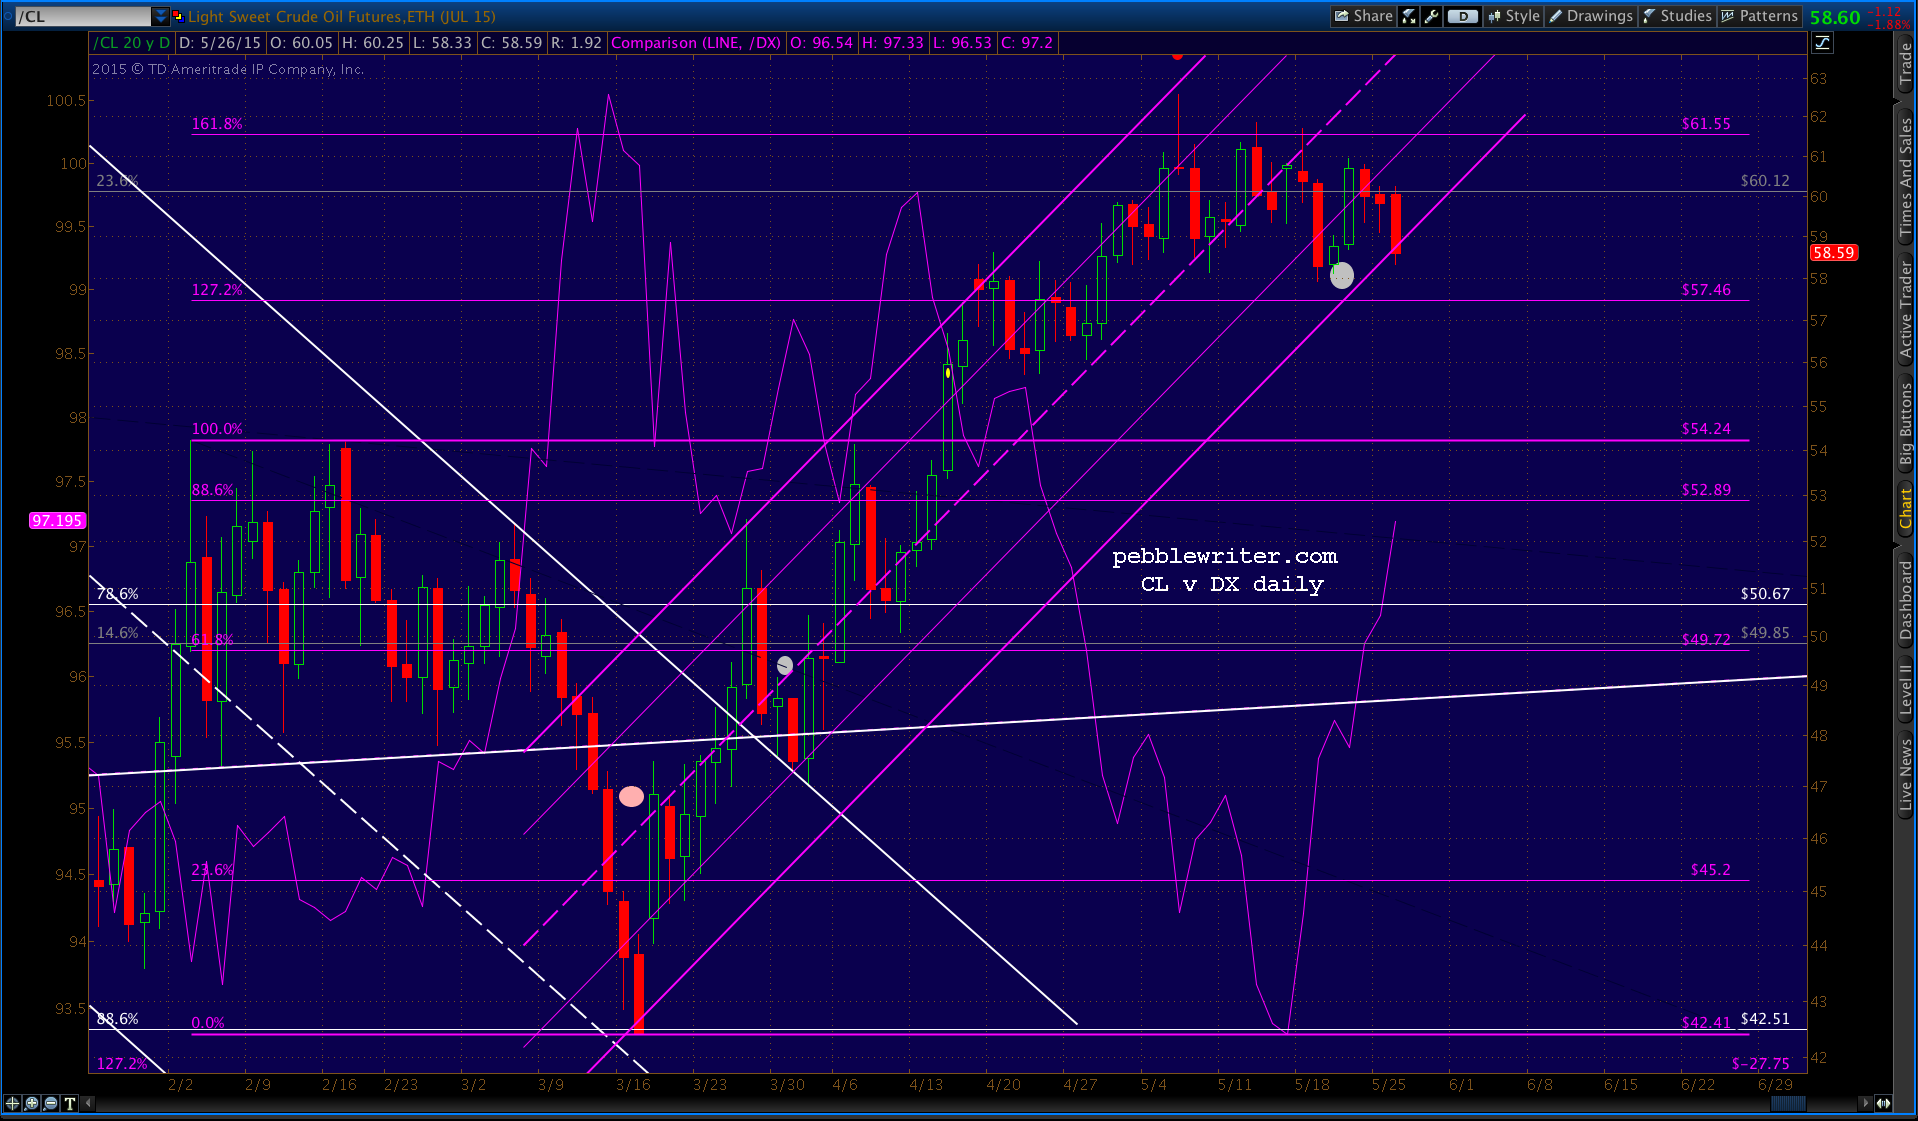
Look for SPX to at least backtest the neckline of the recently completed IH&S at the SMA20 — around 2109.95.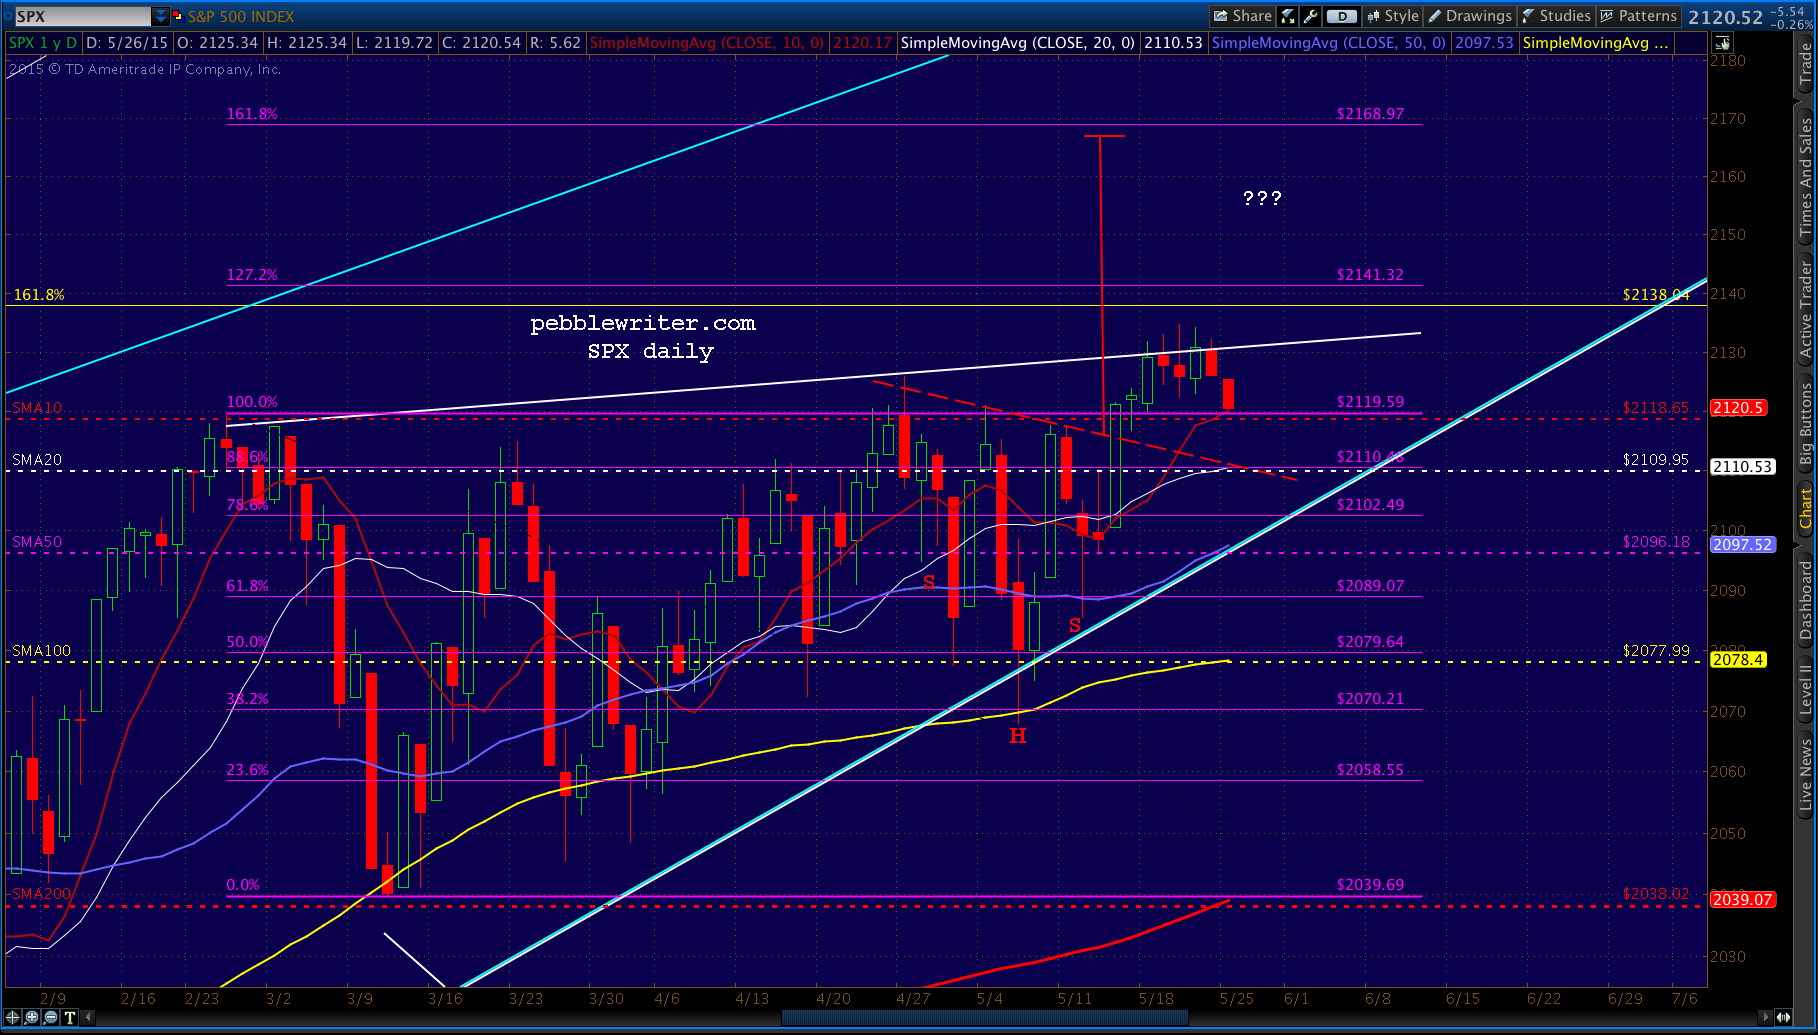 Note that EURUSD might just have completed a normal bounce on the rising purple channel — tagging the .236 line after a reversal at the .786 line. This ping-ponging (two steps forward, one step back) is the way that prices are supposed to move from the bottom to the top of a channel.
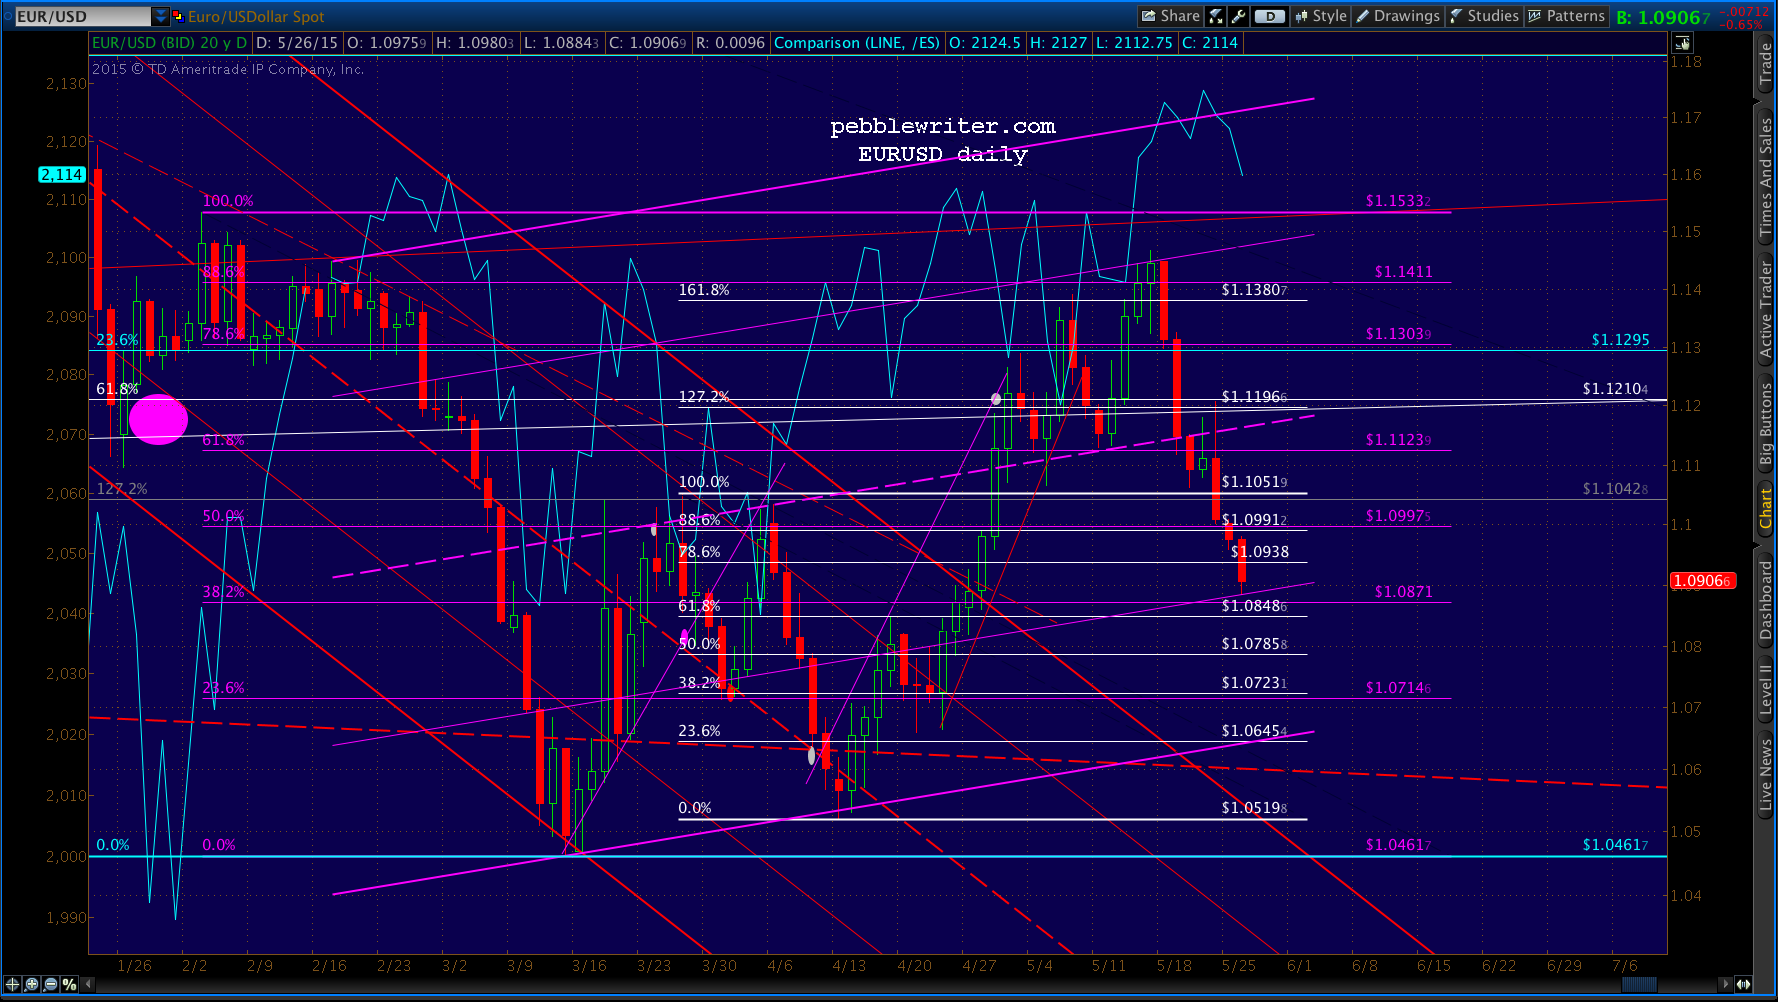 EURUSD’s channel action has been sloppy, to say the least. But, a reversal here would help DX come back down to earth without involving a substantial, newless breakout in USDJPY if, in fact, TPTB should want to bother disguising it. A drop below 1.0848 would likely accelerate SPX’s sell-off.
All things considered, the completion of a 1,472 Butterfly Pattern should produce a strong reversal — not a 15-20 point reversal, but hundreds of points. The nearest lower Fib, remember, is the 1.272 at 1823.
It’ll be very interesting to see whether TPTB can arrest this decline without a major BOJ or FOMC announcement of some kind in the next day or two. Given the apparent strength conveyed by the economic reports, the Fed is definitely in a bind.
UPDATE: 9:56 AM
SPX has almost reached the 2109.95 target mentioned above. If it doesn’t hold, look for a test of the rising wedge bottom where it intersects the SMA50 at 2097ish. Note that it could go as low as a .618 retrace (2093.44 – from the May 6 low of 2067) without breaking below the bottom of the rising wedge.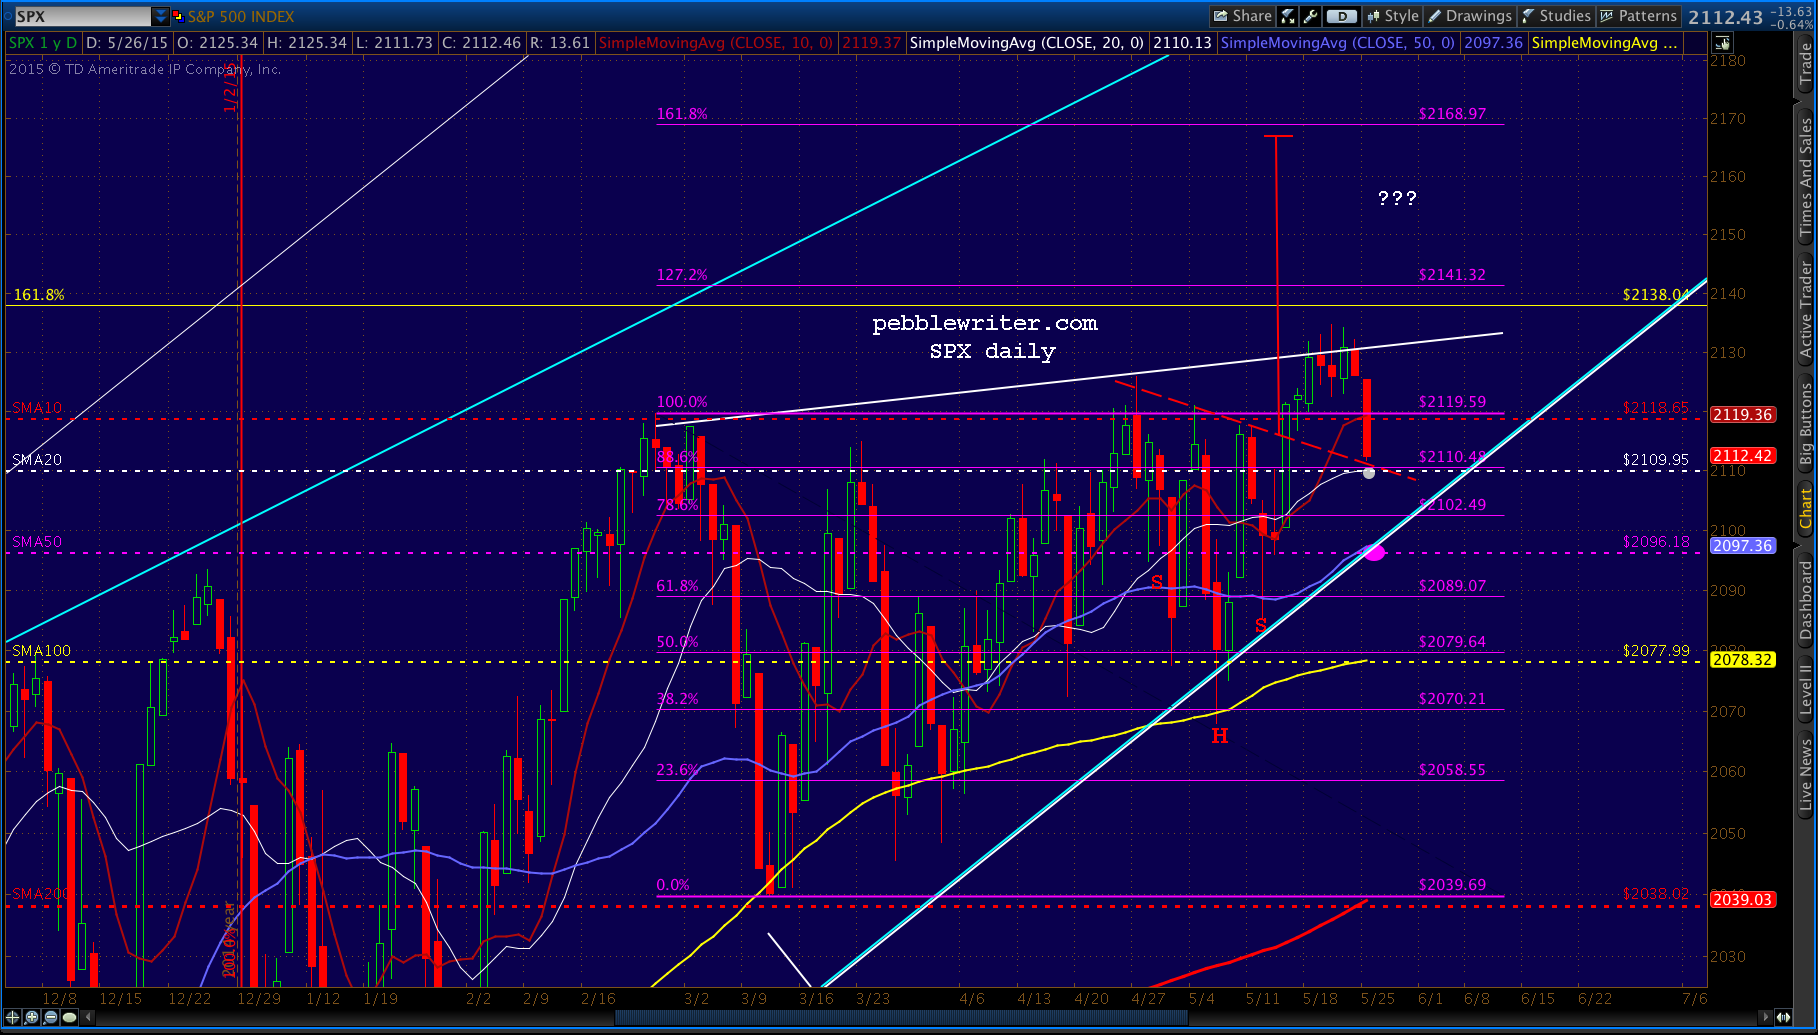 UPDATE: 1:00 PM
Coming up on our secondary target, with notable other developments: CL broke below last week’s lows — purple channel in danger of being broken — and USDJPY is backing off from its highs as DX completes .618 retrace from its Apr highs.
Needless to say, if SPX isn’t propped up at 2093-2097, the downside is much larger. First target is the SMA100 at 2077ish. After that, the best target is the long-awaited (and frequently averted) SMA200, which has now reached the .618 retrace of Feb’s lows at 2039.
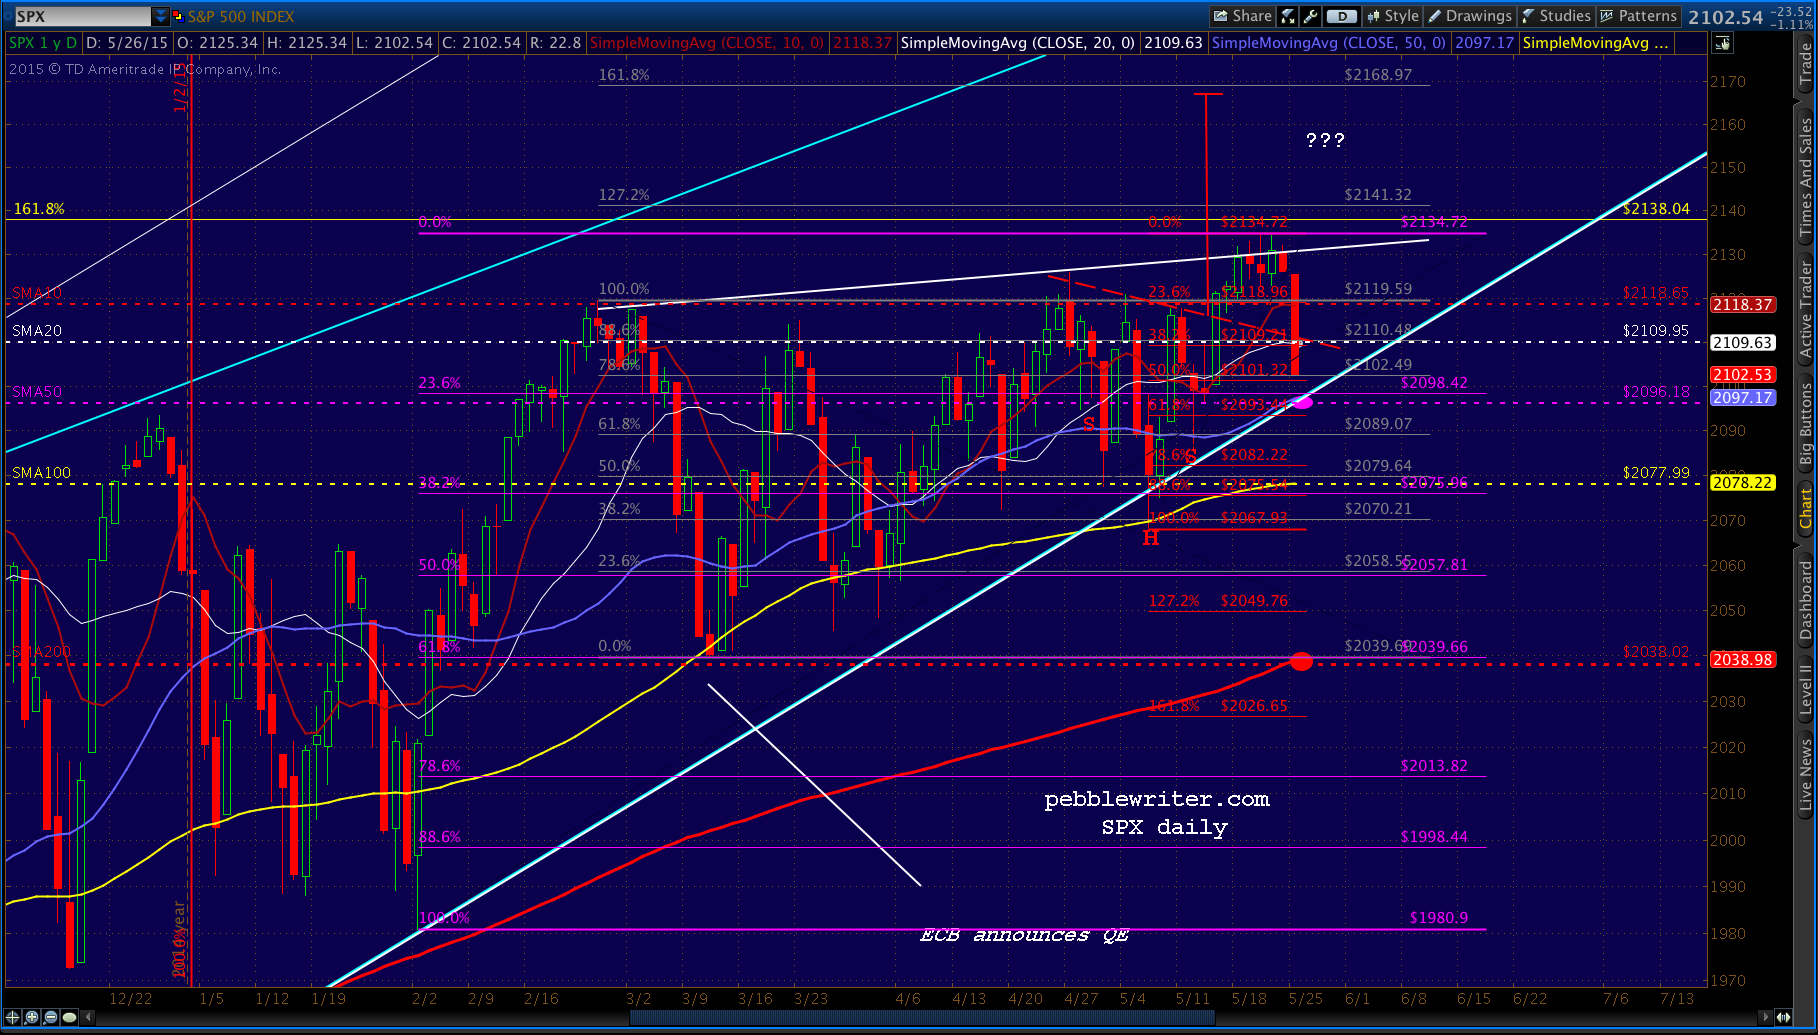
Remember, we talked about this in the analog update on May 19:
Likewise, 2038 is the new 2033 (.618 retrace of the rise from 1980) and the SMA200 is due to intersect it next week.