Author: pebblewriter

  • Look No Further

    If you’re looking for a reason for ES’ 12-pt rally off yesterday’s lows, look no further than the usual VIX dump and oil ramp.  Within a few minutes of each other, oil recovered above its SMA200 and VIX reversed off what was a promising (for bears) rally.Consequently, ES and SPX recovered back above their SMA10/20s just as the cross went negative.  Funny how that seems to happen over and over again.

    The key question: can oil’s ramp continue, now that the UK’s inflation data (+2.3% YoY) has joined the US in exposing the problem with $50 oil?

    continued for members(more…)

  • Is It Time?

    One glance at the eminis chart tells you all you need to know about the past month.  Head & Shoulders Patterns used to be pretty reliable.  This one indicated a 50-pt drop last week — a whopping 2 1/2% sell off.  But, it was not allowed to happen.  

    Now, it’s the day after OPEX and quad-witching, which means there’s at least the possibility of things letting loose.

    continued for members(more…)

  • Happy Quad-Witching St. Patrick’s Day

    If you liked yesterday, you’ll probably love today.  We’ve got it all: VIX being slammed down below the long-term channel bottom (for the 17th time in 10 weeks), WTI being ramped up past resistance, USDJPY that can’t hold a simple channel bottom.

    The sheer determination to keep prices in the green is, no doubt, a nod to St. Paddy himself.

    continued for members(more…)

  • Yellen’s Insurance Policy

    As Fed chair, you can hope that your message will be well received — even if it seems a little nonsensical.  I imagine these thoughts were foremost in Janet Yellen’s mind yesterday as she took the microphone.

    If, however, you’re peddling the snake oil that the timing is right for a rate hike (with 0.9% GDPNow) and that inflation isn’t yet a problem (even though it’s quadrupled in the last four months), then you’ll be very glad to have a friend in Chicago working the VIX button — your insurance policy.

    Even as Yellen’s most non-sensical answer landed like a thud amongst the friendly crowd of “journalists” VIX was in the midst of a 15% plunge.  It was enough to keep stocks on the rise and from performing a basic backtest, the type of which has been commonplace before central bankers took control of the “markets.”

    continued for members(more…)

  • Happy 5th Birthday!

    Pebblewriter was officially born on May 2, 2011, but we started tracking performance and offering subscriptions on the new site on March 23, 2012

    Two thousand posts and 2.8 million page views later, we’re coming up on our 5th birthday.  Since we haven’t run any membership promotions in months, it’s time to do something special!

    Now through March 26, we’re offering a $25 rebate on monthly subscriptions and a $75 rebate on quarterly subscriptions. 

    For the next five folks to contact me, we’re offering an annual membership for the ridiculously low price of $600.


    CLICK HERE to SIGN UP NOW


  • FOMC Day: Mar 15, 2017

    On Feb 6 [see: The End Game] we were looking for CPI to reach 2.5% for January.   Going out on a limb (a 13.3% probability at the time) I also suggested that this report would prompt a FOMC rate increase.

    The January CPI numbers coming out on Feb 15, even if massaged extensively, are likely to show a pickup in inflation – which had already tripled (from 0.7% to 2.1%) in the past two years in last month’s report.  My guess is at least 2.5%.

    I think the… likely scenario is to raise rates in March (I know, I’m very much in the minority here — what else is new?) and let the dollar — and, thus the USDJPY — continue to appreciate while forcing a mini-crash in oil and gas.

    As it turned out, CPI came in at 2.5% and included a massive 0.6% increase from December.  The culprit, as expected, energy prices.  Our thesis was, and remains, that rising energy prices — particularly gasoline — would unnerve the FOMC and other central banks who rely on “too-low” inflation to justify the most accommodative monetary policy in history a full eight years after the Great Financial Crisis.

    We further reasoned that, with the February YoY inflation in gas prices being higher than the January one, The Feb CPI numbers would put even more pressure on central bankers and would result in even more pressure on oil/gas prices.  Two days ago [Whistling Past the Graveyard] I called for Feb CPI to come in at 2.7% or better based, largely, on back of the envelope calculations on gas prices.

    As it turned out, 2.7% is exactly what we got.  The only problem is, it is accompanied by a decline in the Atlanta Fed’s GDPNow estimate for Q1 to 0.9% — not exactly a bullish situation.

    From the EIA — the government agency tasked with tracking such things, we can see the average price of gas rose 32.5% between Feb 2016 and Feb 2017. It was a sharp increase from January’s 24% YoY increase.

    February’s 2.7% CPI estimate looked like a very conservative bet unless other factors besides oil/gas offset their contribution.

    The BLS just reported 2.7% YoY inflation for February.  It included a 1% decline in energy prices MoM, but a whopping 30.7% increase in gasoline prices YoY (versus a 20.3% increase reported in January.)

    WTI is down almost 15% from its Jan 3 peak; so, oil’s mini-crash is well under way.  Is there more to come?  And, with CPI back to levels last seen in Feb 2012, what will this mean for FOMC policy?

    continued for members(more…)

  • Winter’s Coming

    Today was supposed to be a quiet day, what with the blizzard and impending FOMC decision.  Instead, we’re getting just a taste of the sort of unraveling that TPTB are deathly afraid of.

    PPI came in hot, as we’ve been expecting, and oil is well on its way to our next downside target.

    continued for members(more…)

  • Whistling Past the Graveyard

    Only a couple of years ago, central bankers became adept at repairing the damage done to stocks after big shocks.  That changed with Brexit, when the strategy shifted to pushing stocks as high as possible before the damage was done… and, still doing all the requisite ramping after the fact.

    They perfected the technique after the US election, turning a 5% overnight dump in the futures to a breakout above important resistance — where stocks remain, today.

    It made a bold statement — that the market was resilient enough to weather a sea change in the political landscape.  This week should be all about proving how resilient it is in a rising interest rate environment.  Judging from the mild drop over the past week, investors are quite unconcerned.

    Does this make sense, or are investors whistling past the graveyard?

    continued for members(more…)

  • One Way or Another

    After allowing a six-session slump (that saw SPX nail our downside target), The Powers That Be can be forgiven for insisting on an overnight ramp job.Last night, it was USDJPY pushing through horizontal resistance, VIX getting clobbered through three separate moving averages, and oil continuing a nice bounce off our 48.63 target.  It should be enough to get SPX up over its SMA10 on the opening bell.

    Since the bounce is mostly about oil’s “recovery,” we’ll focus today on what to expect over the next few weeks.

    Oh, and for those of you who clicked on this post expecting to get their Debbie Harry fix, HERE YOU GO.

    continued for members(more…)

  • A Changing of the Guard

    Regular readers know that I’ve been beating the carry trade drum for years.  From 2011 to 2015, it was the yen carry trade driven by the plunging yen (rising USDJPY) that was largely responsible for stocks gains.  I wrote about this most recently (Feb 22) in our latest post on the Big Picture. 
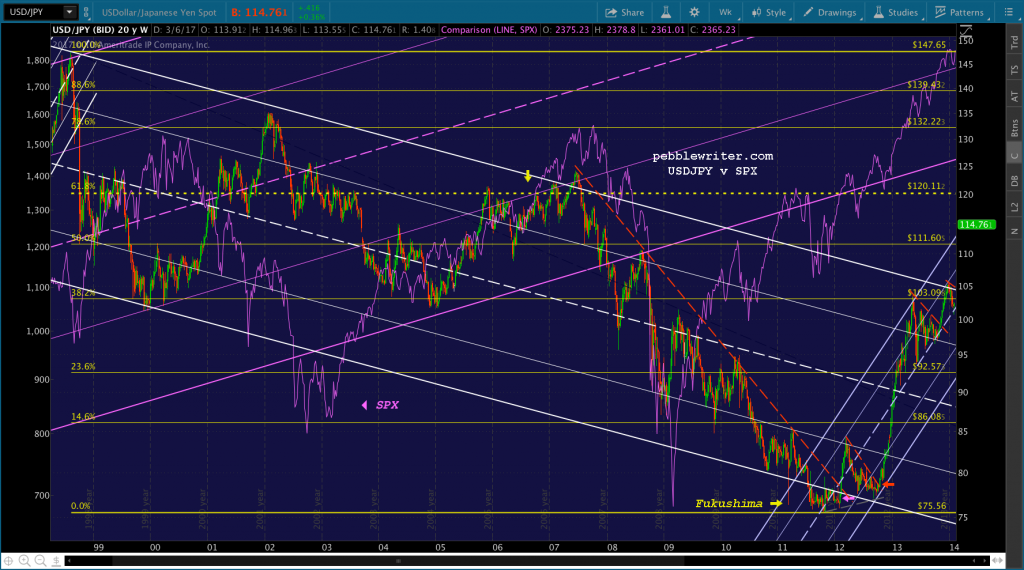
At the end of 2013, stocks were in limbo when USDJPY ran into serious technical resistance — the top of a falling channel from 1998.  Japan also faced fundamental problems because oil, priced in USD and topping $110/barrel, was causing rather inconvenient inflation (remember, Japan’s nukes were taken offline following Fukushima.)

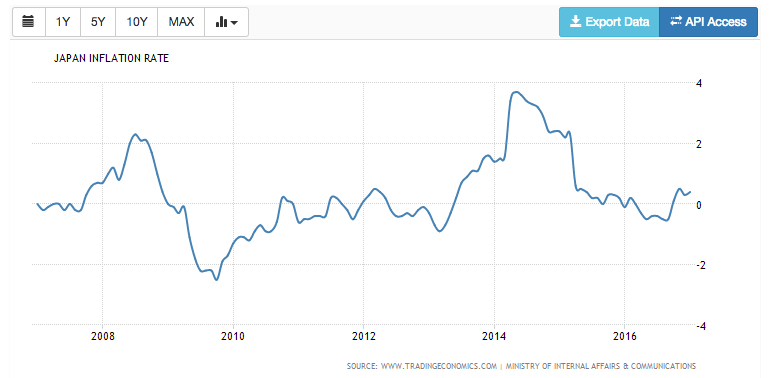
    It’s tough to justify historic accommodative measures in the midst of nearly 4% inflation.  But, the BoJ, very much stuck in an equity trap, dared not change course. Withdrawing QQE was not an option.

    Stuck between an inflationary rock and a market crash hard place, USDJPY spent eight months going sideways — coiling, but never breaking down — until it finally broke out of the falling channel on Aug 20, 2014.  The yen plunged in value, which might have sent inflation spiraling higher.

    But, two days earlier, oil had broken down through long-term support.  And…spoilers: it was not a coincidence.

    USDJPY rallied sharply, gaining 22% by June 2015.  And, CL dropped like a rock, losing 55% by Jan 2015 and, of course, much more after a couple of bounces.  

    The sharp drop in oil obviously made the plunge in the yen palatable.  Inflation dropped back below 2% in early 2015 (below zero by 2016) and SPX rallied past the resistance du jour to new all-time highs.

    Everything was going well until USDJPY, reached 120.11 — a critical Fib level which represented 61.8% of its drop from 147.65 in 1998 to 75.65 in 2011.  Itt spent 14 months playing cat and mouse with 120, boosting stocks with every push above and triggering sell offs like with every dip below.

    There was one such scare in August 2015, when USDJPY broke trend and ultimately dipped below 120.  SPX, which had recently reached what we deemed a top [see: The Last Big Butterfly], plunged 12.5%. 

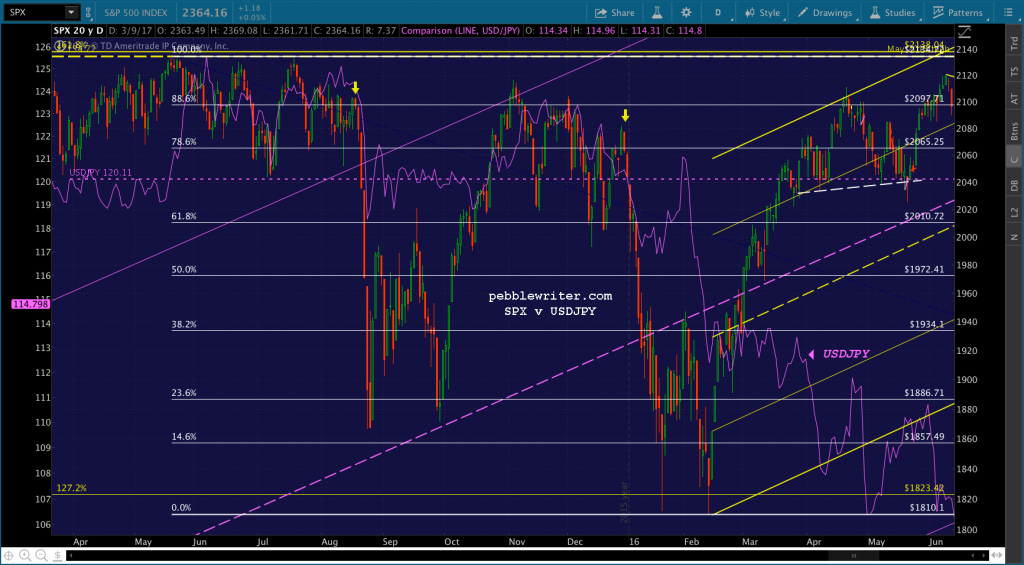
    USDJPY pushed back above 120 and stocks recovered.  But, it didn’t last.  In December, It fell through 120 again.  This time, stocks plummeted 14.5%.  Clearly, something had to give.

    Fortunately for stocks, CL was nearing a bottom.   I had had a downside target of 26.22 on CL since Jan 9 and called a bottom on Feb 11 simply because any further drop in CL and USDJPY would have broken some very long-term trend lines for SPX [see: USDJPY Finally Relents.]  

    Oil bottomed at 26.05 on Feb 11, and rocketed higher, almost doubling in 4 months.   Its recovery was about all that stocks (well, algos) cared about.  When CL finally reached 51.6 last October 10 — one year from its last 2015 peak — I called a top [see: Welcome to Peak Oil.]

    It occurred to me that oil would need to decline sharply over the next 4 months or Yellen & Co. would also be facing some rather inconvenient inflation of their own. 

    As it turned out, that call was premature. CL fell 18%, but the drop was tough on stocks — which everybody wanted to ramp higher into YE, especially after the near disaster on election night [see: The Fallout.]

    So, the decline was postponed until 2017 — with CL putting in a high on Jan 3.  It might have stayed at that level, too, but for inflation.  January’s 0.6% MoM (2.5% YoY) CPI sent shock waves through the Eccles building — not to mention the bond market.  

    With February’s (probably worse) numbers due out on Mar 15, central bankers must take action to avoid being painted into an inflationary corner.  Bottom line, this is the swoon we’ve been waiting for.

    There are two ways to play it, and neither of them involve stocks.  CL has already reached our two initial downside targets, but there is more to come.continued for members(more…)