

Regular readers know that I’ve been beating the carry trade drum for years. From 2011 to 2015, it was the yen carry trade driven by the plunging yen (rising USDJPY) that was largely responsible for stocks gains. I wrote about this most recently (Feb 22) in our latest post on the Big Picture.  At the end of 2013, stocks were in limbo when USDJPY ran into serious technical resistance — the top of a falling channel from 1998. Japan also faced fundamental problems because oil, priced in USD and topping $110/barrel, was causing rather inconvenient inflation (remember, Japan’s nukes were taken offline following Fukushima.)
It’s tough to justify historic accommodative measures in the midst of nearly 4% inflation. But, the BoJ, very much stuck in an equity trap, dared not change course. Withdrawing QQE was not an option.
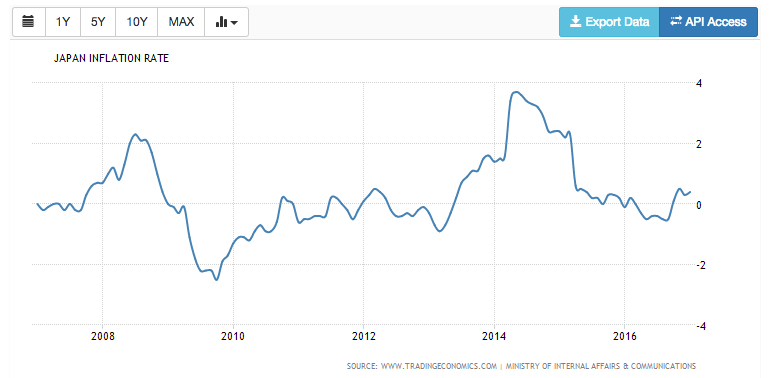 Stuck between an inflationary rock and a market crash hard place, USDJPY spent eight months going sideways — coiling, but never breaking down — until it finally broke out of the falling channel on Aug 20, 2014. The yen plunged in value, which might have sent inflation spiraling higher.
But, two days earlier, oil had broken down through long-term support. And…spoilers: it was not a coincidence.
 USDJPY rallied sharply, gaining 22% by June 2015. And, CL dropped like a rock, losing 55% by Jan 2015 and, of course, much more after a couple of bounces.
The sharp drop in oil obviously made the plunge in the yen palatable. Inflation dropped back below 2% in early 2015 (below zero by 2016) and SPX rallied past the resistance du jour to new all-time highs.
Everything was going well until USDJPY, reached 120.11 — a critical Fib level which represented 61.8% of its drop from 147.65 in 1998 to 75.65 in 2011. Itt spent 14 months playing cat and mouse with 120, boosting stocks with every push above and triggering sell offs like with every dip below.
There was one such scare in August 2015, when USDJPY broke trend and ultimately dipped below 120. SPX, which had recently reached what we deemed a top [see: The Last Big Butterfly], plunged 12.5%.
 USDJPY pushed back above 120 and stocks recovered. But, it didn’t last. In December, It fell through 120 again. This time, stocks plummeted 14.5%. Clearly, something had to give.
Fortunately for stocks, CL was nearing a bottom. I had had a downside target of 26.22 on CL since Jan 9 and called a bottom on Feb 11 simply because any further drop in CL and USDJPY would have broken some very long-term trend lines for SPX [see: USDJPY Finally Relents.]
Oil bottomed at 26.05 on Feb 11, and rocketed higher, almost doubling in 4 months. Its recovery was about all that stocks (well, algos) cared about. When CL finally reached 51.6 last October 10 — one year from its last 2015 peak — I called a top [see: Welcome to Peak Oil.]
 It occurred to me that oil would need to decline sharply over the next 4 months or Yellen & Co. would also be facing some rather inconvenient inflation of their own.
As it turned out, that call was premature. CL fell 18%, but the drop was tough on stocks — which everybody wanted to ramp higher into YE, especially after the near disaster on election night [see: The Fallout.]
So, the decline was postponed until 2017 — with CL putting in a high on Jan 3. It might have stayed at that level, too, but for inflation. January’s 0.6% MoM (2.5% YoY) CPI sent shock waves through the Eccles building — not to mention the bond market.
With February’s (probably worse) numbers due out on Mar 15, central bankers must take action to avoid being painted into an inflationary corner. Bottom line, this is the swoon we’ve been waiting for.
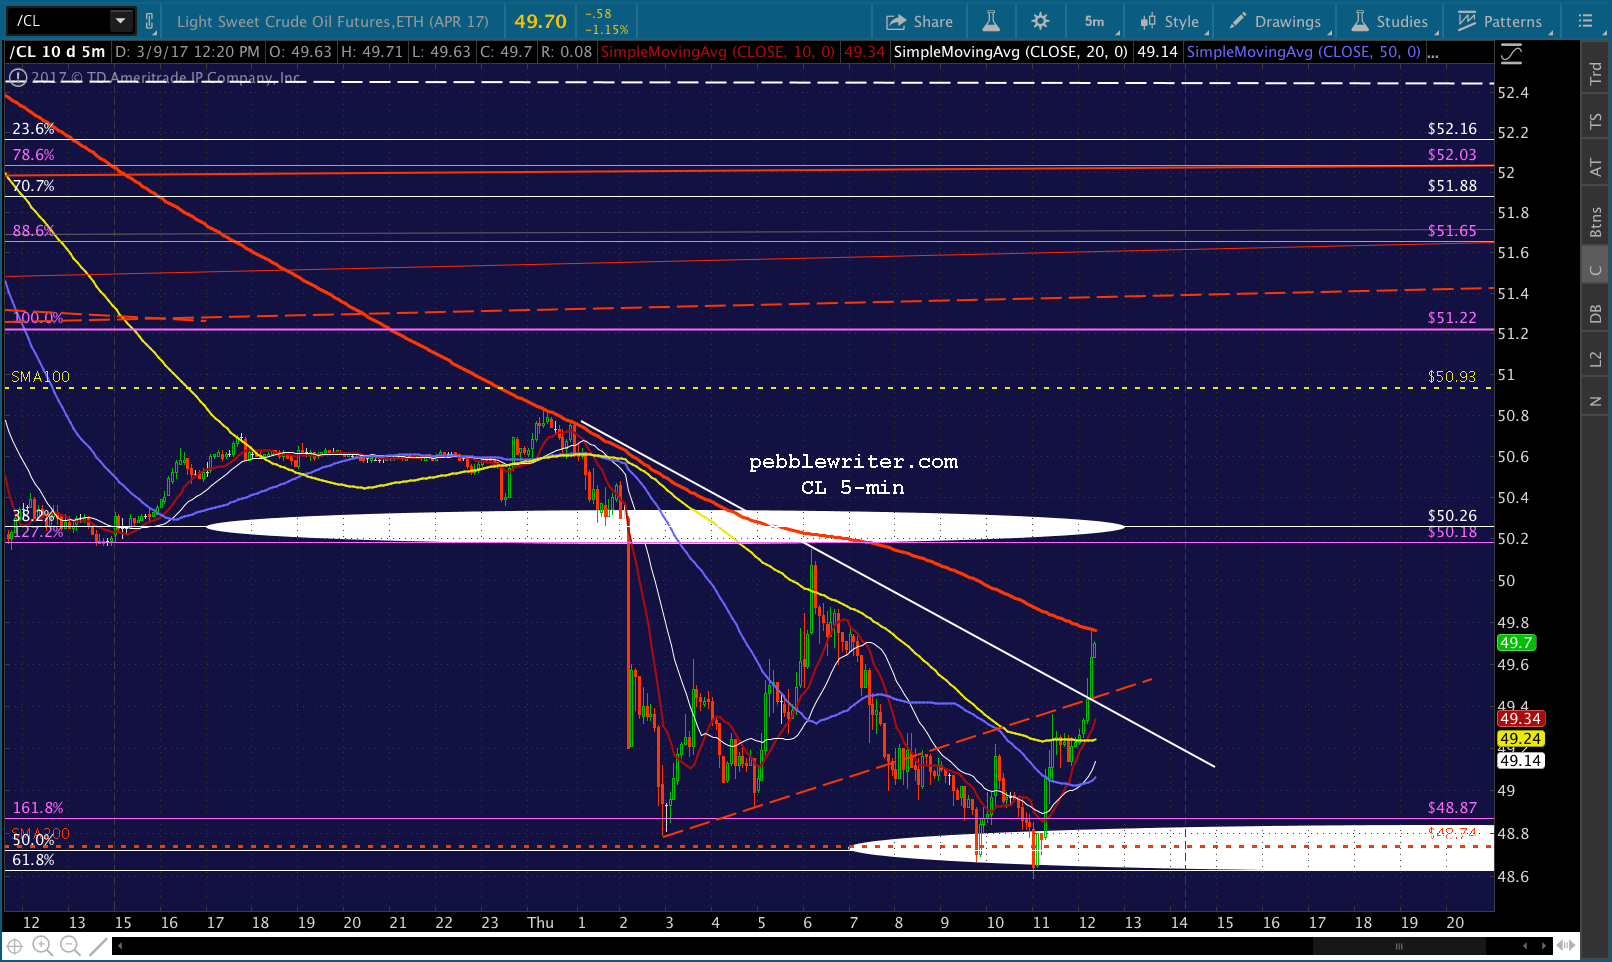
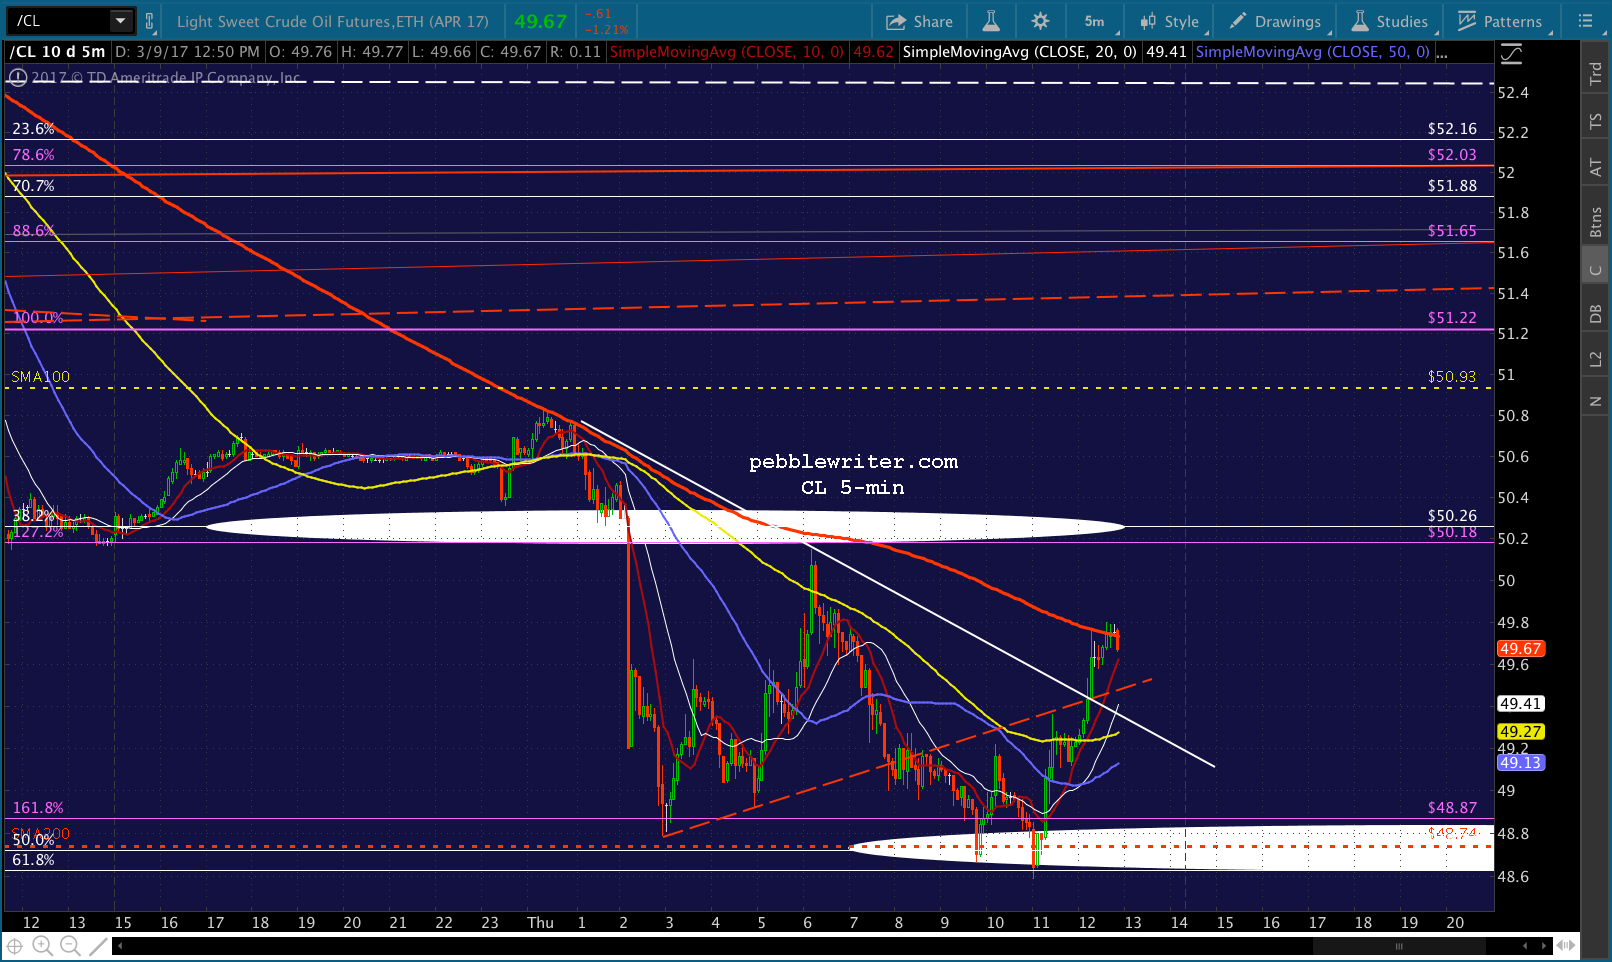
There are two ways to play it, and neither of them involve stocks. CL has already reached our two initial downside targets, but there is more to come. continued for members…
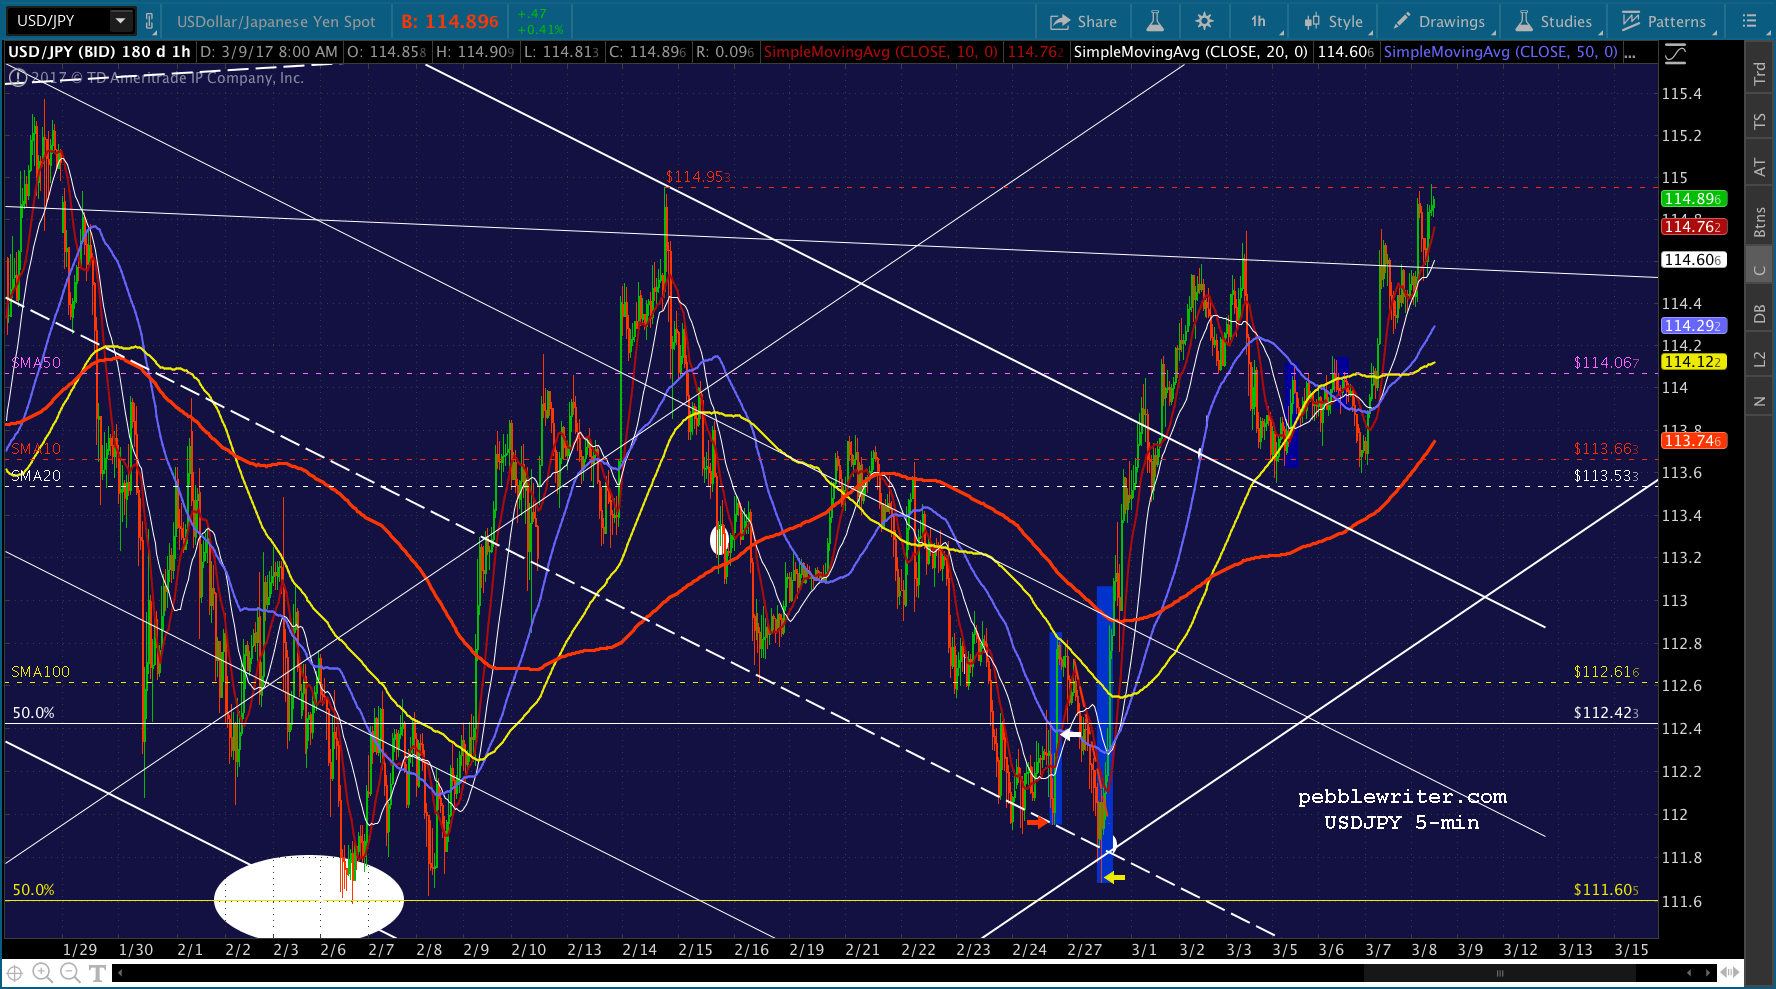
CL not only has further to go, but USDJPY will be ramping higher to offset it — just like in 2014. It has already broken out of the falling white channel and is most likely ready to rally to our upside target of 120.11. Note the convergence of the Fib levels (the white .786 and the yellow .618) as well as the top of the falling white channel.
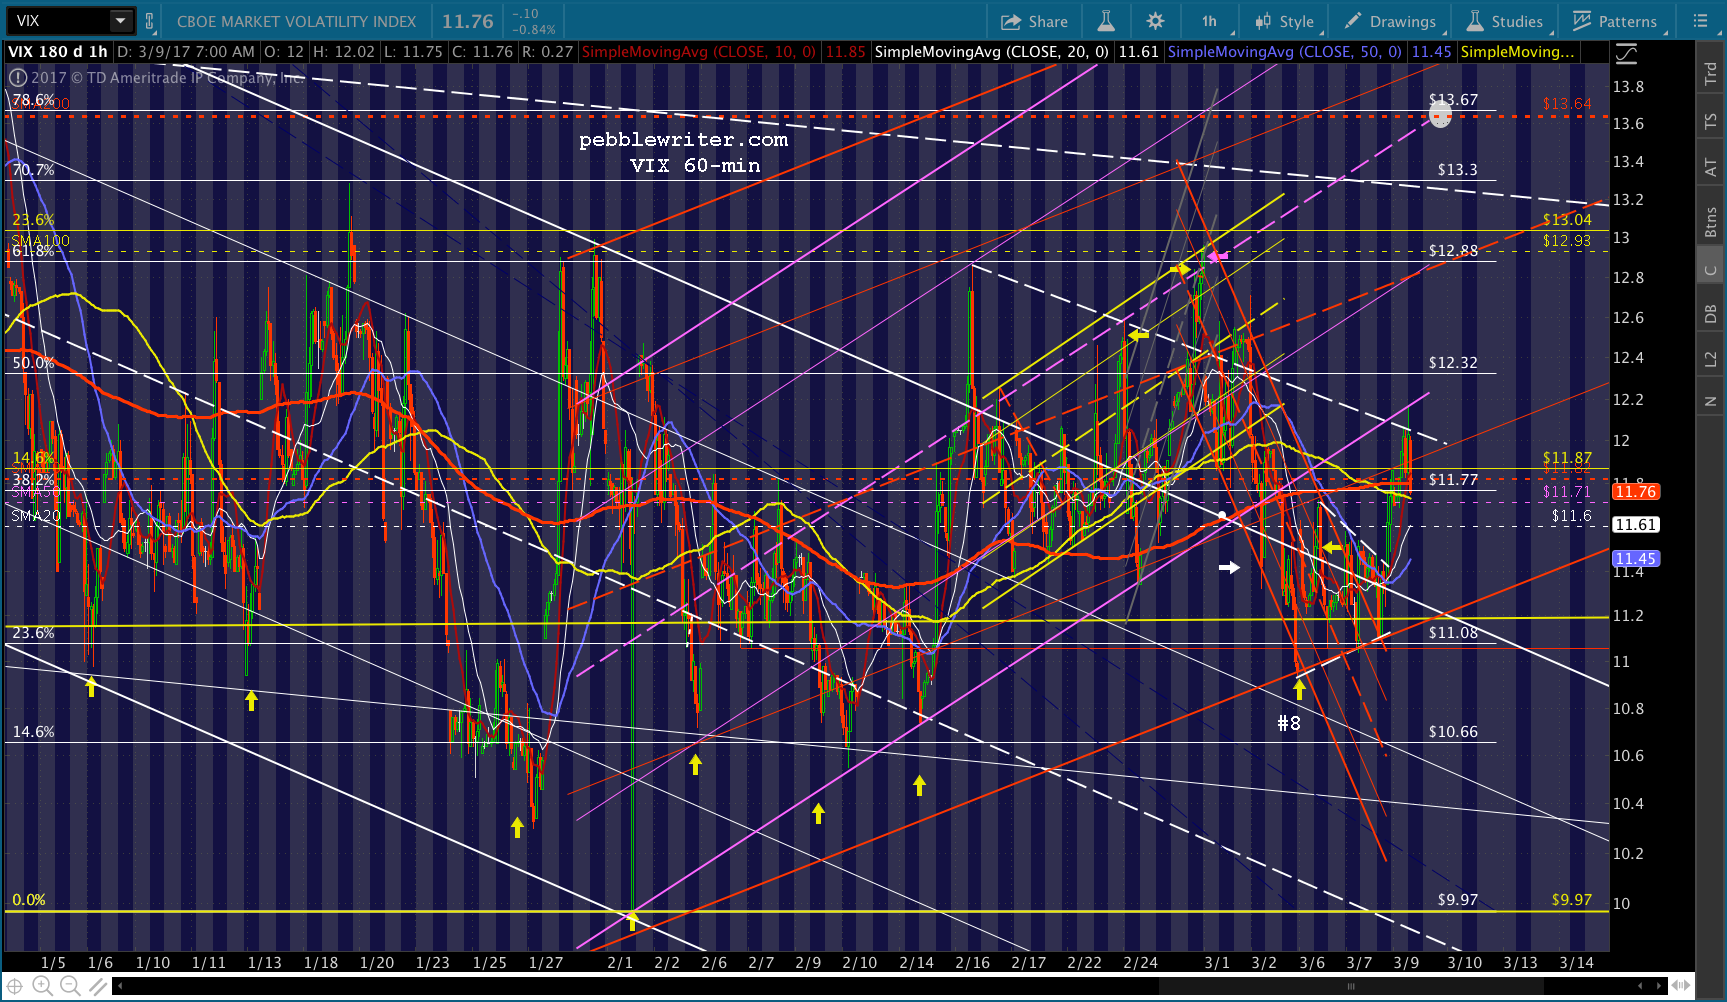
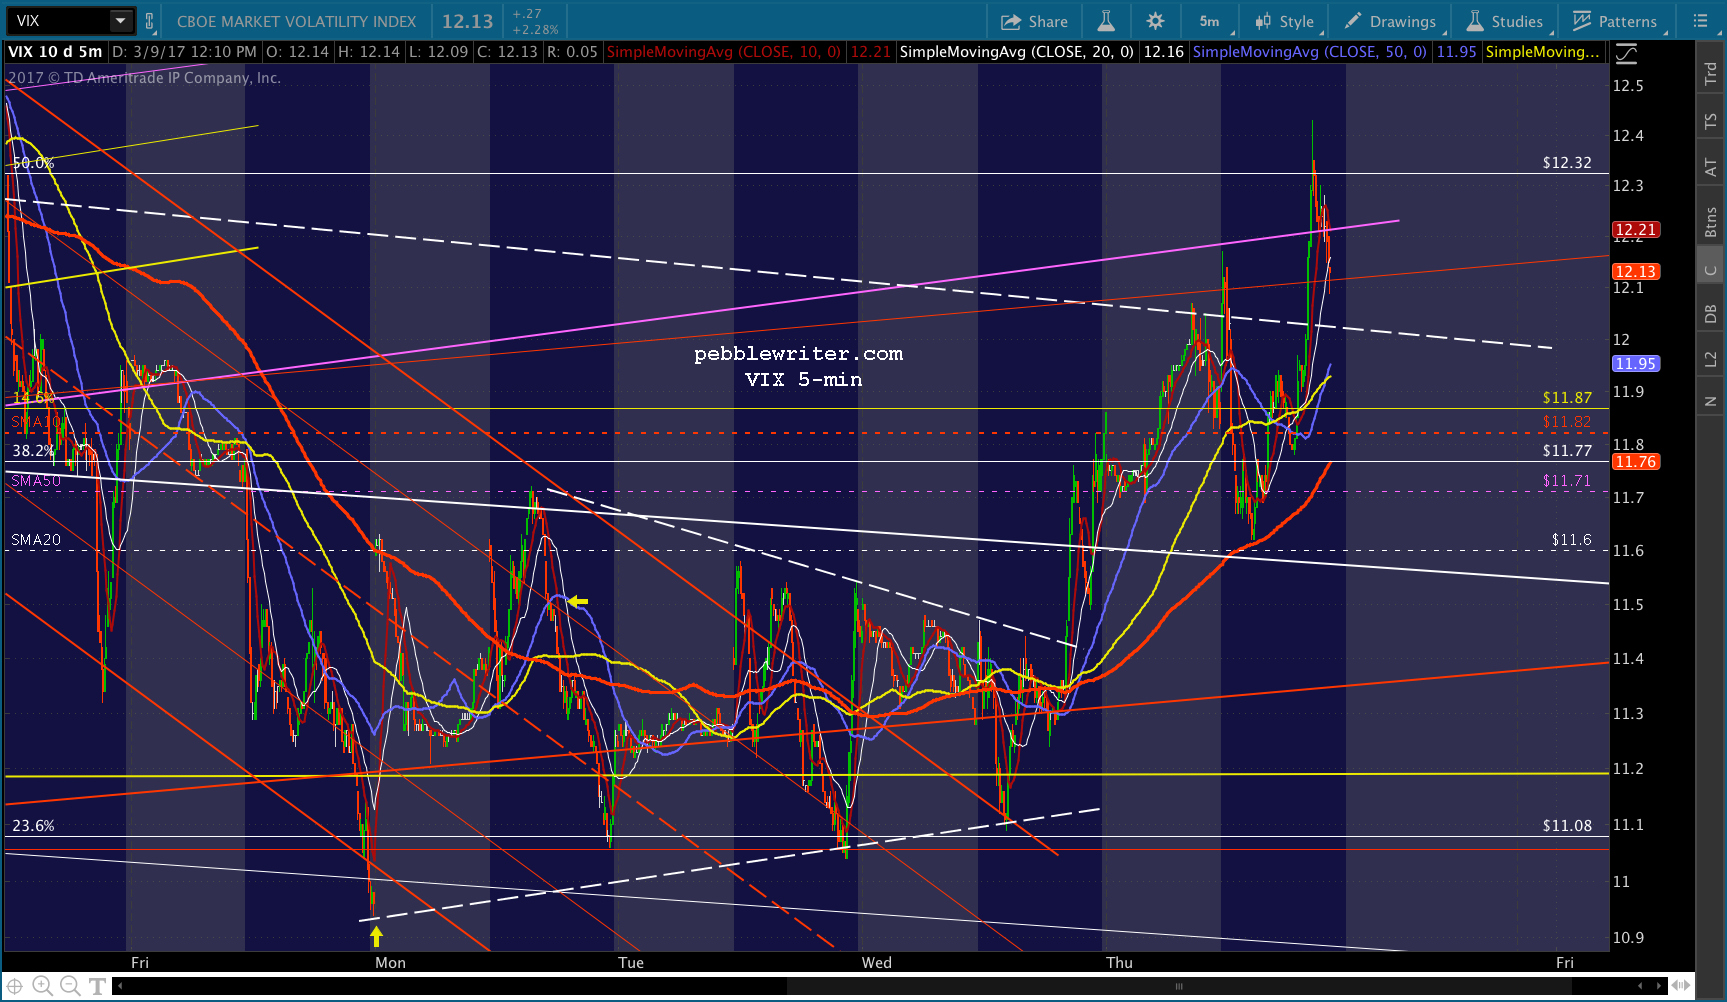
 What will stocks do? This morning’s VIX charts are a good indication. VIX is currently up a little over 1%, even though stocks are also higher.
 This is partly because VIX is confused that stocks are higher in the face of crashing oil prices (the USDJPY) and partly the result of a timing issue. CL dropped another 4% overnight, when futures could be propped up. It’s been bouncing since before 6AM.
VIX traders (those not watching USDJPY) can be forgiven for expecting some spillover from the oil debacle. Now, they have to consider the possibility that today will be like every other day when big money comes in a crushes VIX in order to prop up stocks.
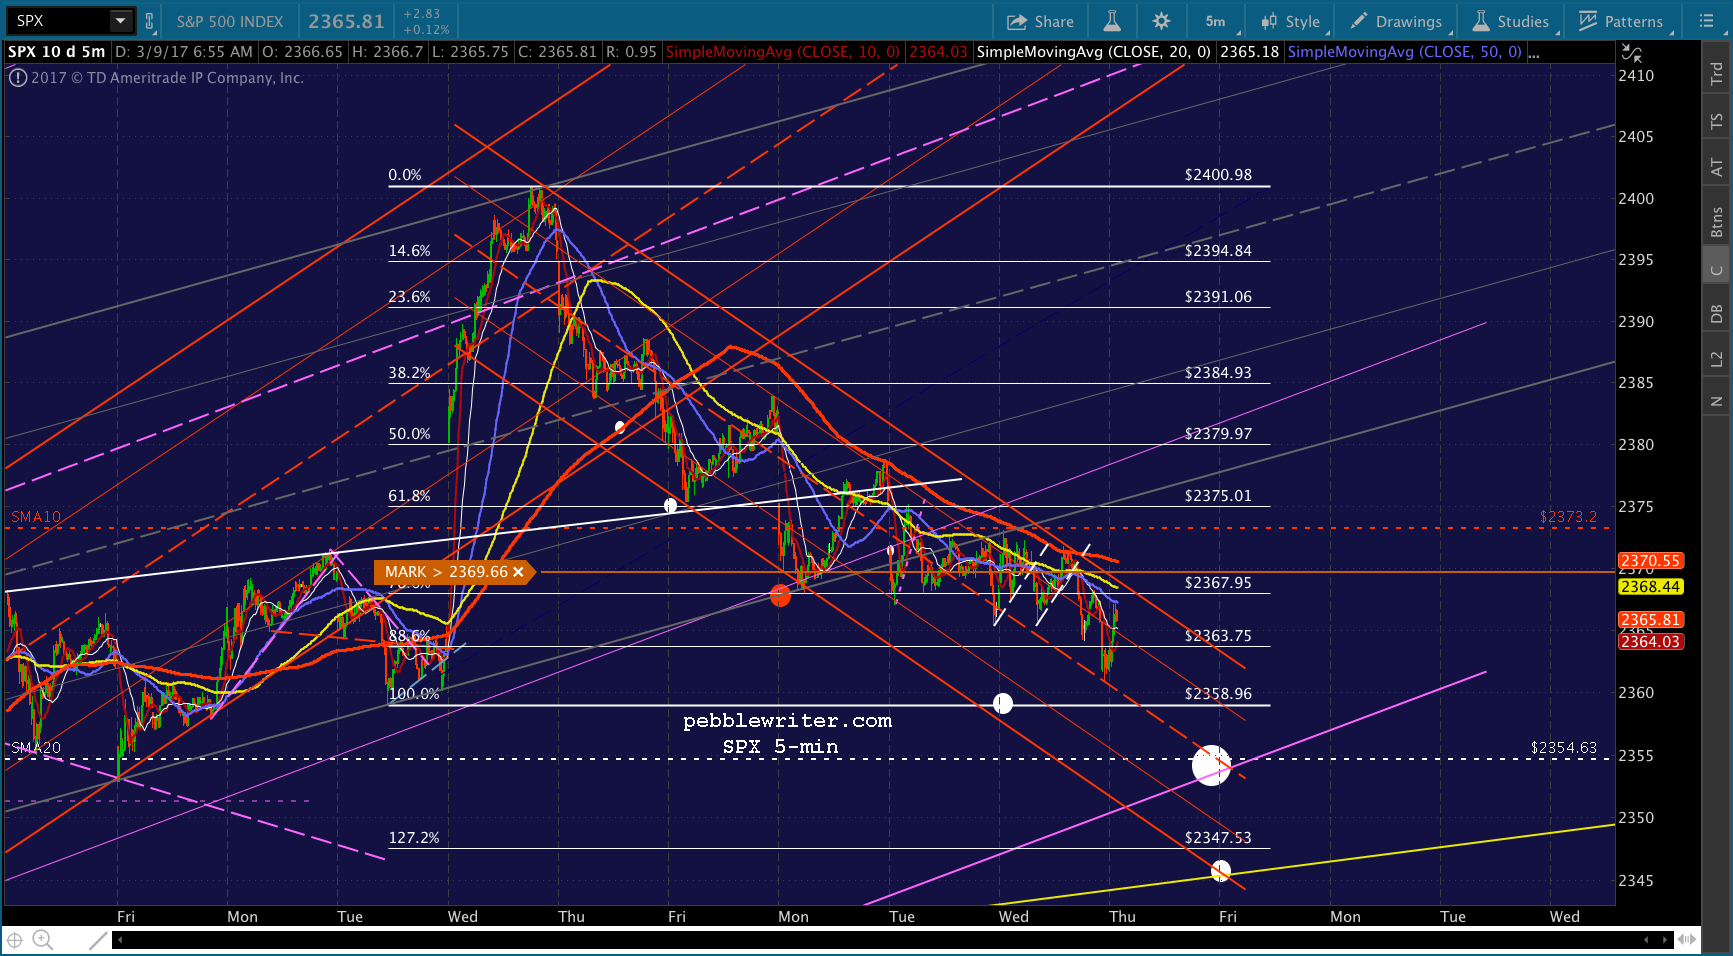
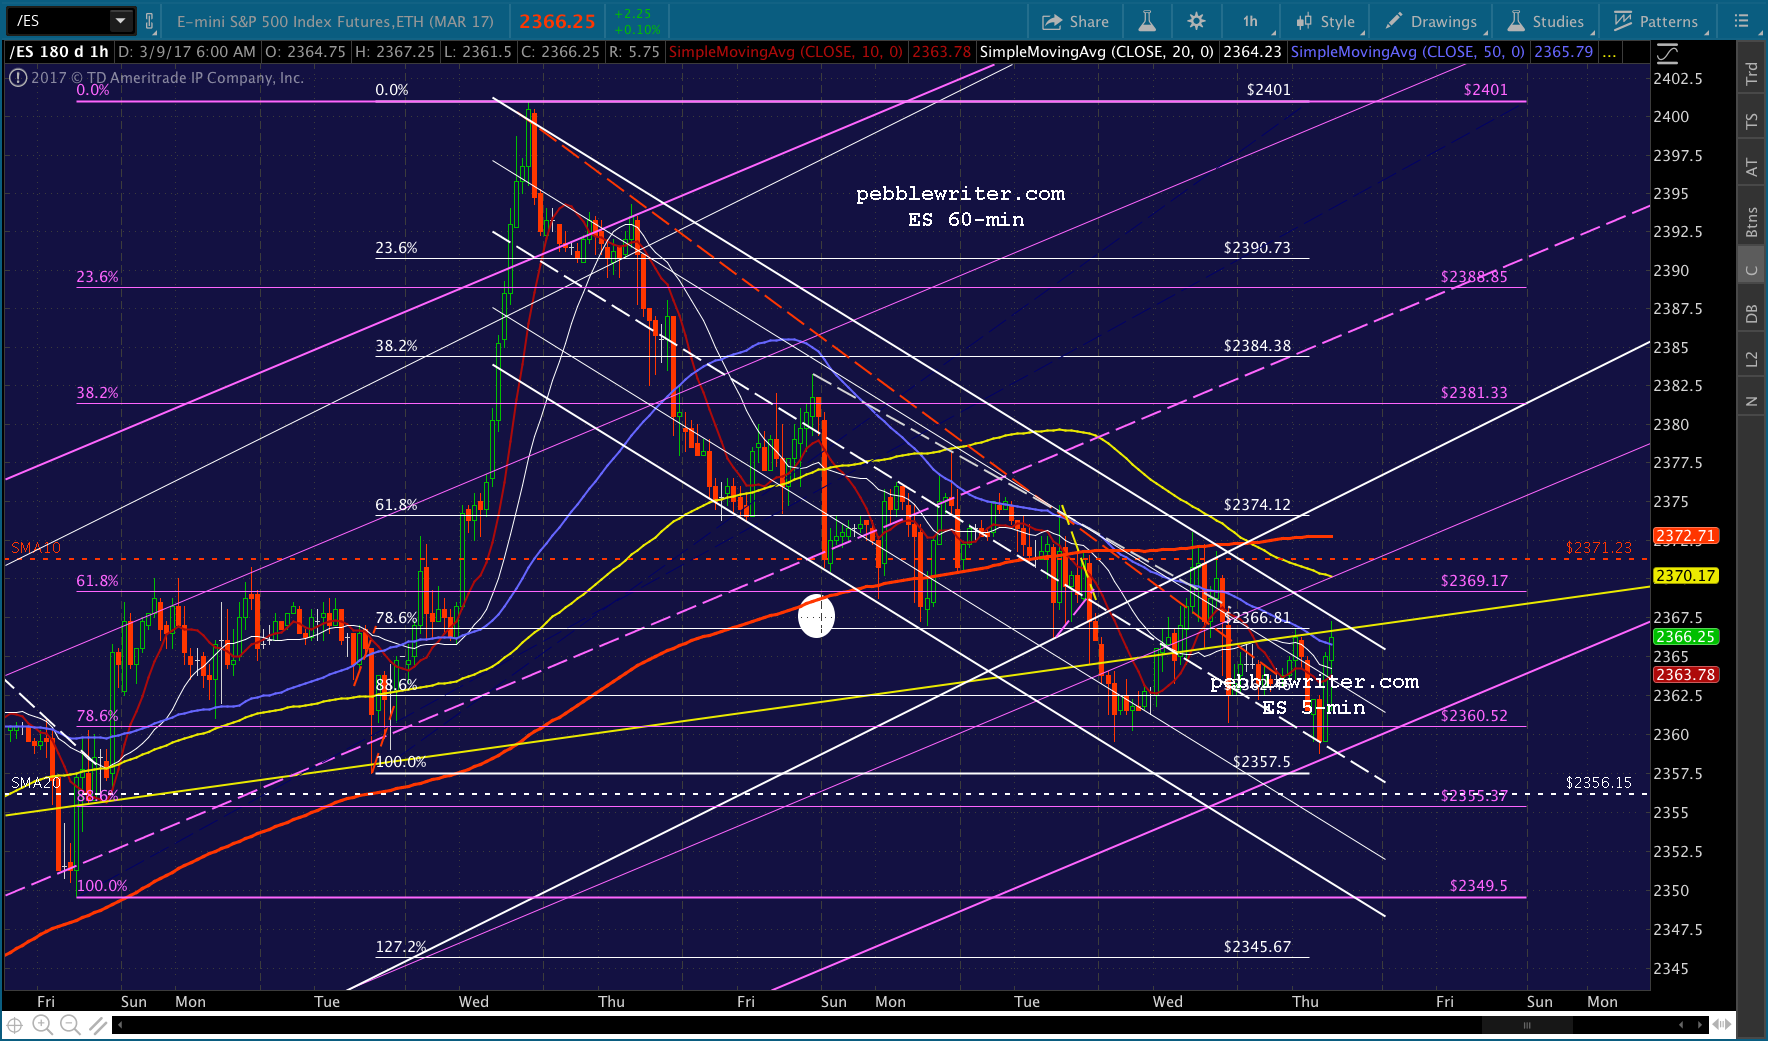
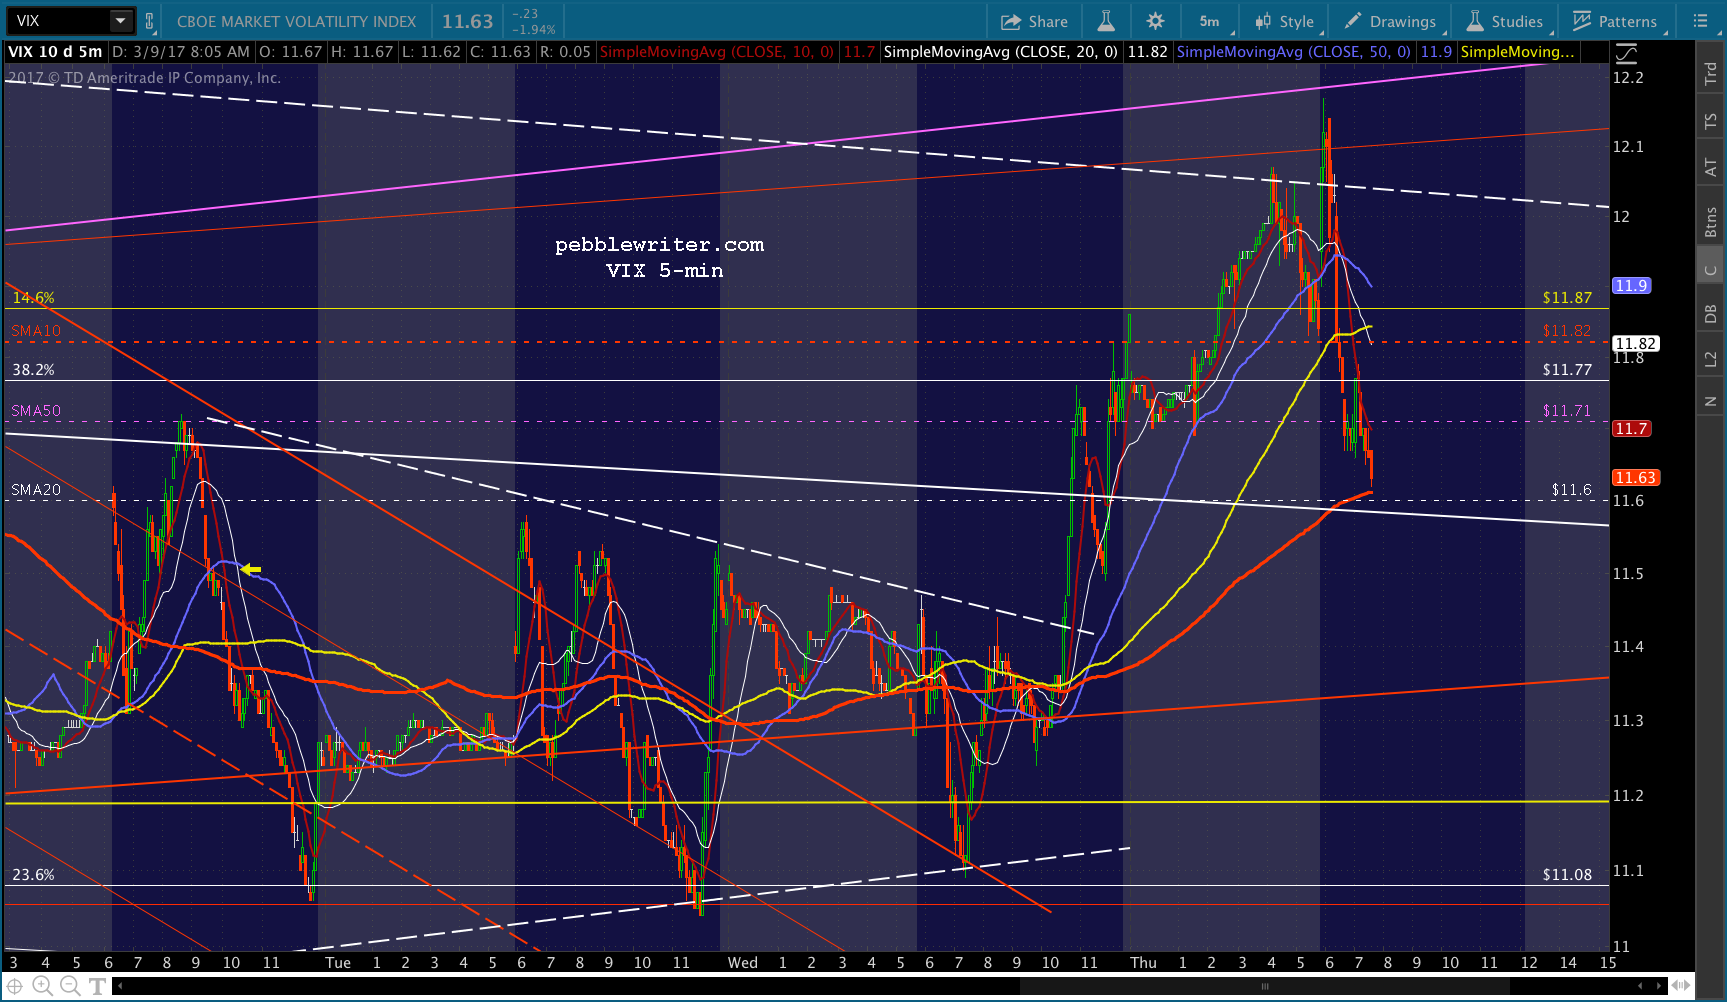
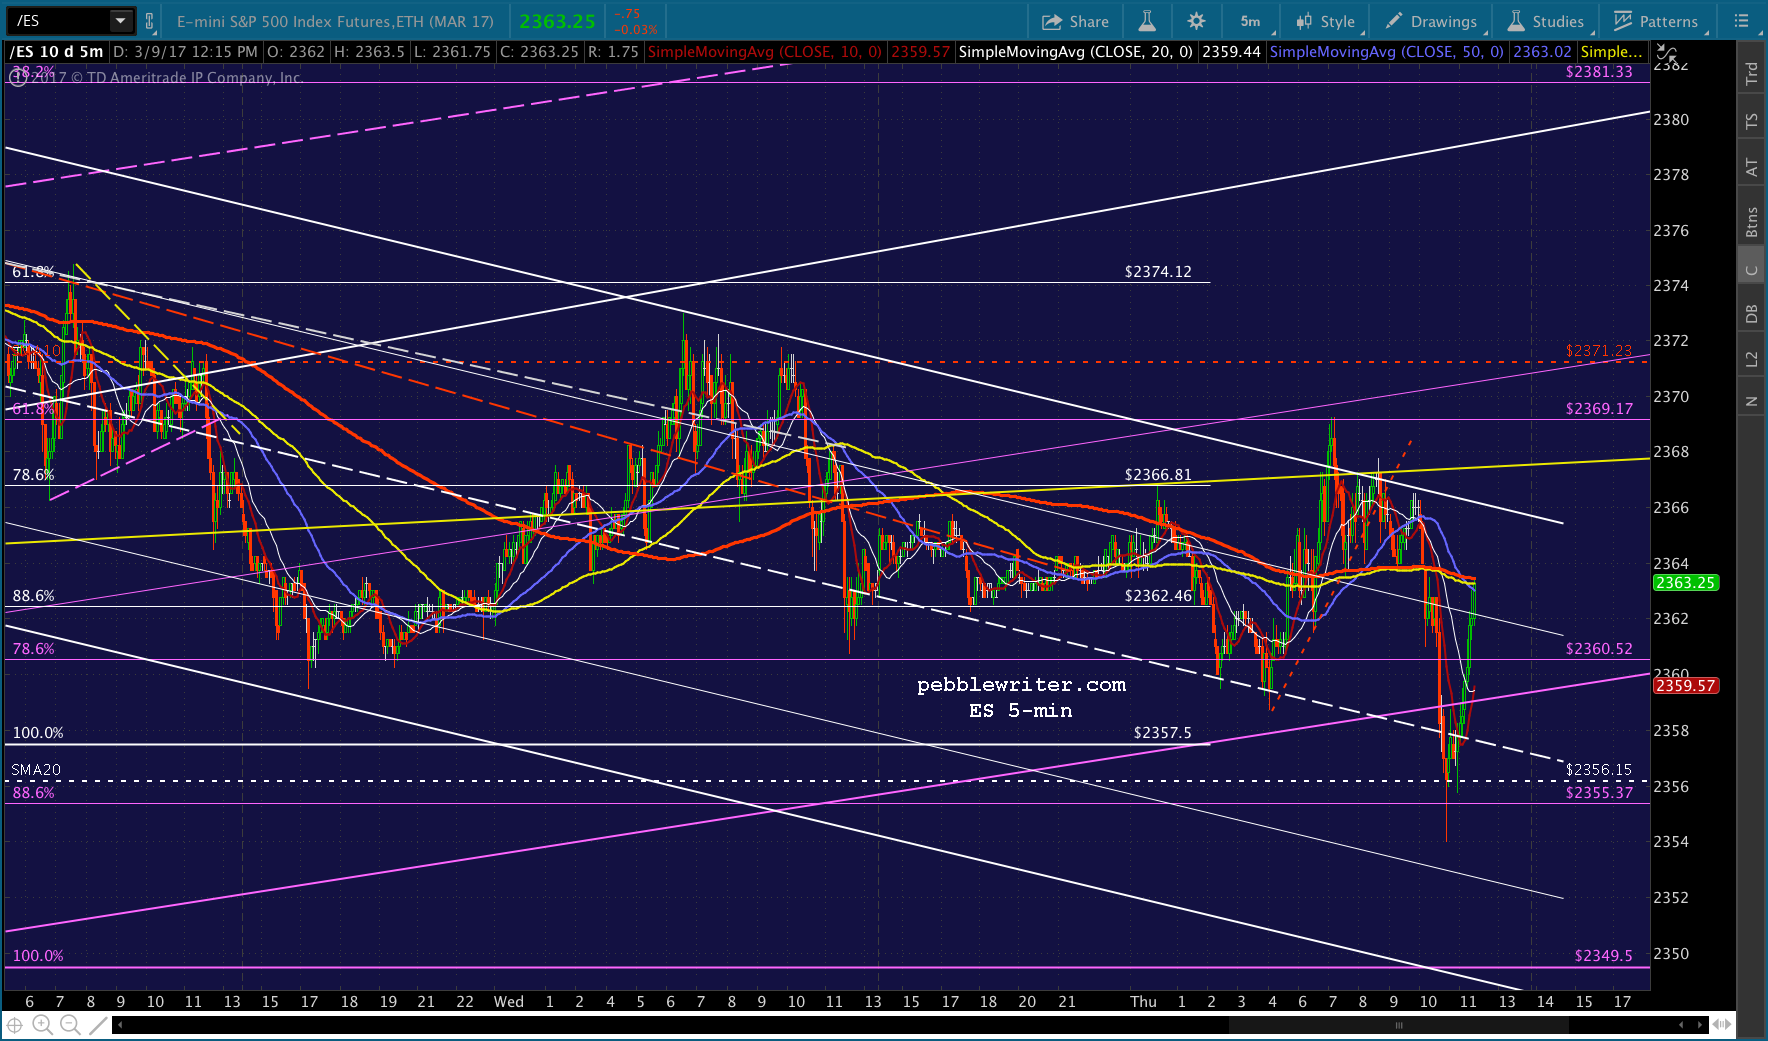
And, in fact, VIX’s white TL might serve as good resistance and give ES a reason to pop out of its falling white channel (and, SPX its red.) A drop through the SMA10 at 11.82 would add fuel to the fire.
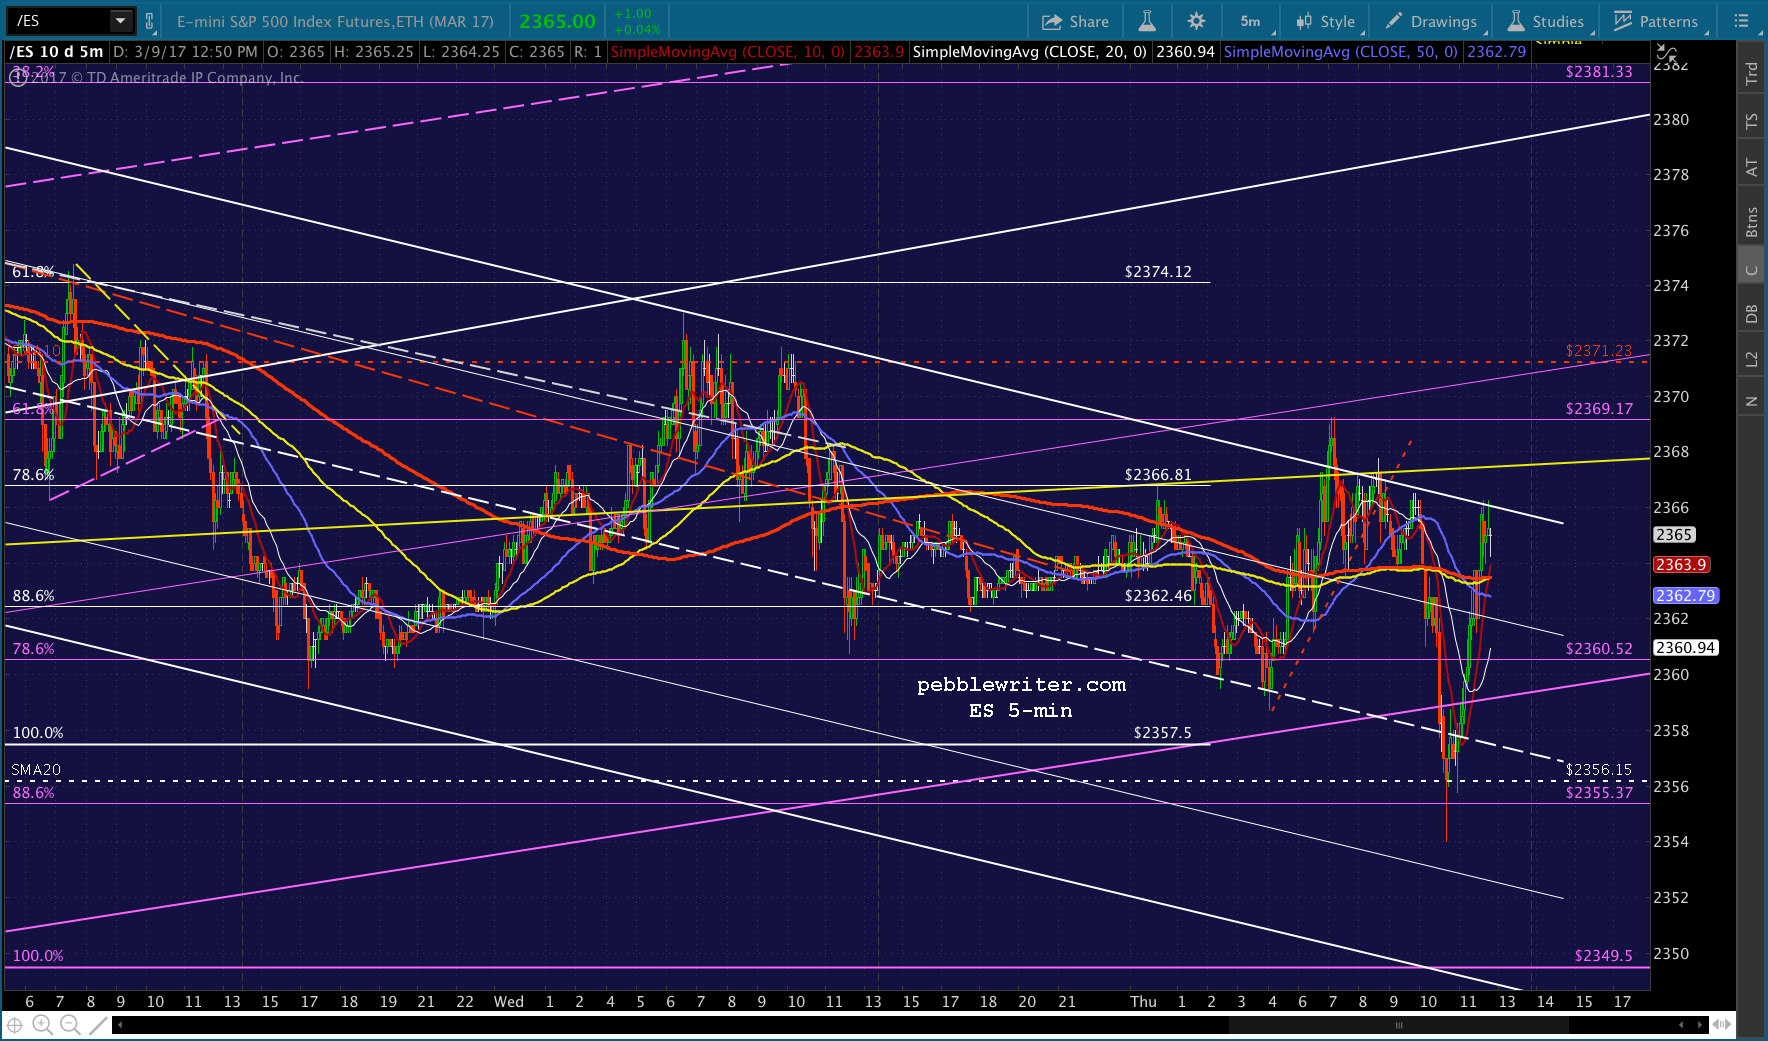
It doesn’t mean stocks have no more downside, but ES’ chart can be drawn in such a way that it has already tagged the rising purple channel bottom. Even though SPX hasn’t yet reached its, it has pushed through its short term moving averages on the VIX/CL/USDJPY bounce and is threatening to break out of the red channel at 2368.50ish.
UPDATE: 10:09 AM
VIX is dropping through its SMA10, USDJPY is pushing to new highs, and ES is popping out of its falling white channel. SPX should be close behind, so I’d cover any short positions here if it breaks out. I realize the SMA5 200 is just above at 2370.47, and it might work just fine as resistance. And, I might be giving VIX too much credit. But, I’d rather re-short than get stuck on the wrong side of the trade.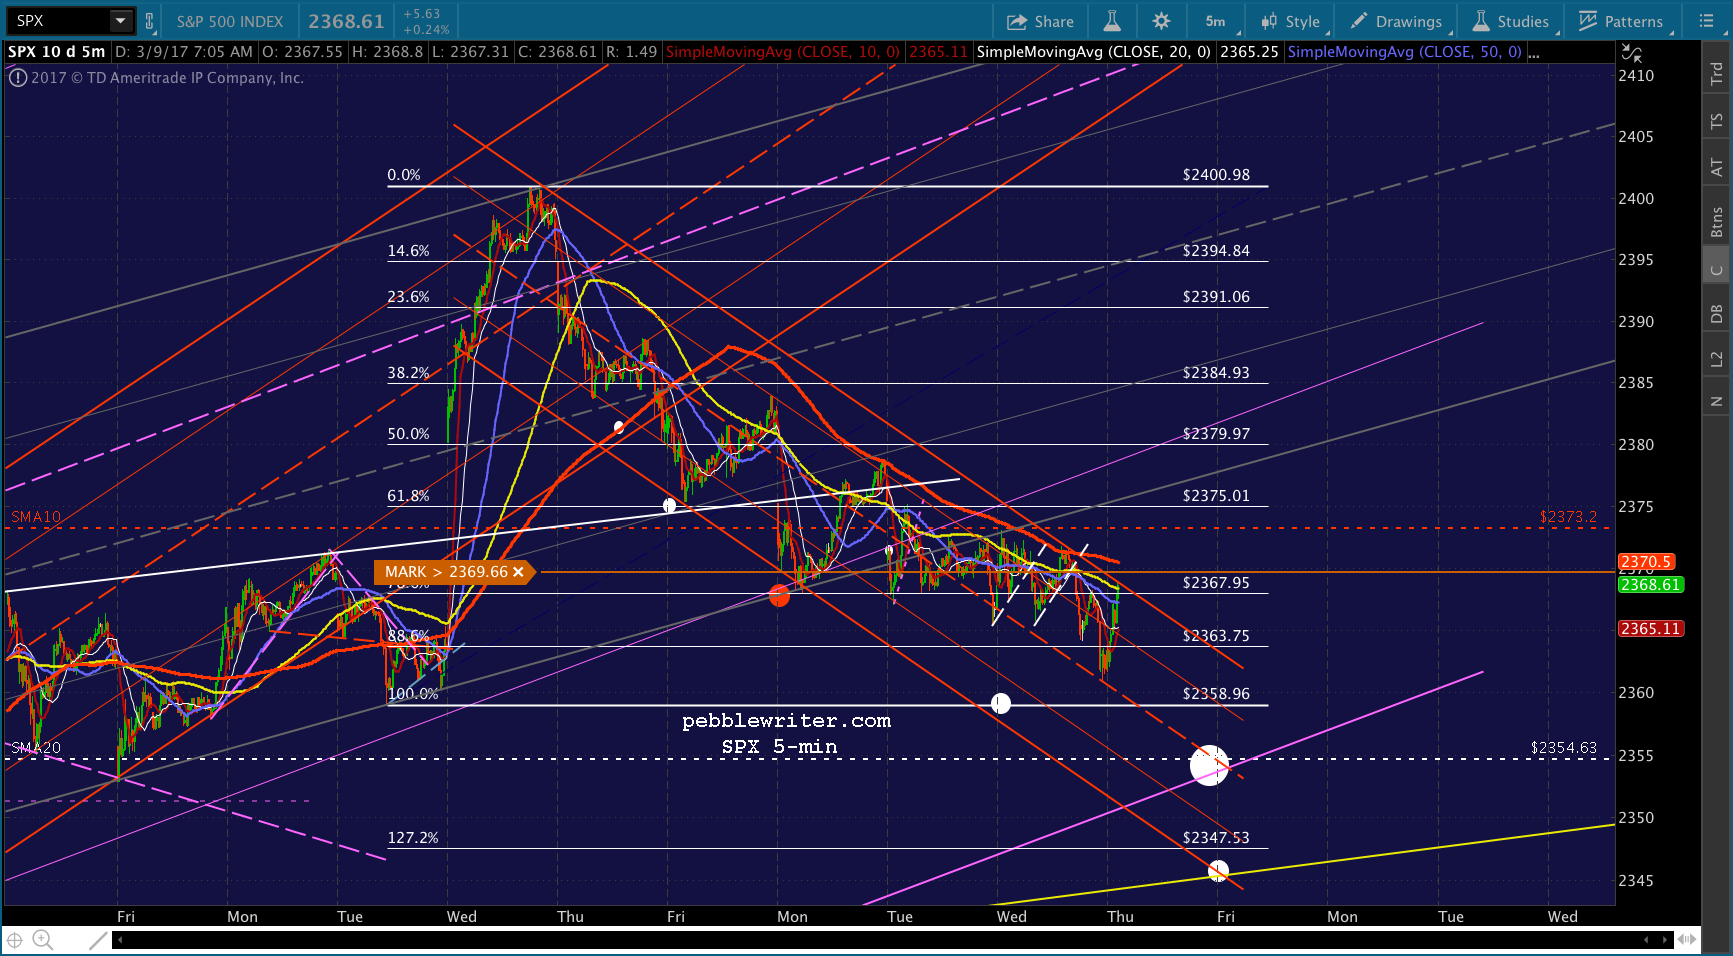
 But, as I suggested above, I believe the focus should be on USDJPY and CL (actually, RBOB.) Stocks are the recipients of all this attention, not the drivers. And, we’ve sen plenty of situations over the past several months and years where stocks were able to hold gains in spite of whatever shitstorm engulfed them at the time.
UPDATE: 11:07 AM
They’re either trying to hold out until the euro close or will try again to break SPX out of its falling red channel. VIX has broken down through the SMA10 and 50 and is about to test the SMA20 and SMA5 200. It’s a 4.5% decline since this morning’s highs — this as CL is currently off over 2%.
If they want a breakout, all it would take is VIX plunging through 11.6 and USDJPY pushing up to new highs — maybe CL bouncing off the SMA200 at 48.74. Not a bad time to tighten up your stops.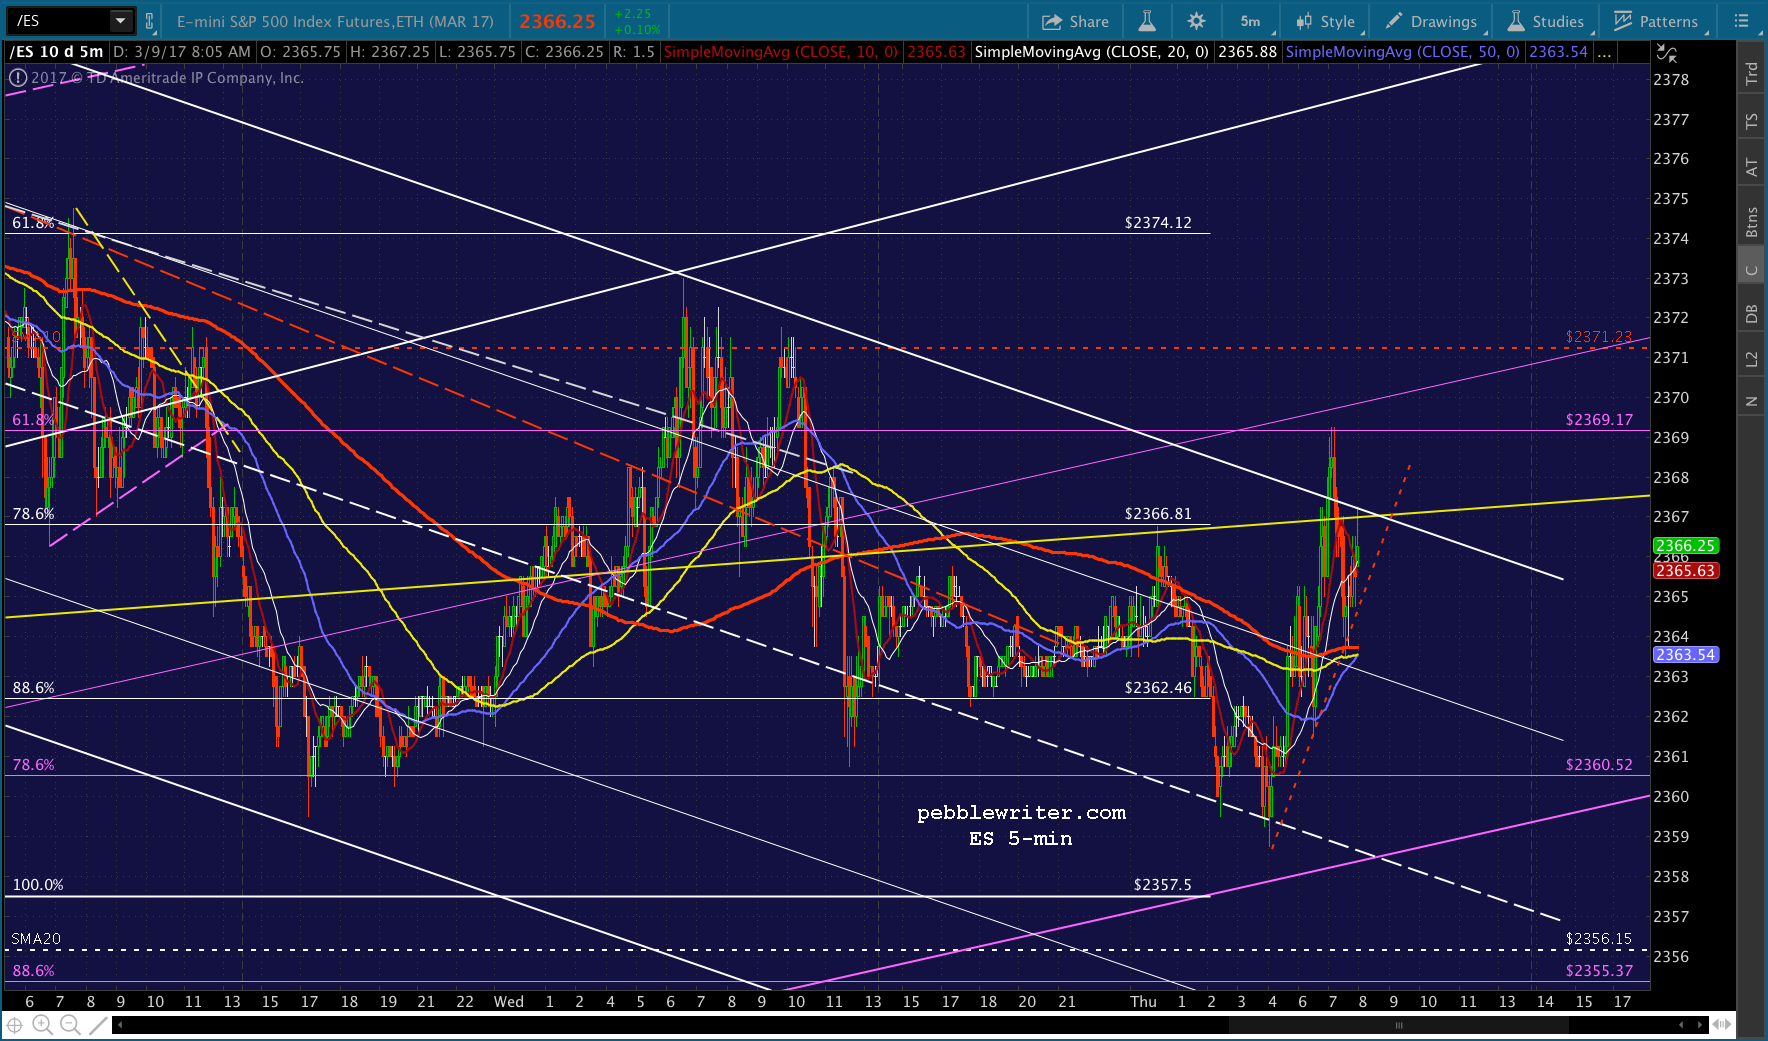

 UPDATE: 2:17 PM
SPX just hit the big target. We should get a bounce here, with a further drop to 2345-2347 still a possibility. I’d cover here at 2354.61, and be prepared to re-short on any sustained push below 2354. In gauging the bounce, keep an eye on VIX, of course, as well as CL itself.
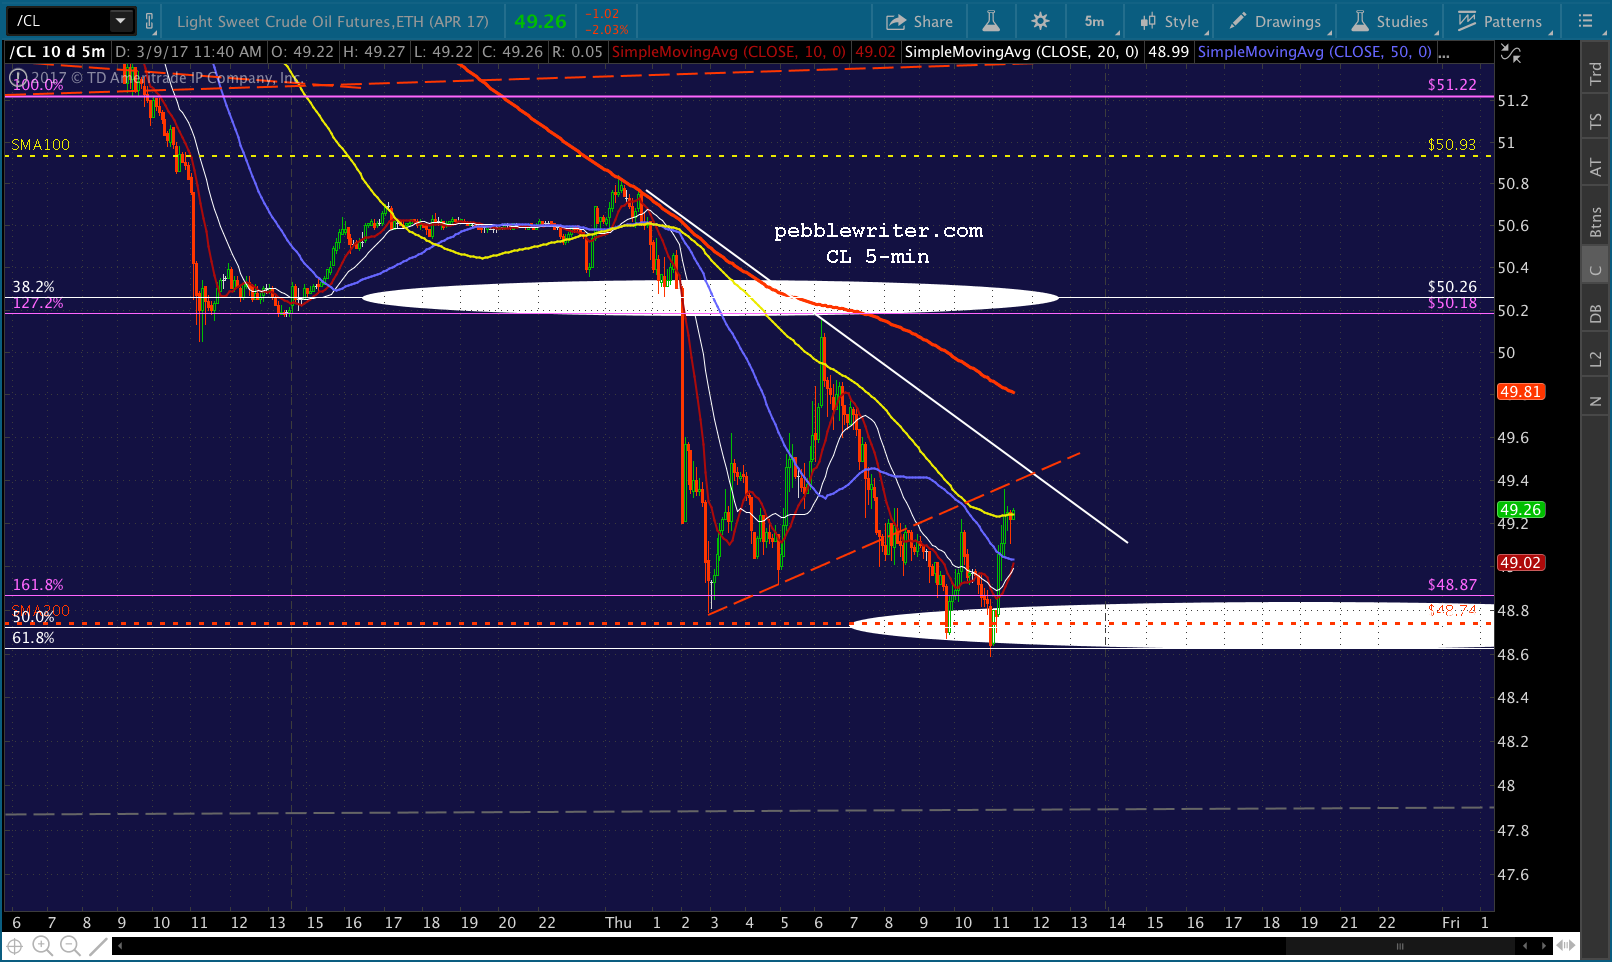
 UPDATE: 3:20 PM
Here’s a potential turning point for SPX. Unless CL pops up through SMA5 200 resistance and/or VIX plunges, I’d want to try re-shorting here. Tight stops are in order. This is probably a good place to short CL (also with tight stops) for those who are late to the party.
UPDATE: 3:30 PM
Don’t want to leave money on the table, but ES pushing above its SMA5 200 makes me nervous. And, we’ve had a good couple of days already. I’d rather revert to cash here and re-short if we get a strong signal. Is this a signal to revert to long? Maybe. But, the falling red channel has been curving higher for the past two days, and it’s possible SPX is just heading up to the SMA5 200 at 2367.23. A reversal there would be interesting, as would a breakout.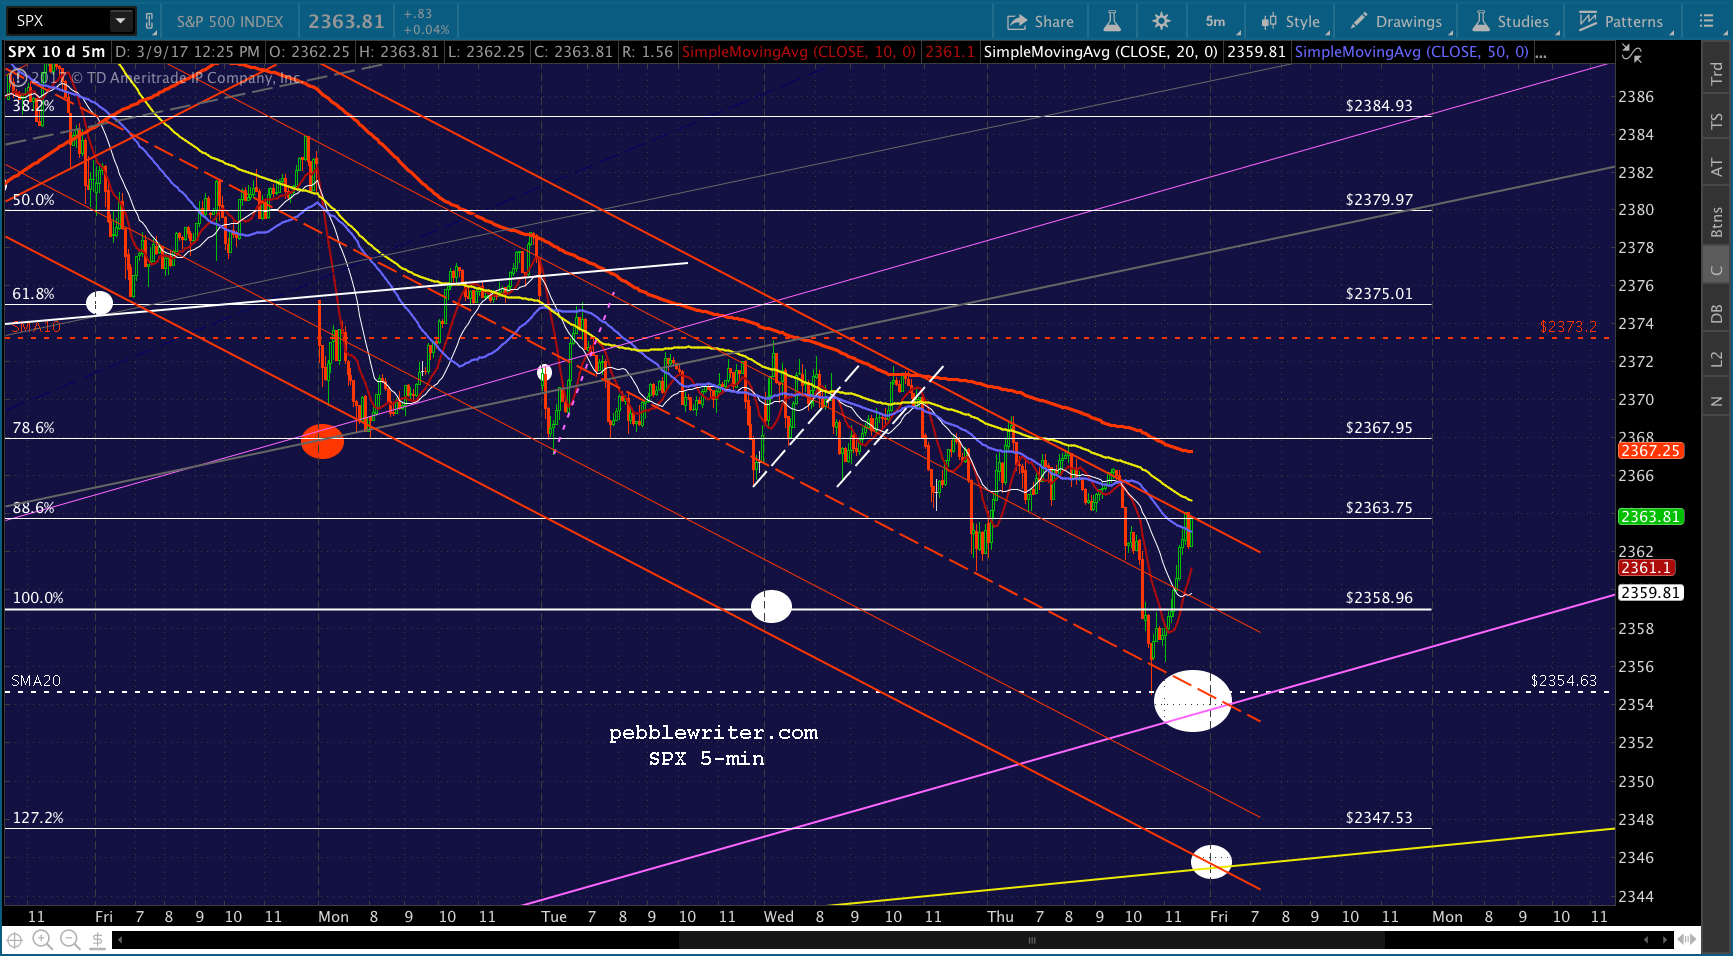
UPDATE: 3:55 PM
Even odds on a breakout or reversal. My hunch is we’ll get a gap down to 2347ish in the morning — mostly because ES has behaved better than SPX (and ES suggests a reversal) and because CL and RB have further to go. But, as always, if you short here and hold overnight, make sure you can handle the ramp risk and/or hedge.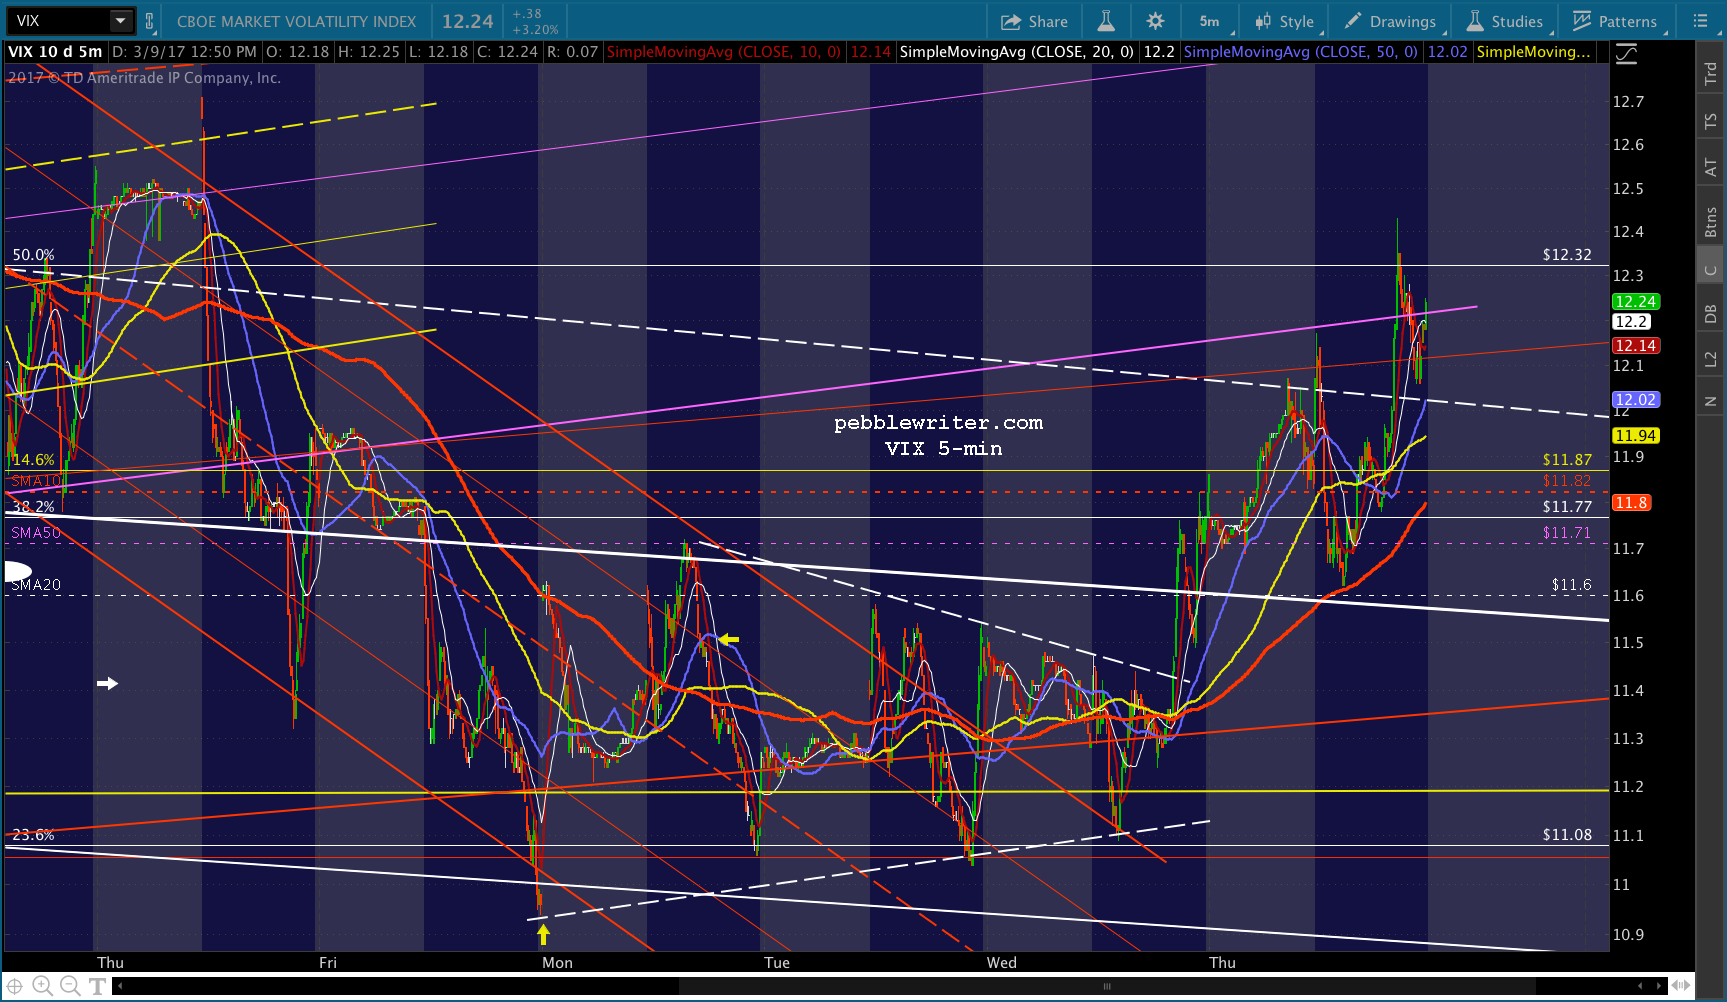


Comments
5 responses to “A Changing of the Guard”
nailed CL on the head, as expected.
Are you still targeting SPX for 2351 and then 2347?
If SPX doesn’t get swept up out of the falling red channel, then 2354 and 2345-2347 still look good. But, it will depend on how much intraday bouncing CL does and how low they can push VIX. The mismatch between ES and SPX is causing some uncertainty. The way to resolve it is with an intraday plunge to SPX 2354 and let ES recover after the close. But, maybe they’ll just blow off having SPX tag an obvious channel bottom. It’s happened many times before.
any closing thoughts on jobs report in the morning? Or already baked in at this point and heading higher?
Sorry, Wade, didn’t see this yesterday. If I had, I’m sure I would have said +235,000 with January revised upward from 227K to 238K, unemployement steady at 4.7%, and participation up from 62.9% to 63.0%.
Seriously, though, the thing about employment that we should all keep track of is that real household income is still bumping along just below where it was in the year 2000. And, that’s using the demonstrably false CPI to adjust the nominal data. Using actual inflation such as is produced by John Williams or Ed Butowsky would show real income has fallen sharply.
http://www.shadowstats.com/article/no-438-public-comment-on-inflation-measurement
http://www.chapwoodindex.com/
https://www.advisorperspectives.com/dshort/updates/2017/03/02/january-real-median-household-income-little-change-from-december-at-58-056