On Feb 6 [see: The End Game] we were looking for CPI to reach 2.5% for January. Going out on a limb (a 13.3% probability at the time) I also suggested that this report would prompt a FOMC rate increase.
The January CPI numbers coming out on Feb 15, even if massaged extensively, are likely to show a pickup in inflation – which had already tripled (from 0.7% to 2.1%) in the past two years in last month’s report. My guess is at least 2.5%.
I think the… likely scenario is to raise rates in March (I know, I’m very much in the minority here — what else is new?) and let the dollar — and, thus the USDJPY — continue to appreciate while forcing a mini-crash in oil and gas.
As it turned out, CPI came in at 2.5% and included a massive 0.6% increase from December. The culprit, as expected, energy prices. Our thesis was, and remains, that rising energy prices — particularly gasoline — would unnerve the FOMC and other central banks who rely on “too-low” inflation to justify the most accommodative monetary policy in history a full eight years after the Great Financial Crisis.
We further reasoned that, with the February YoY inflation in gas prices being higher than the January one, The Feb CPI numbers would put even more pressure on central bankers and would result in even more pressure on oil/gas prices. Two days ago [Whistling Past the Graveyard] I called for Feb CPI to come in at 2.7% or better based, largely, on back of the envelope calculations on gas prices.
As it turned out, 2.7% is exactly what we got. The only problem is, it is accompanied by a decline in the Atlanta Fed’s GDPNow estimate for Q1 to 0.9% — not exactly a bullish situation.

From the EIA — the government agency tasked with tracking such things, we can see the average price of gas rose 32.5% between Feb 2016 and Feb 2017. It was a sharp increase from January’s 24% YoY increase.

February’s 2.7% CPI estimate looked like a very conservative bet unless other factors besides oil/gas offset their contribution.
The BLS just reported 2.7% YoY inflation for February. It included a 1% decline in energy prices MoM, but a whopping 30.7% increase in gasoline prices YoY (versus a 20.3% increase reported in January.)

WTI is down almost 15% from its Jan 3 peak; so, oil’s mini-crash is well under way. Is there more to come? And, with CPI back to levels last seen in Feb 2012, what will this mean for FOMC policy?
continued for members…
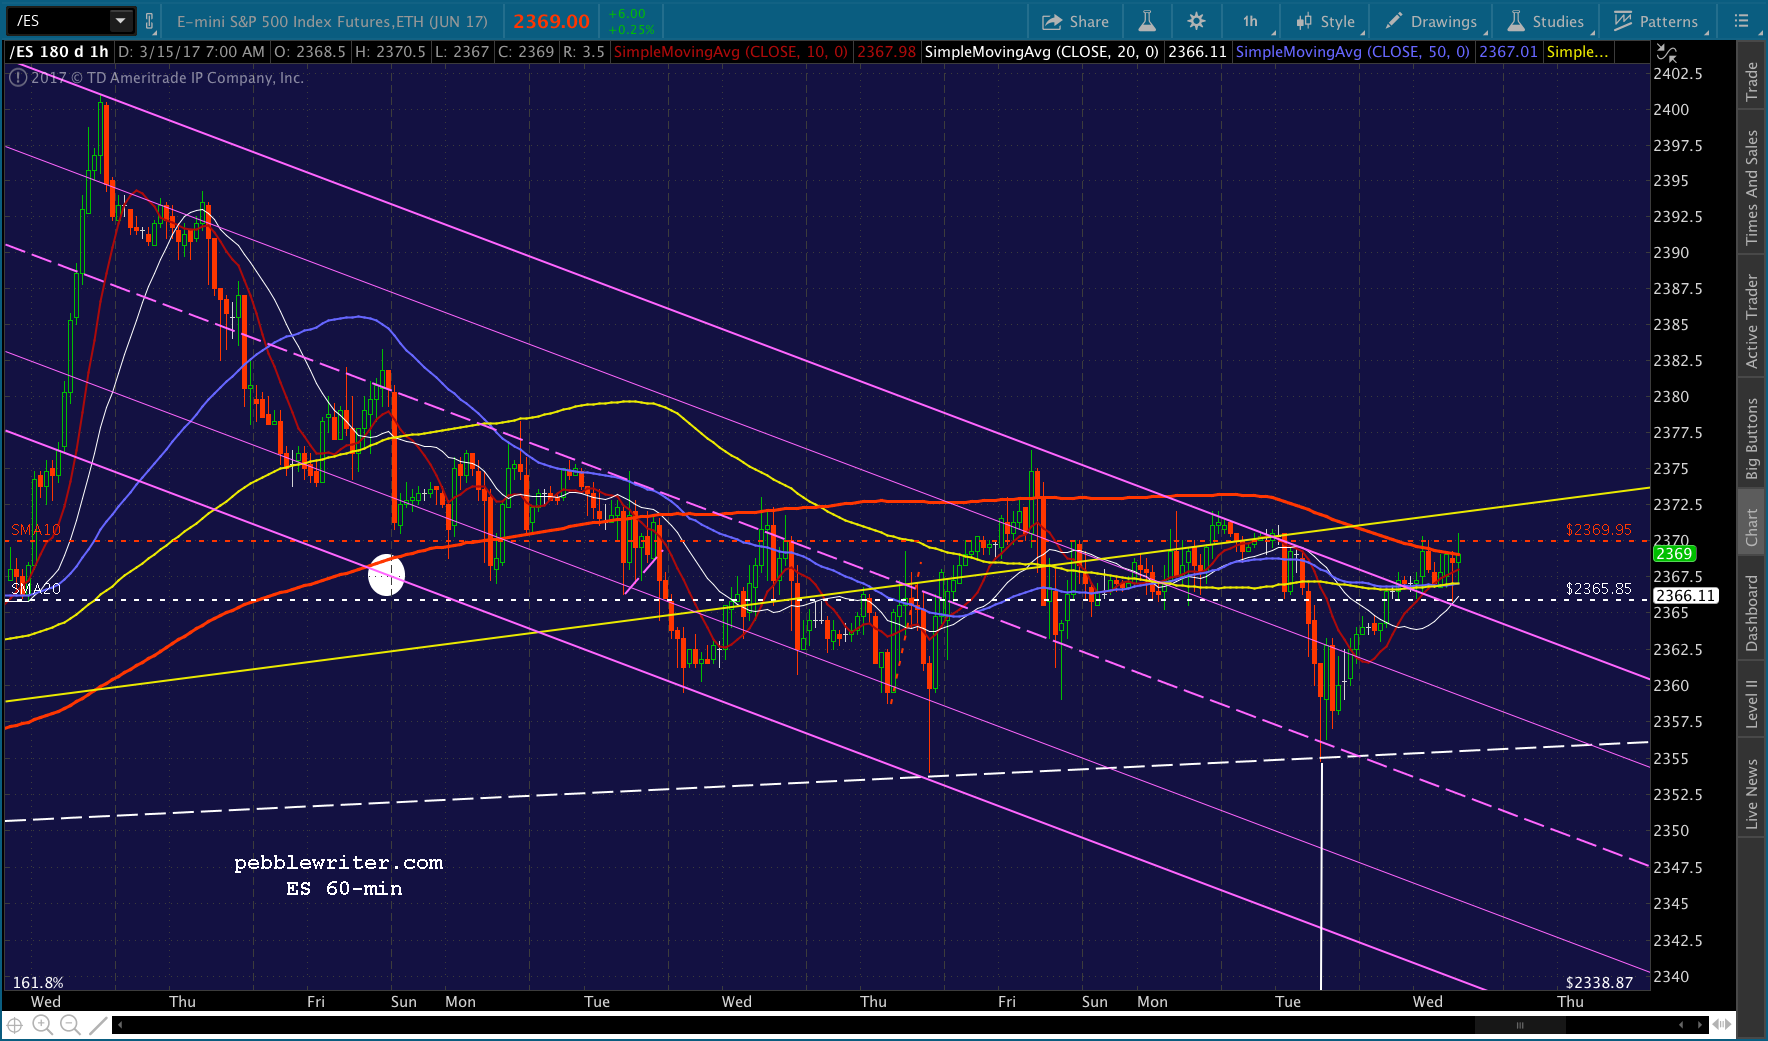
Futures didn’t budge on the data, but remain on the cusp of a break out from the falling channel they’ve been in for the past week.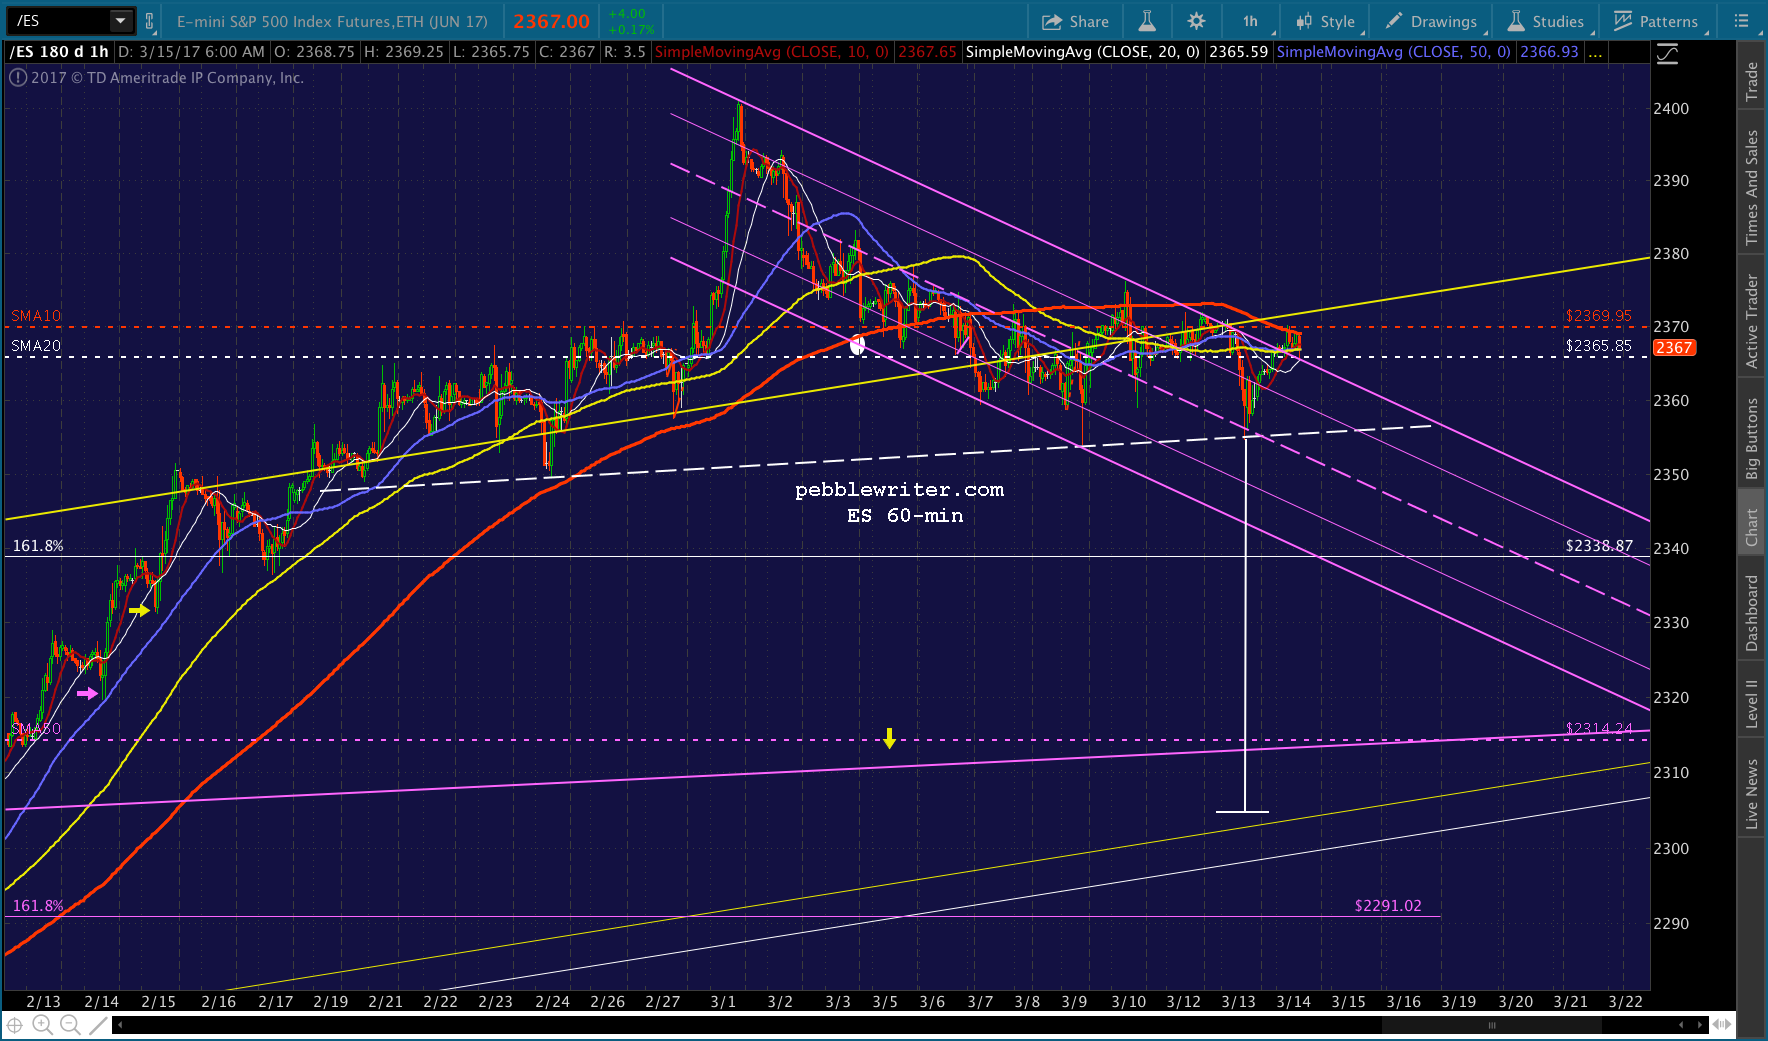
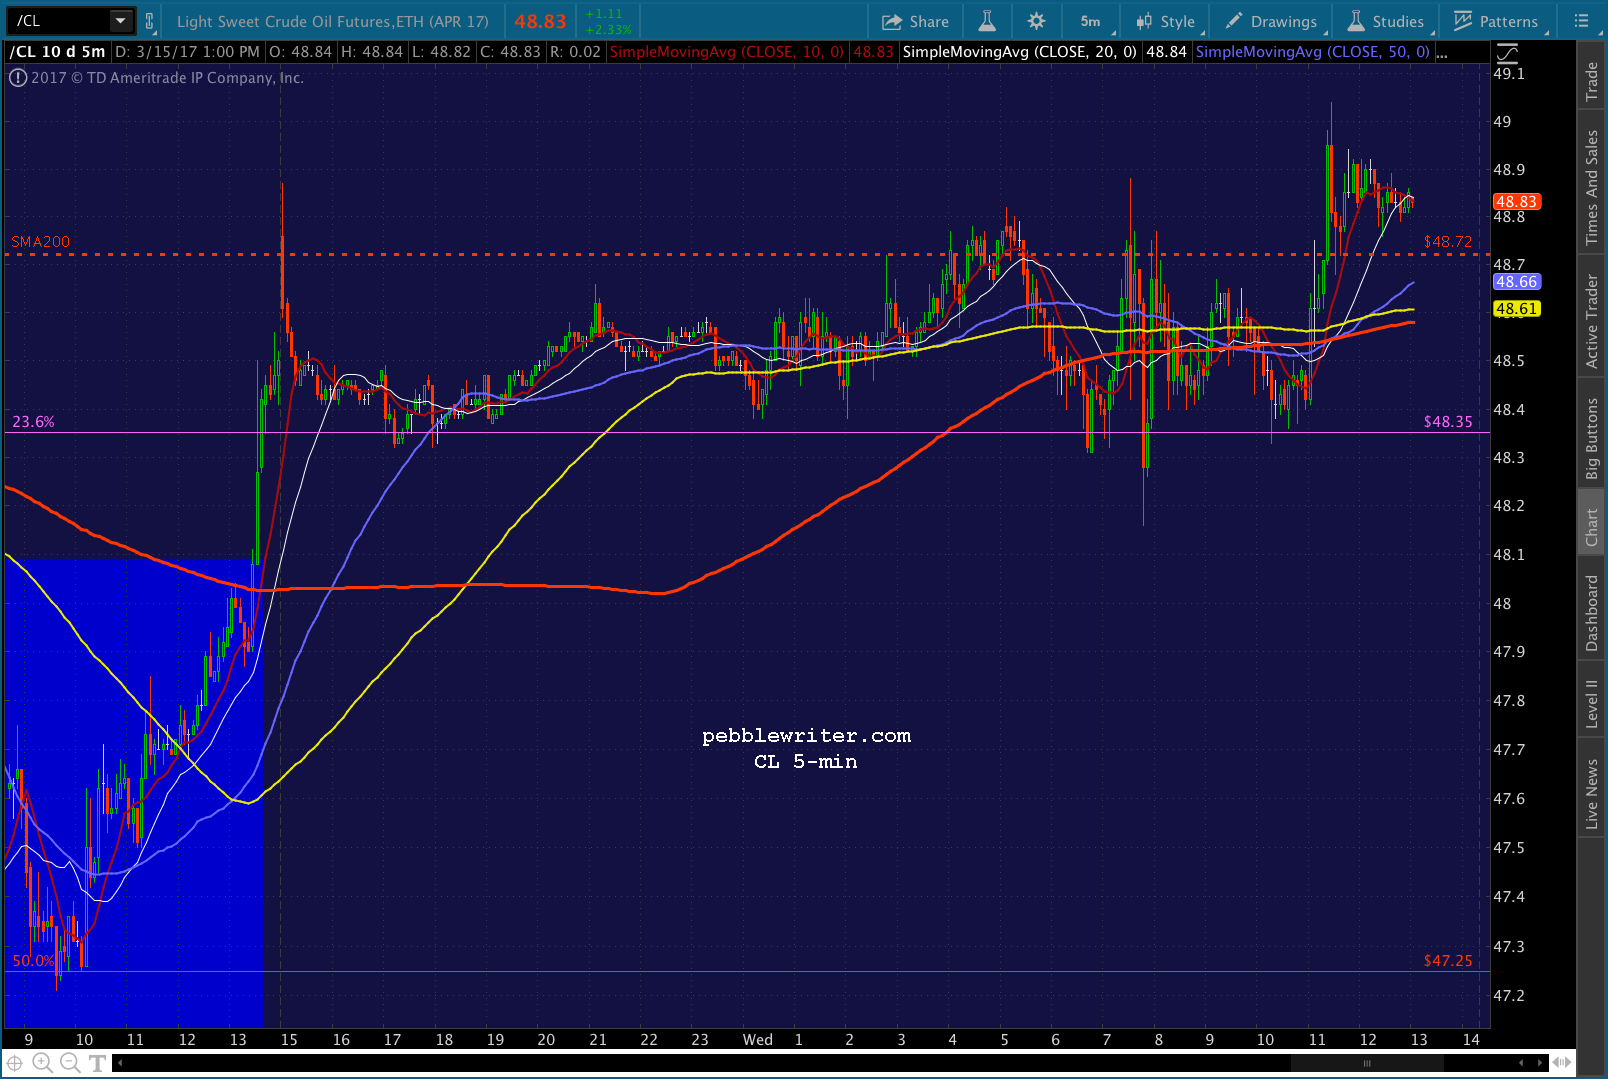
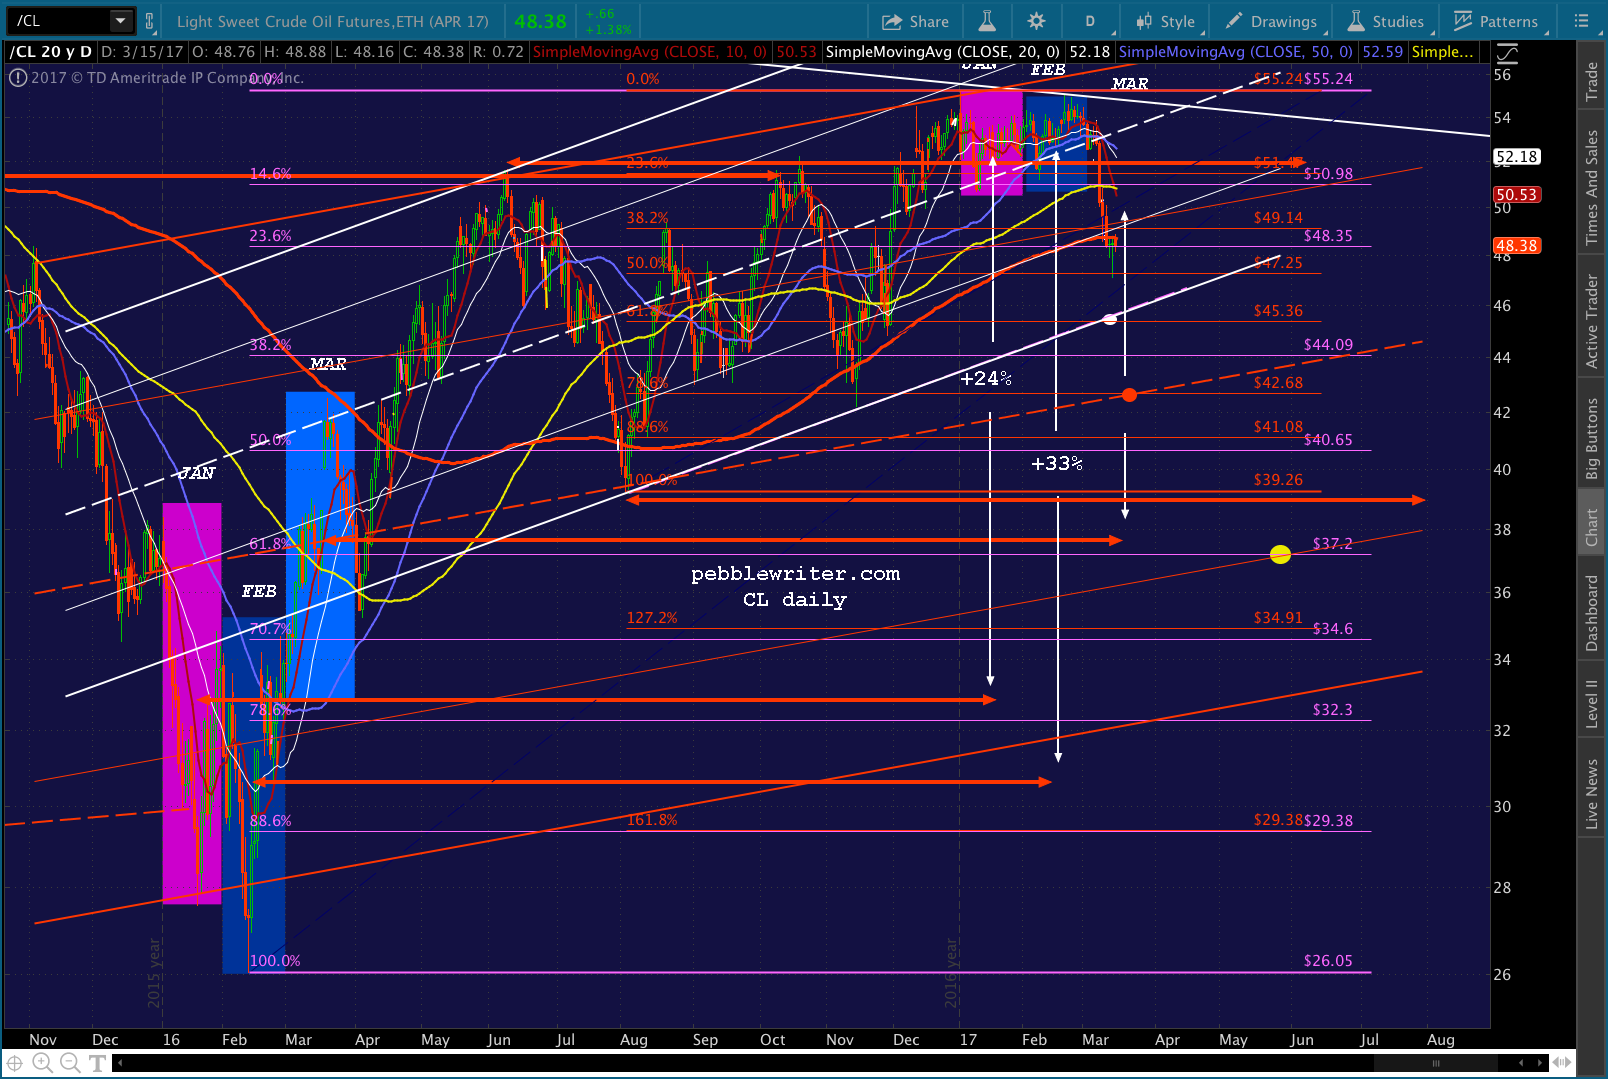
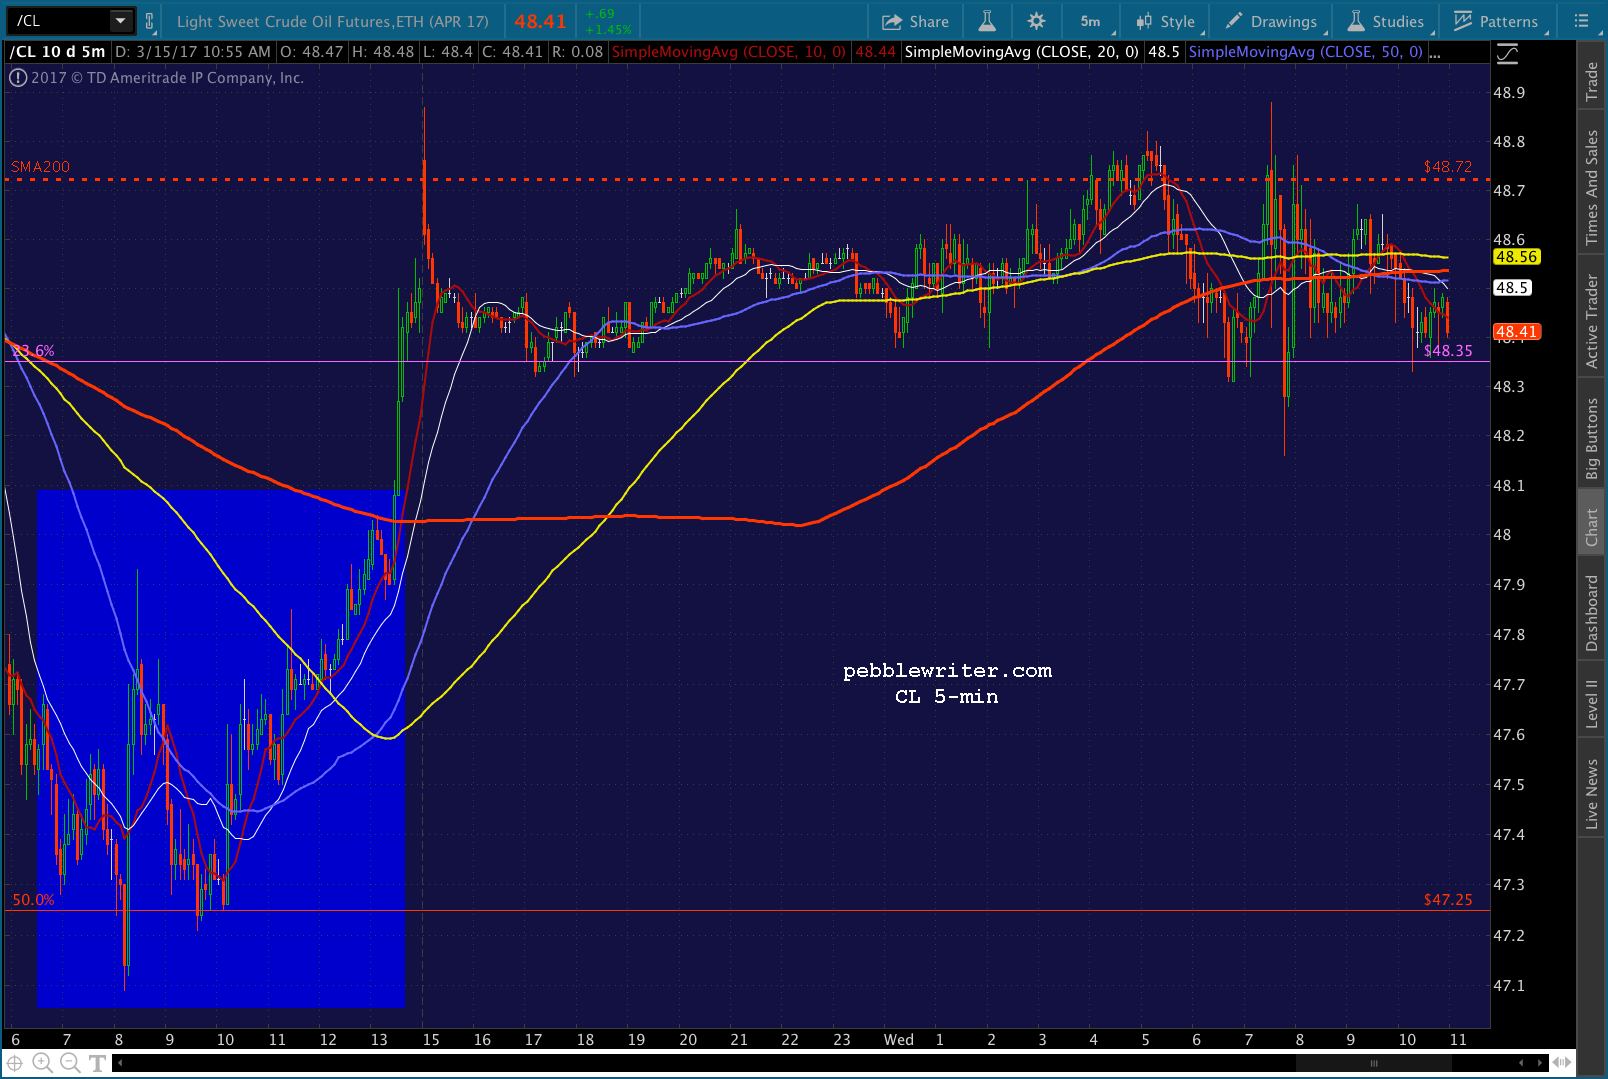
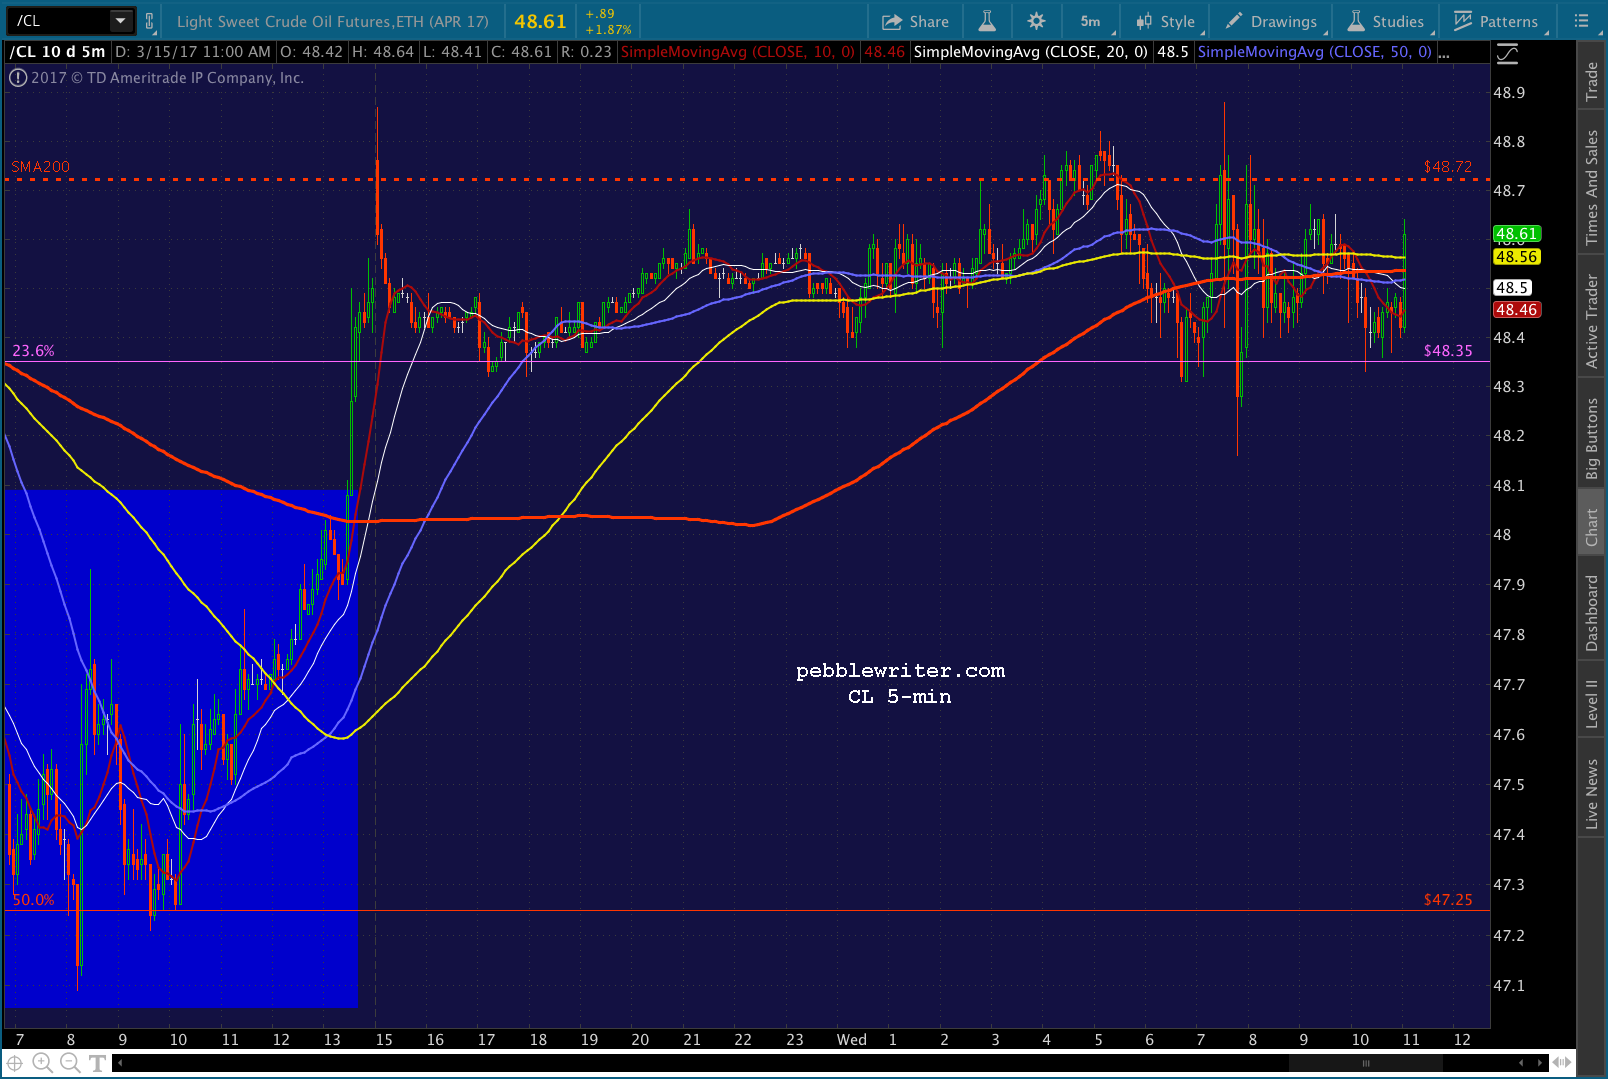
CL, itself, got a bounce after yesterday’s API data (just after the close) indicated a small draw, but has yet to push above its SMA200.
It’s in the dog house. And, after this morning’s CPI, should remain there. But, the EIA will report its version of inventories in an hour, so we’ll see.
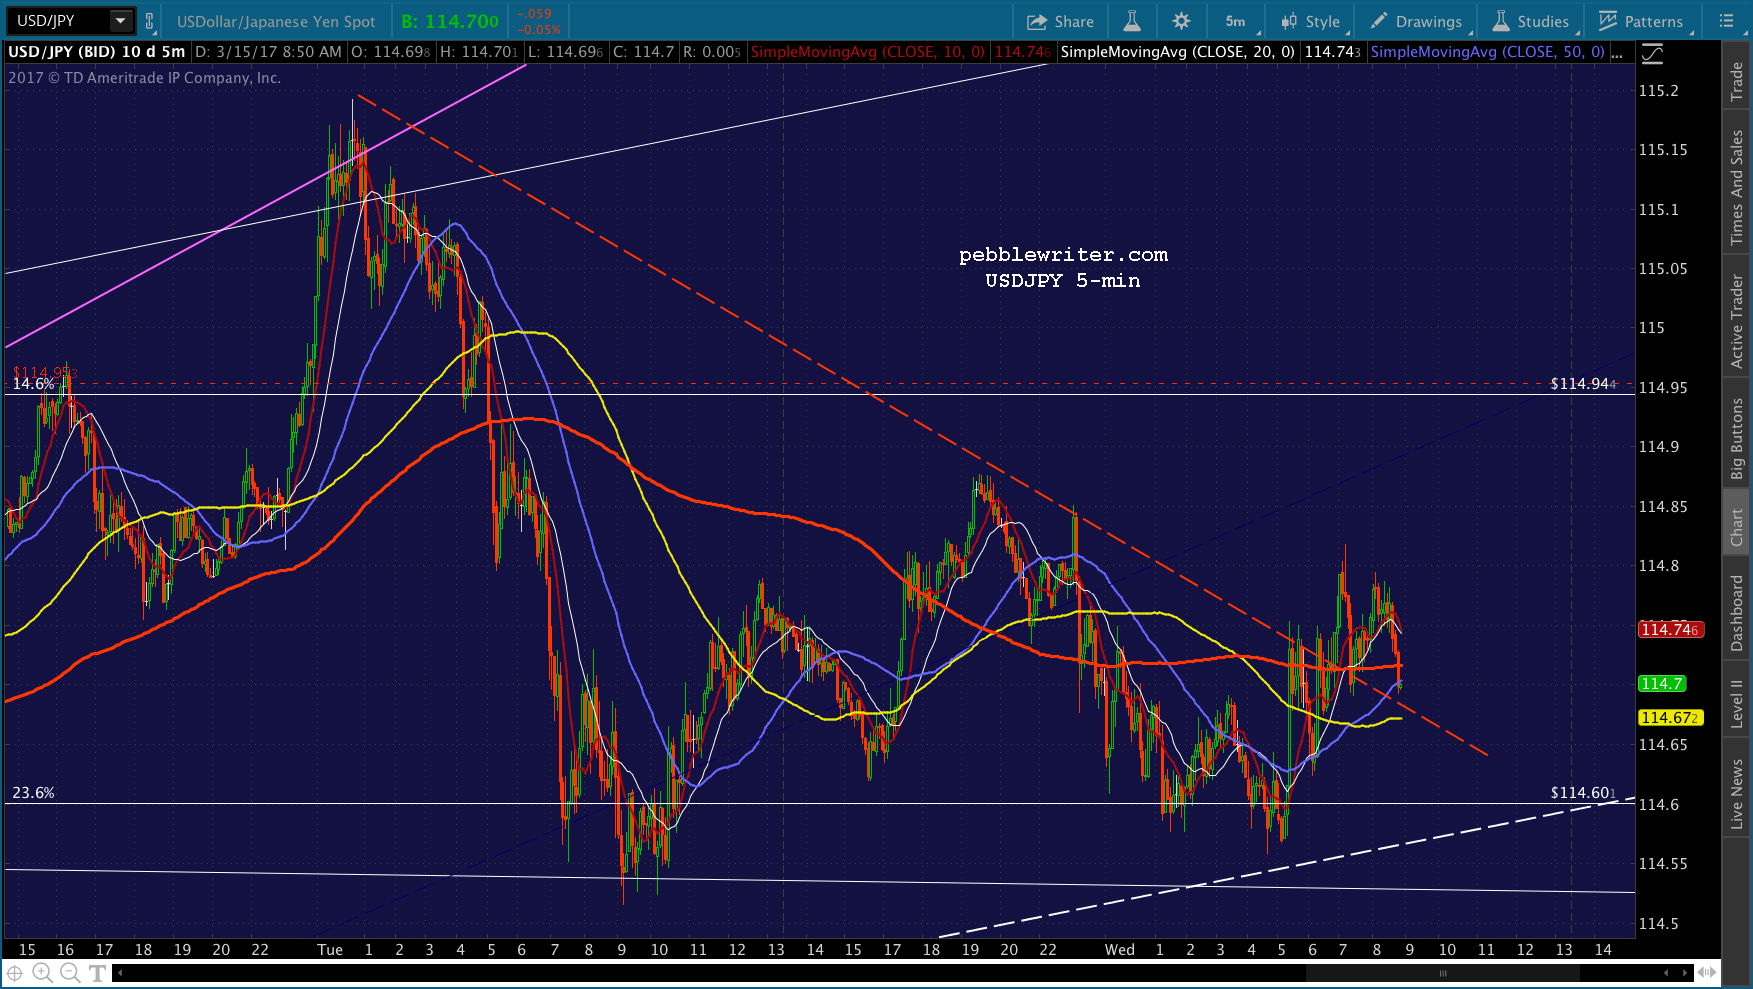
USDJPY has settled a little lower, bumping along the white channel midline but hinting at a possible spike down to the channel bottom after the FOMC announcement. Note that it has constructed a TL (red, dashed) from which it can break out whenever the mood strikes.
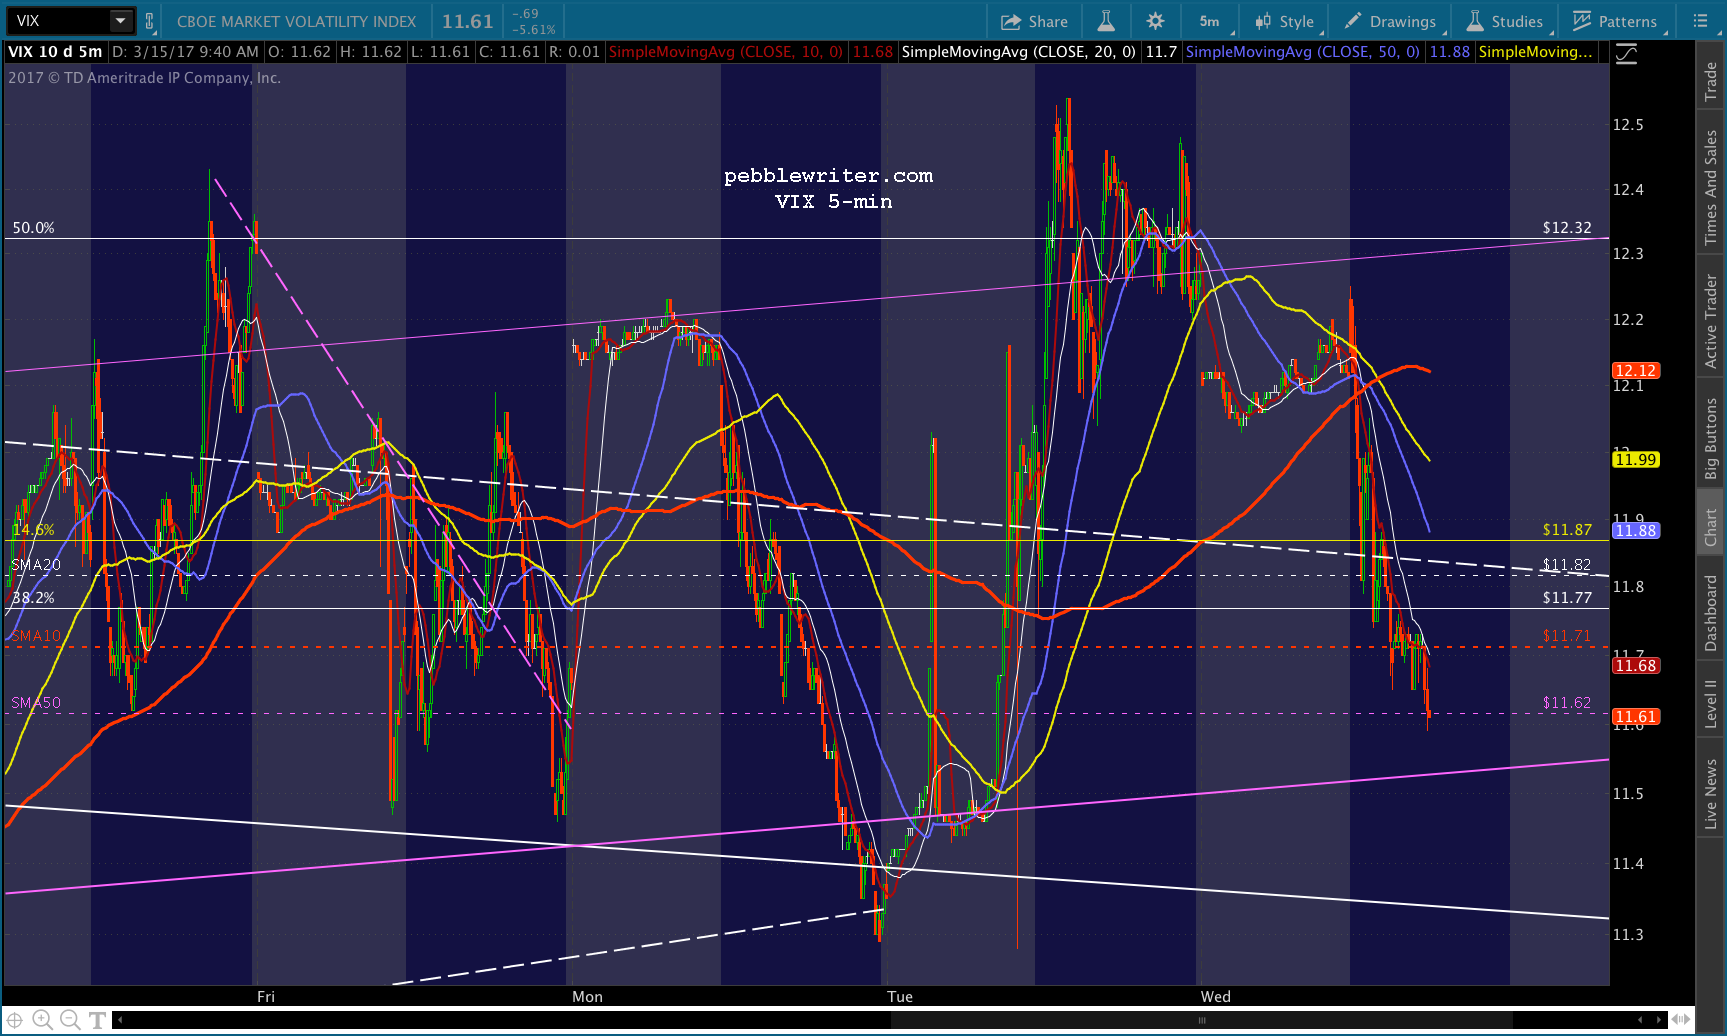
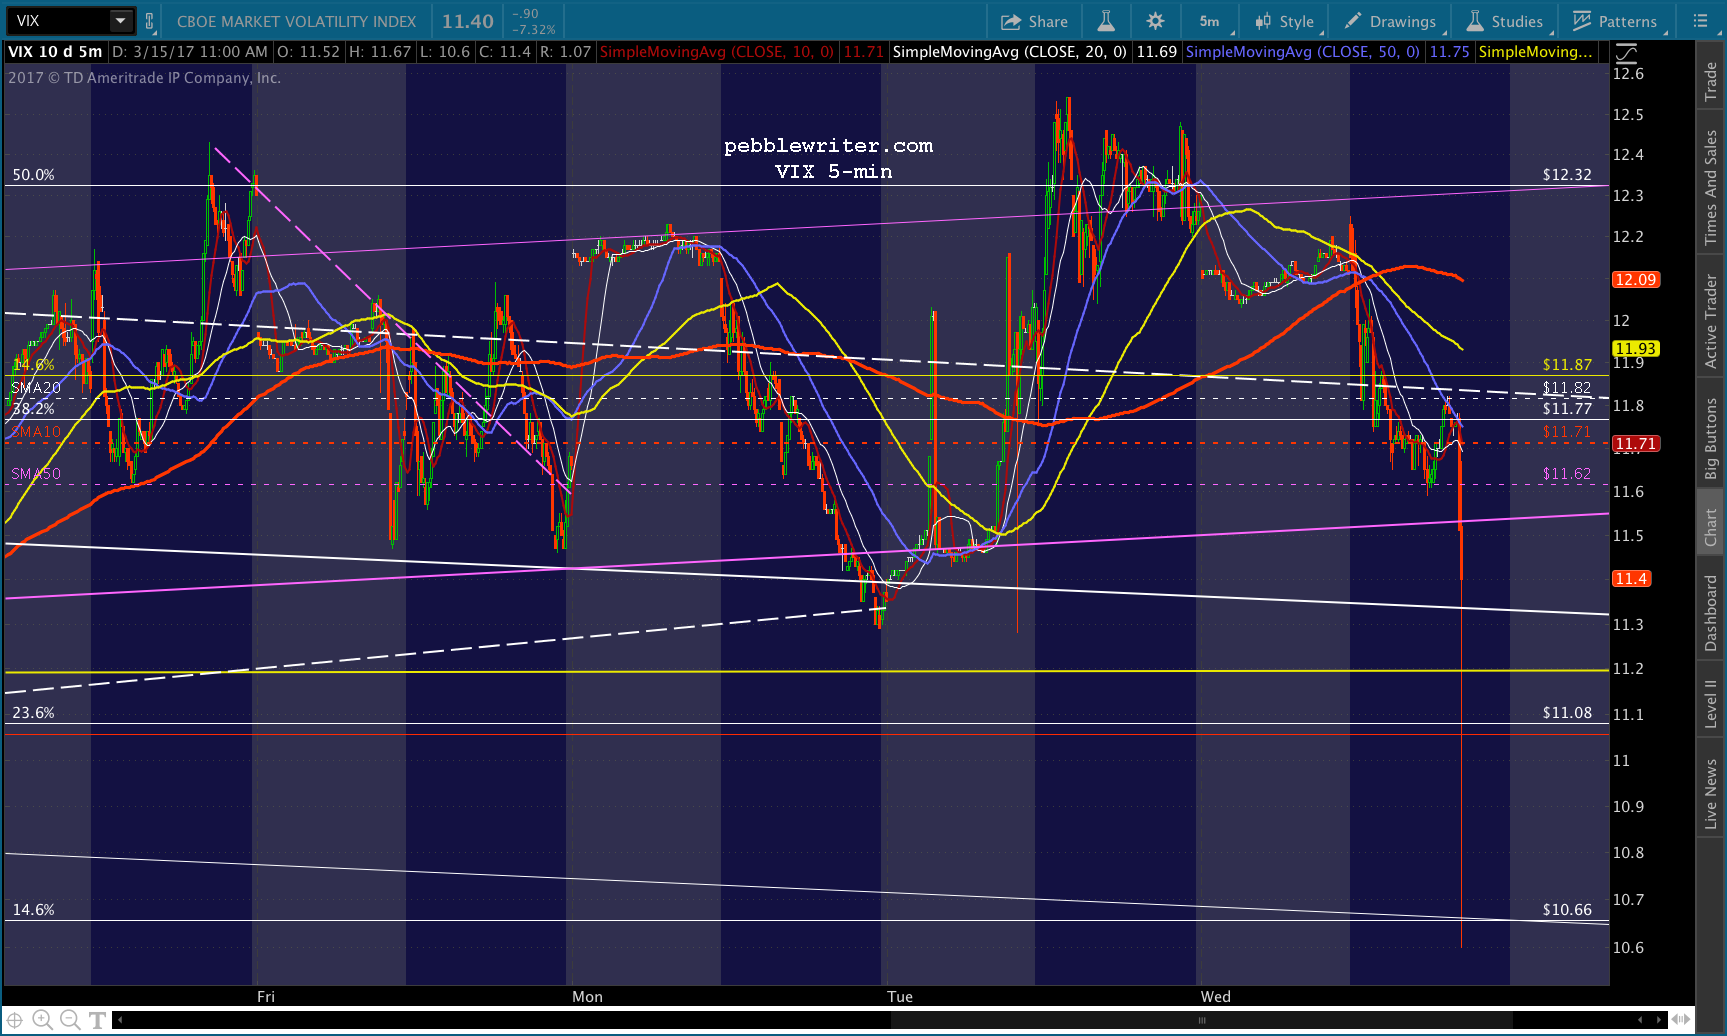
And, VIX is behaving itself, with the latest breakout only partially unwoven overnight.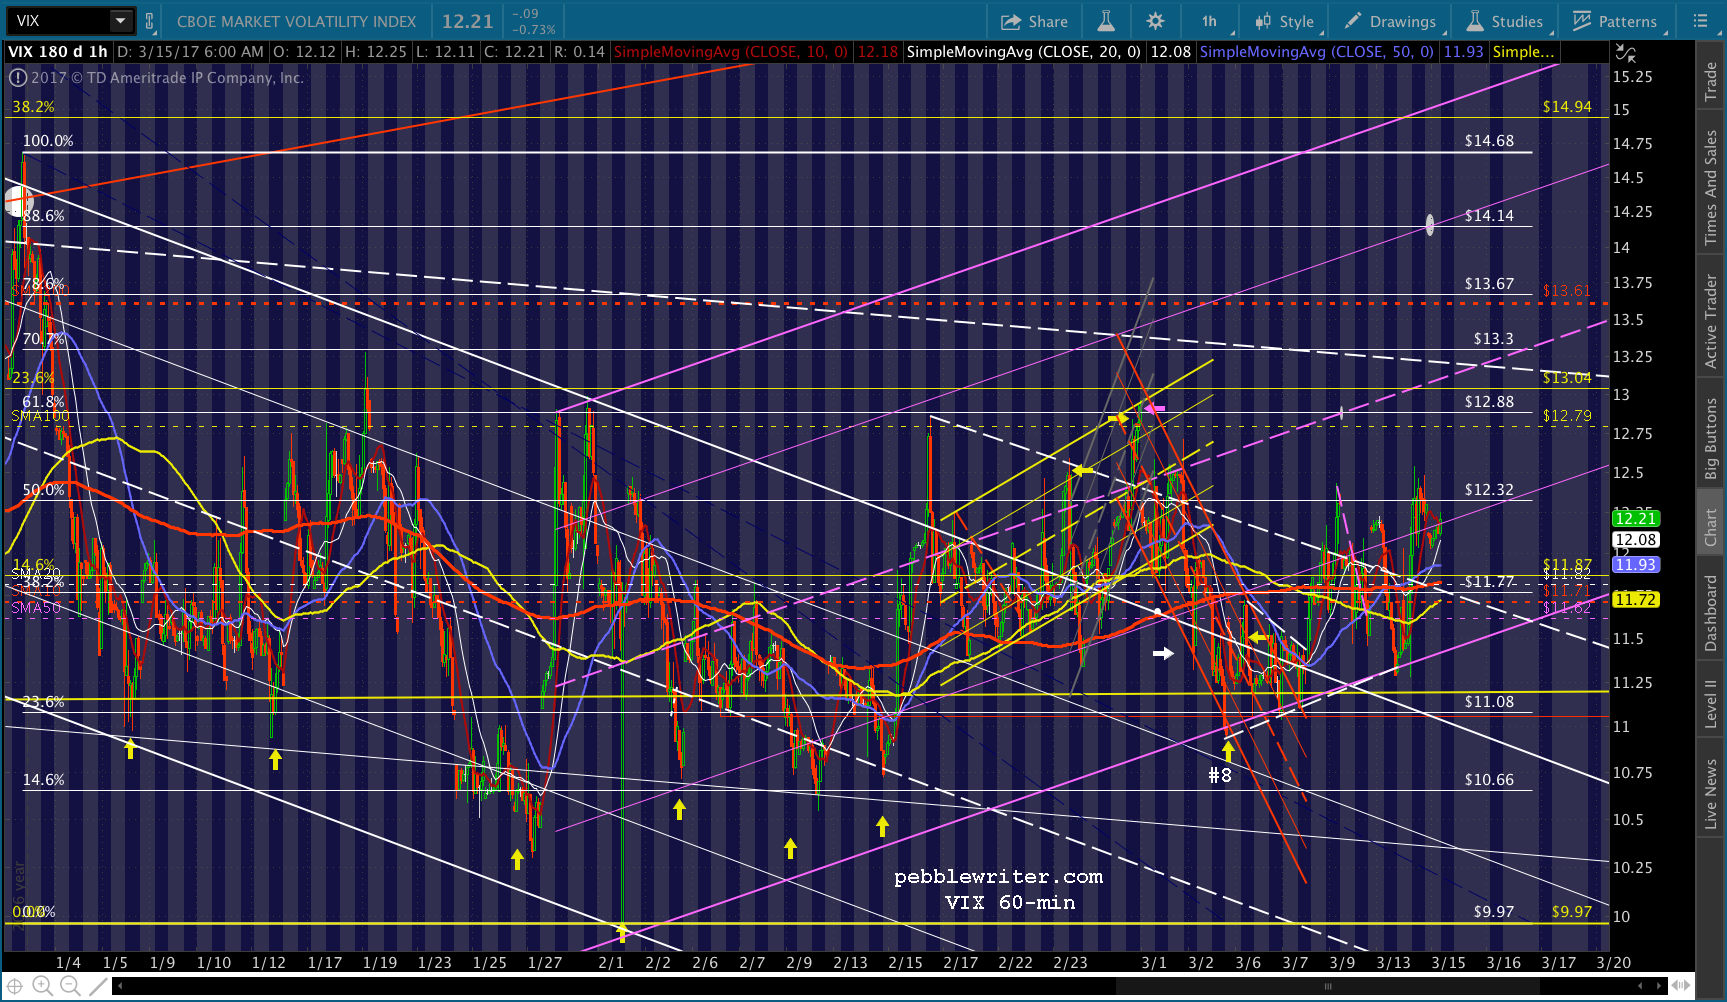
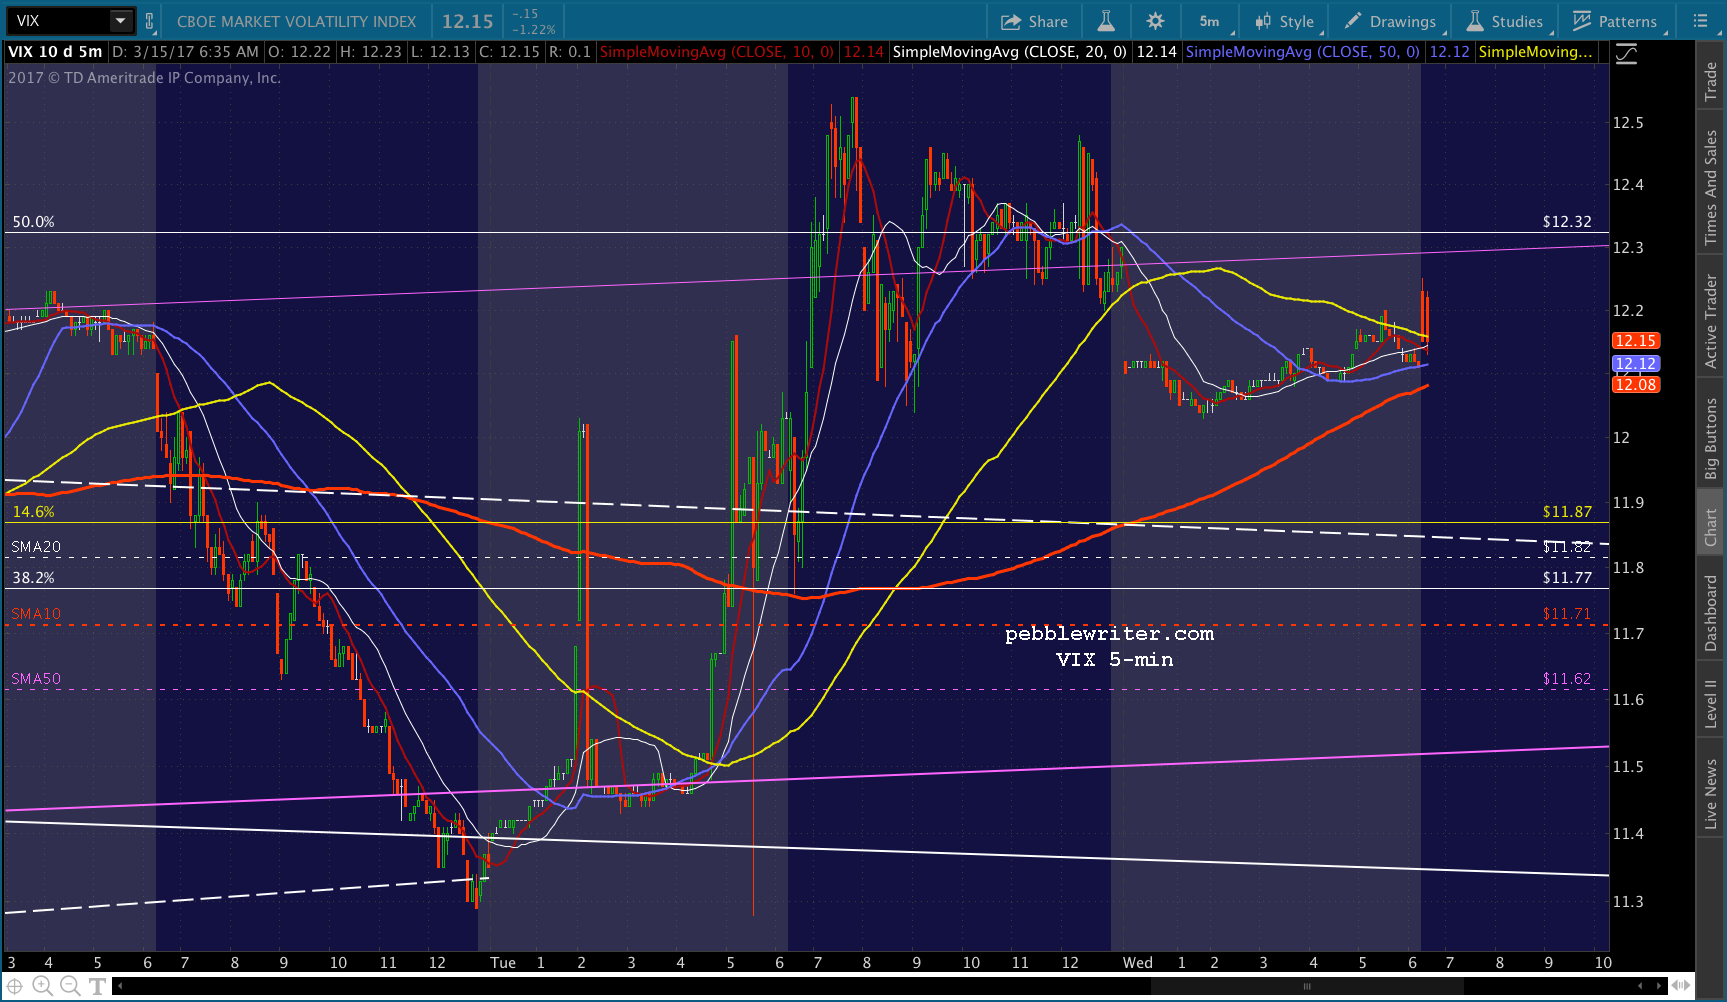
It was just enough that, along with CL, it supported the futures’ 4-5 pt bump overnight. But, CL shouldn’t recover any time soon — leaving VIX and USDJPY to levitate stocks if/when they need it.
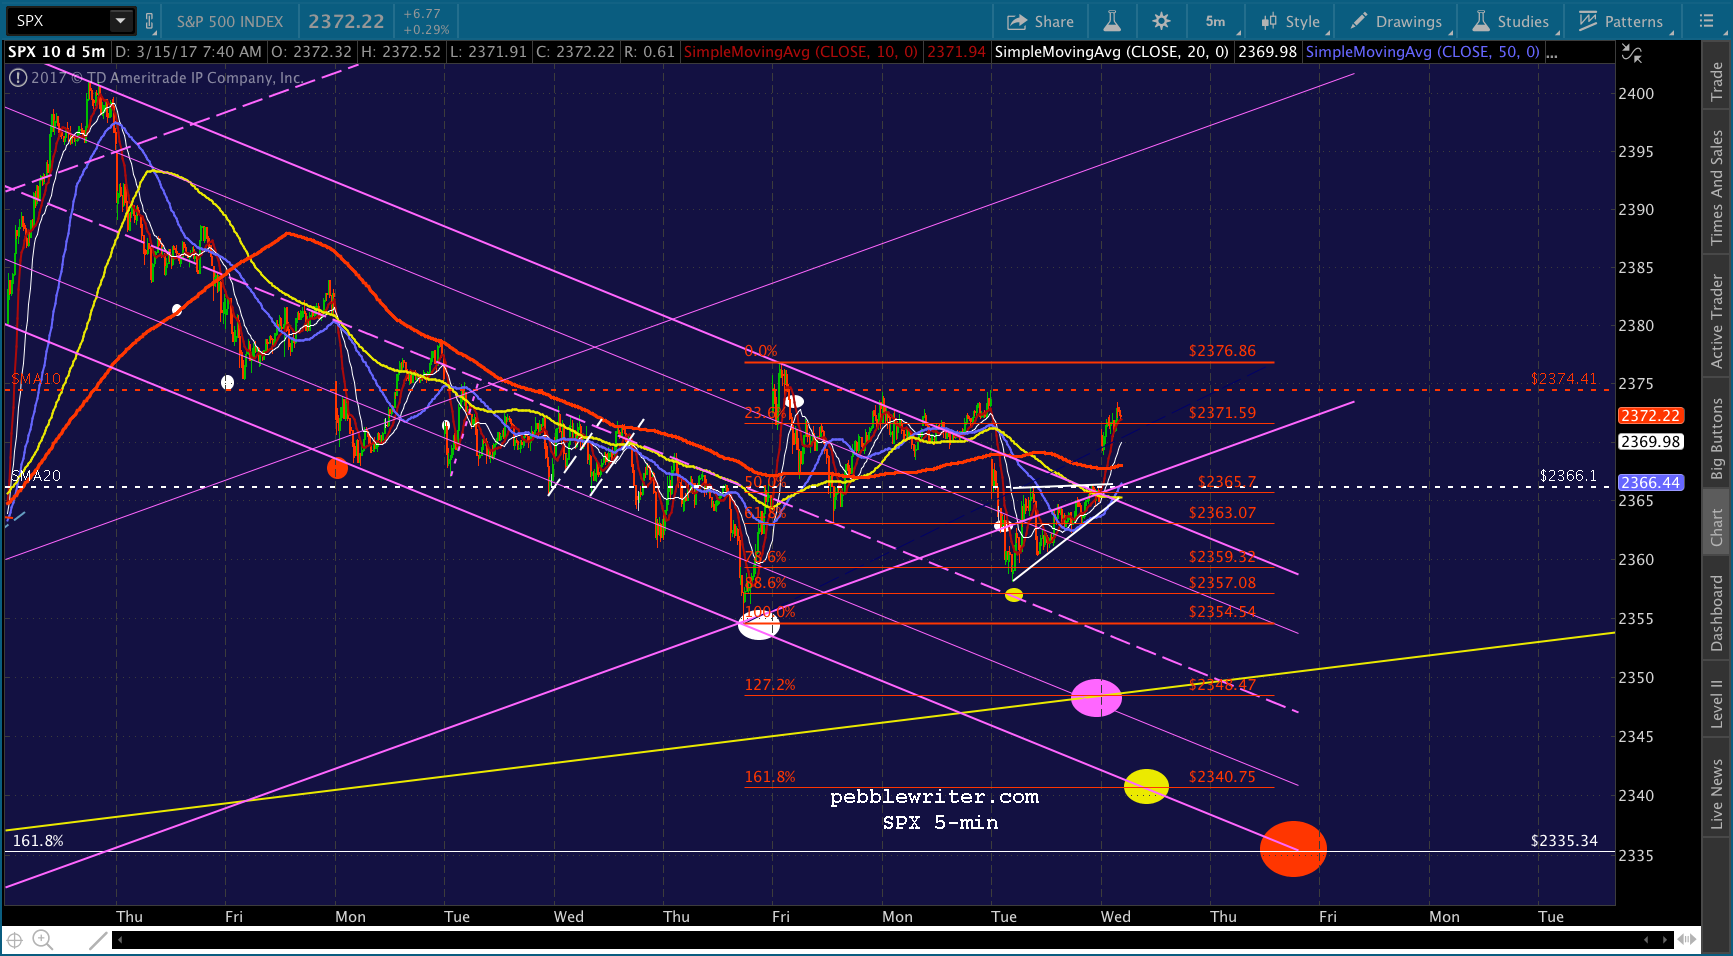
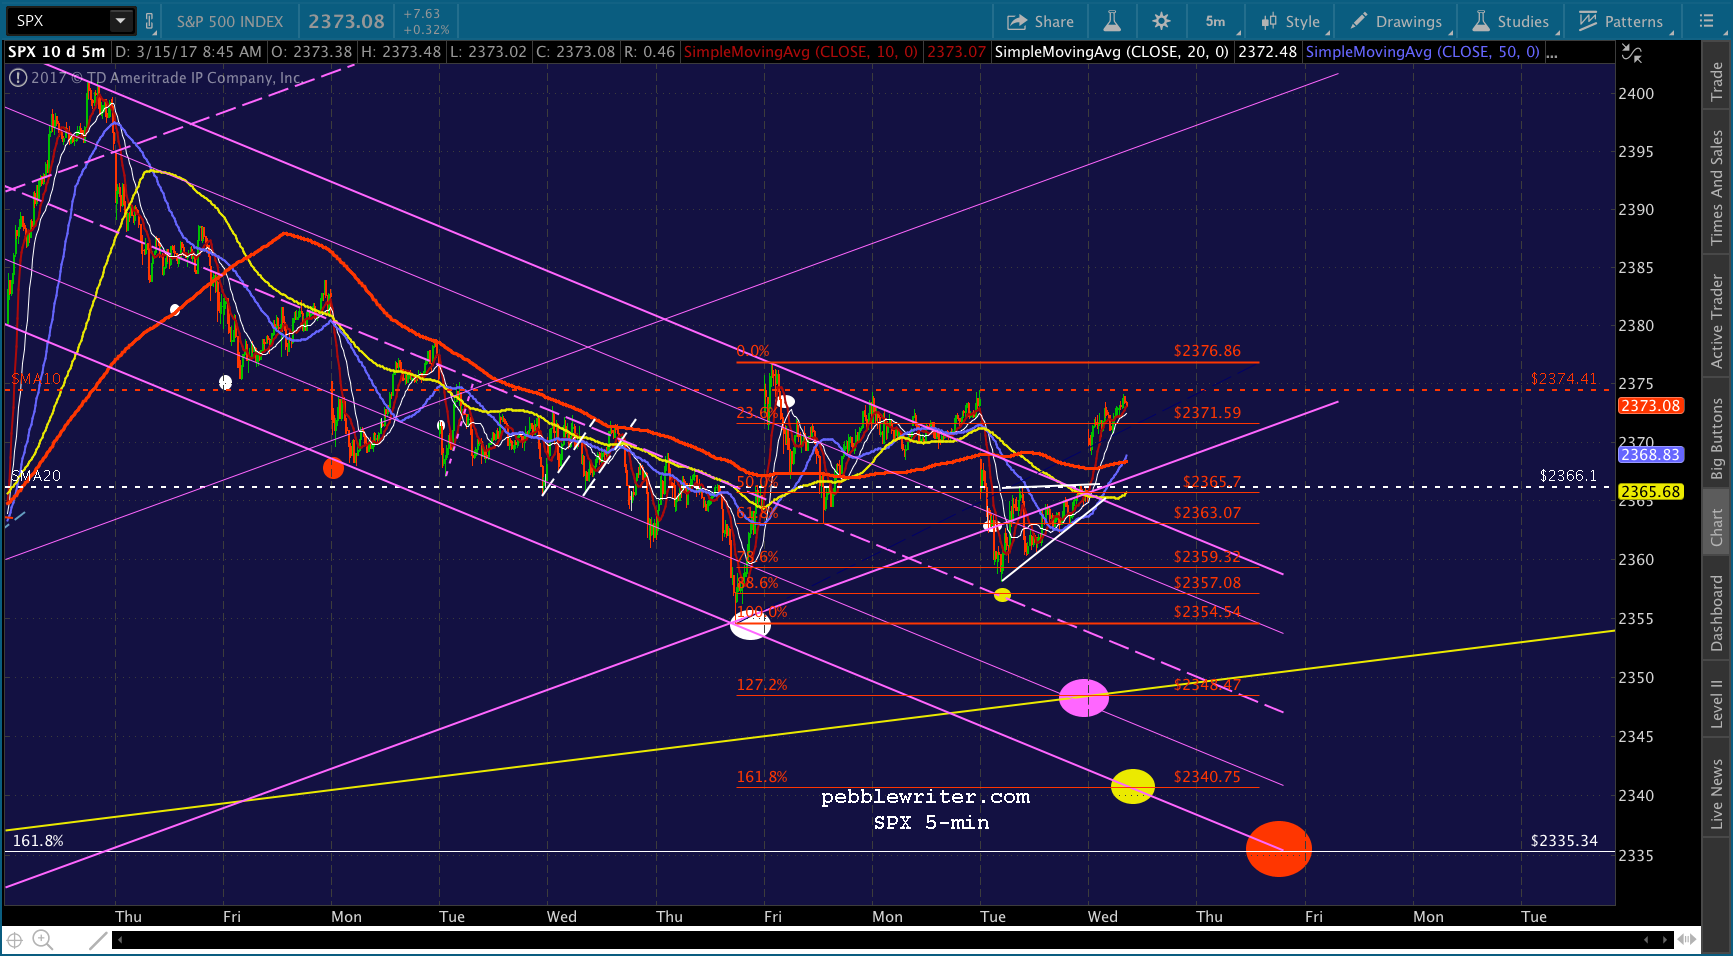
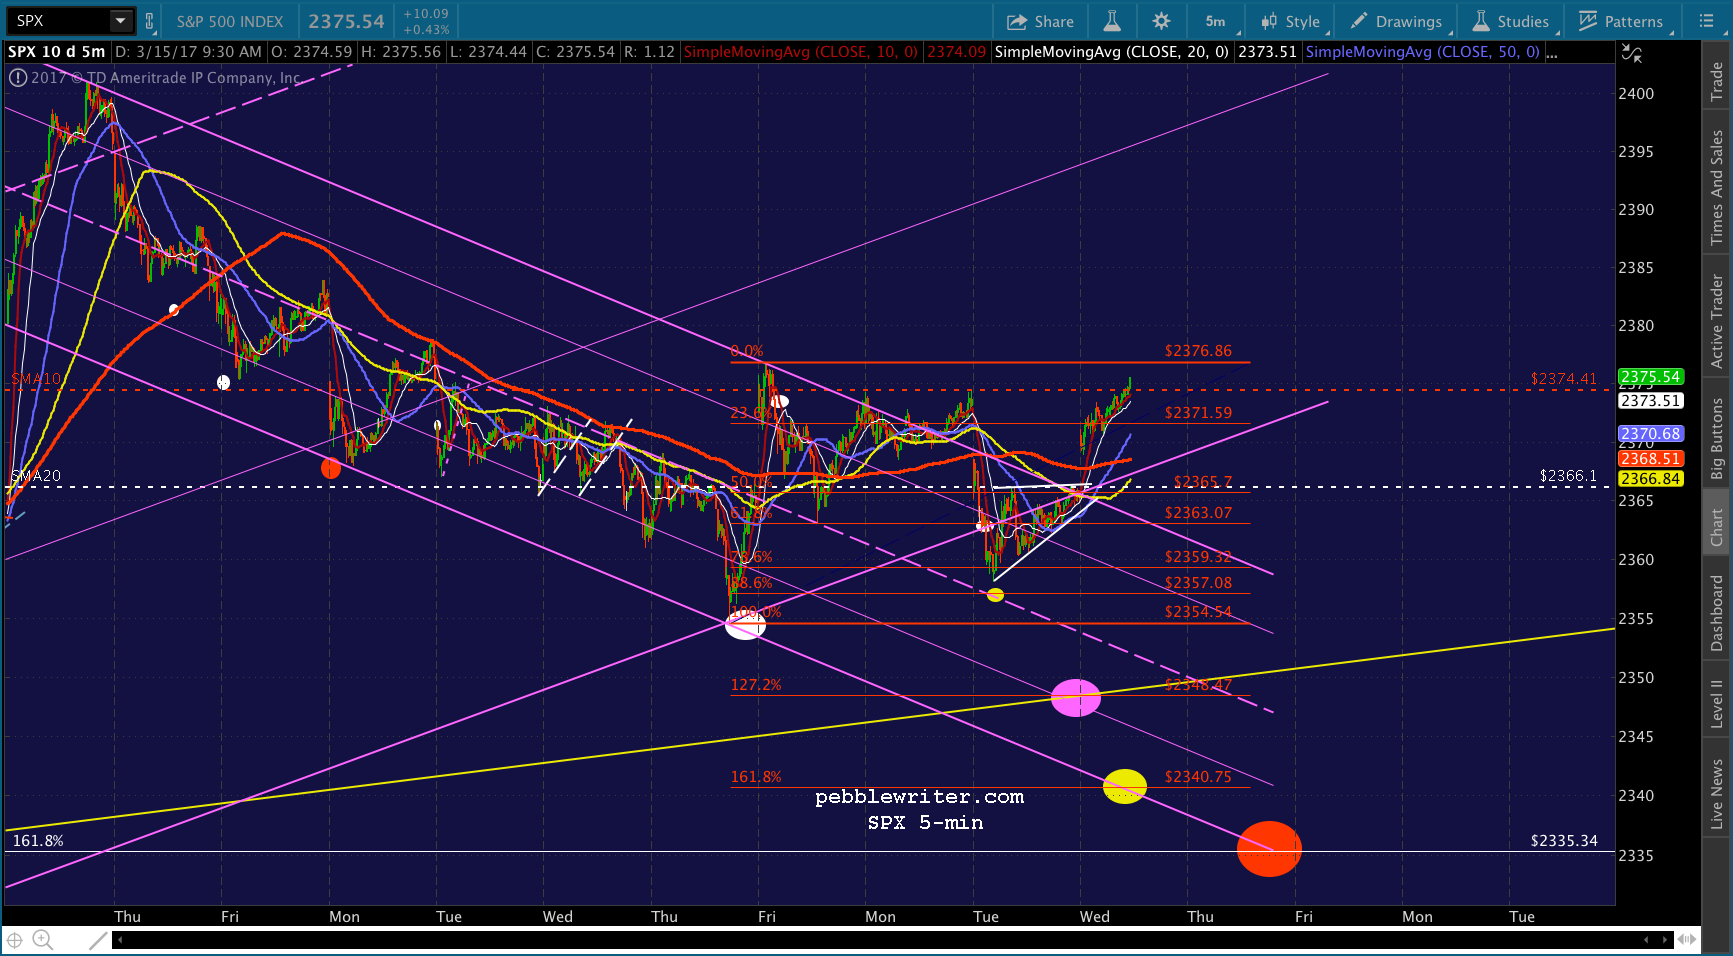
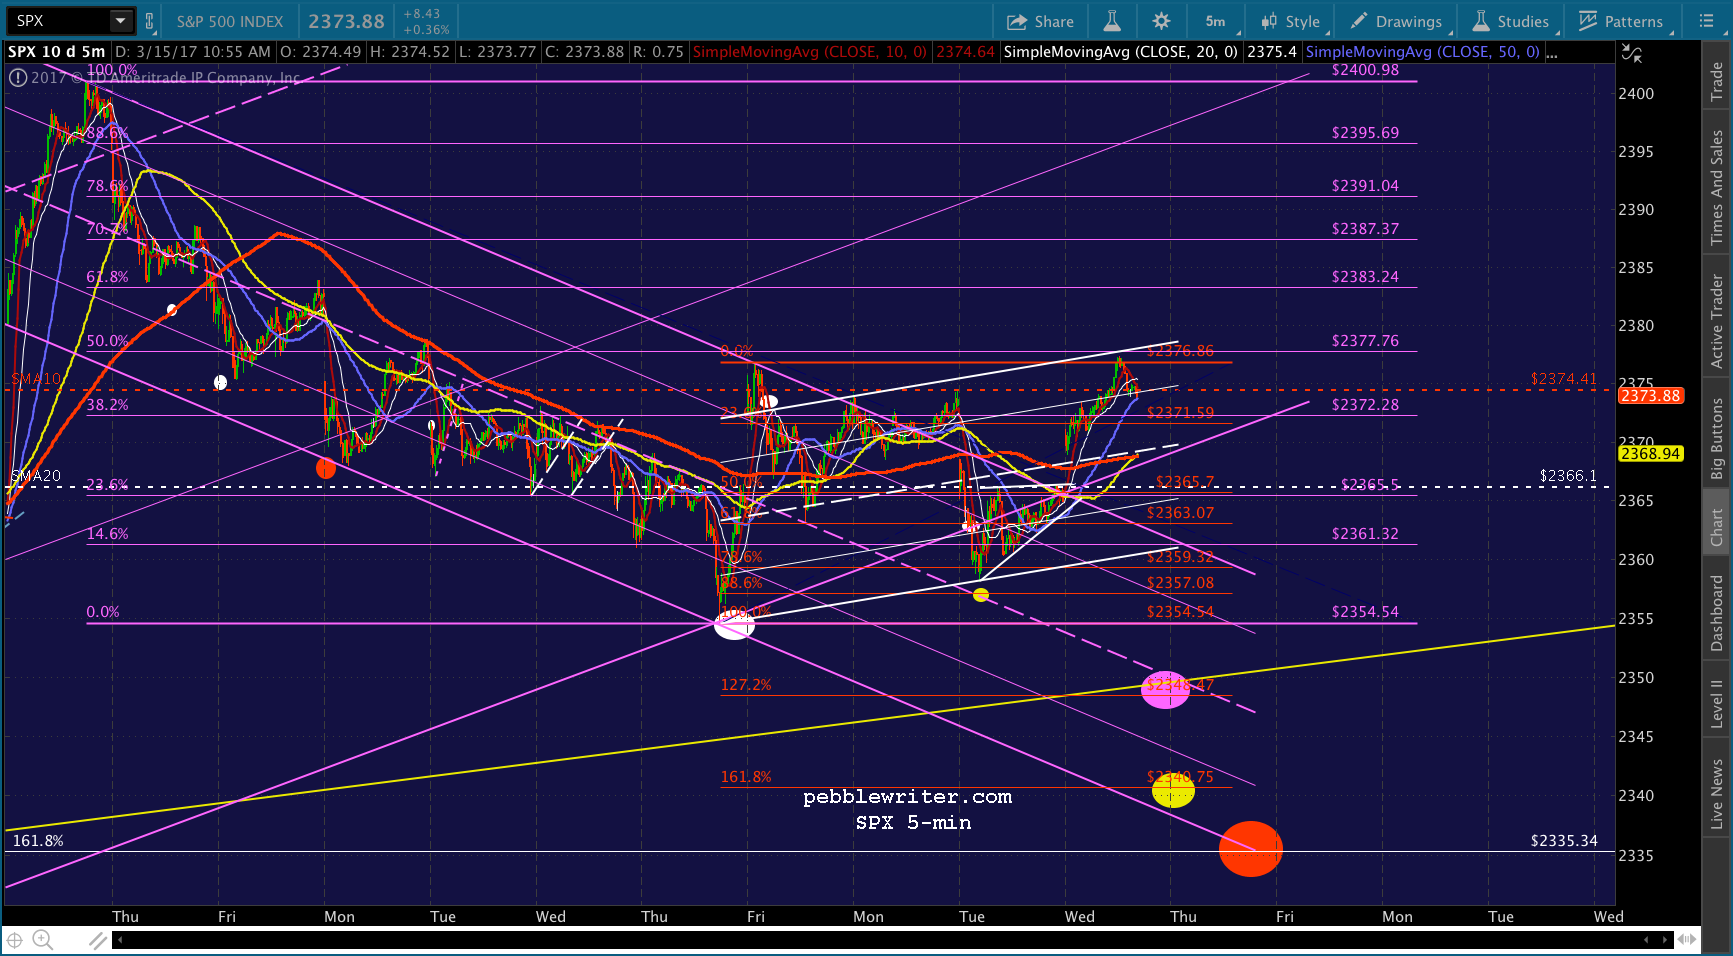
Yesterday’s close in SPX left it on the cusp of a break out.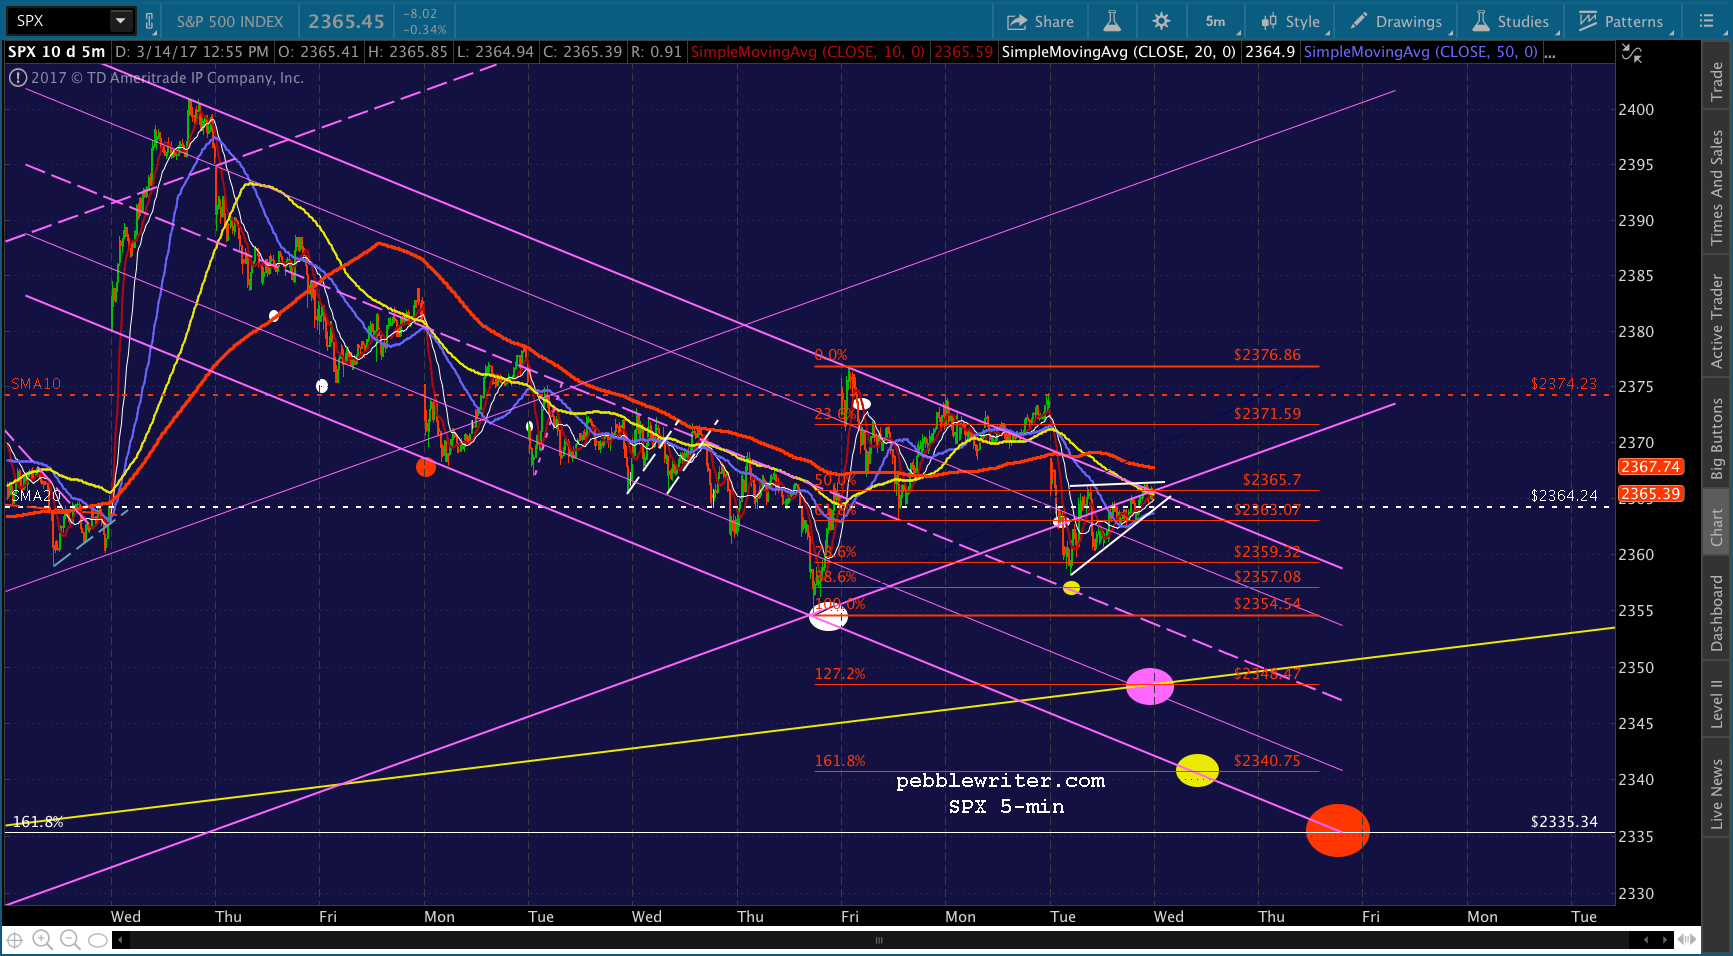
This morning, we can see that the overnight ramp job produced one. But, it’s not exactly built on a strong foundation.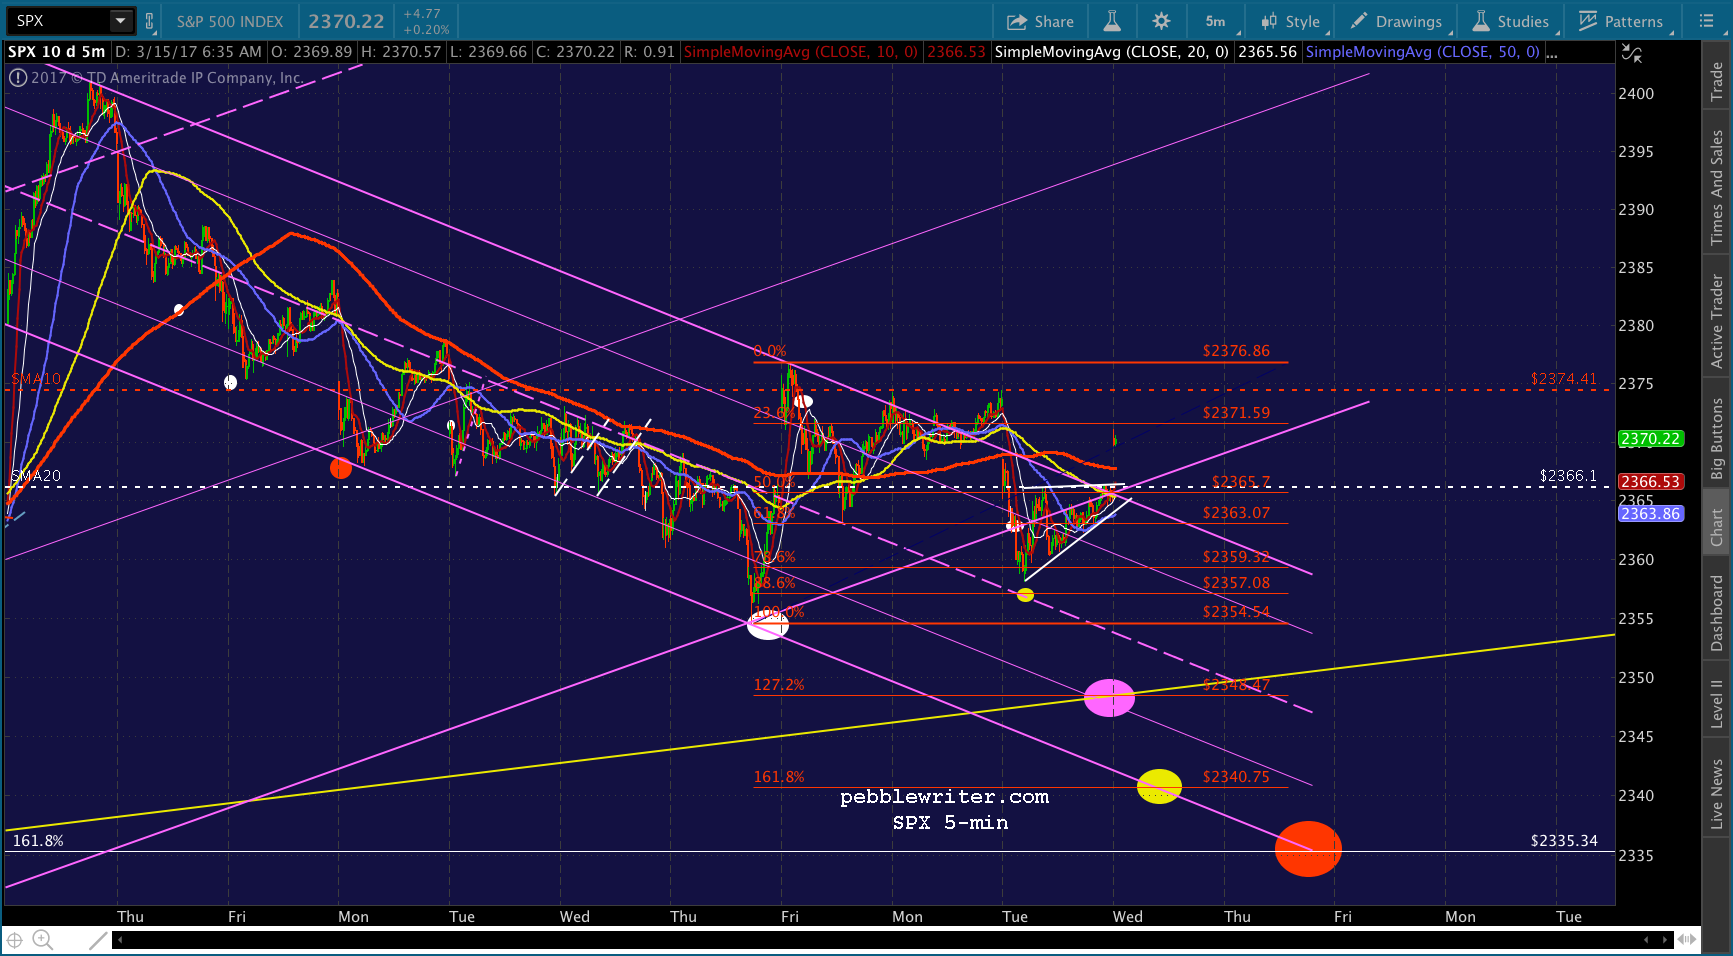
This morning’s EIA report will be interesting. Will it confirm API’s slight draw, or will it follow the narrative that the Fed needs it to — the one that will reduce the pressure to increase rates further?
UPDATE: 10:38 AM
The EIA report showed a very slight draw in crude, – 0.1% from the previous week. Gasoline inventories were off 1.2%.  So far, CL seems unaffected — holding just below the SMA200 after a brief push above.
USDJPY has backtested the red TL and is waiting for a signal to lurch higher.
While VIX has single-handedly propped stocks at the morning highs.
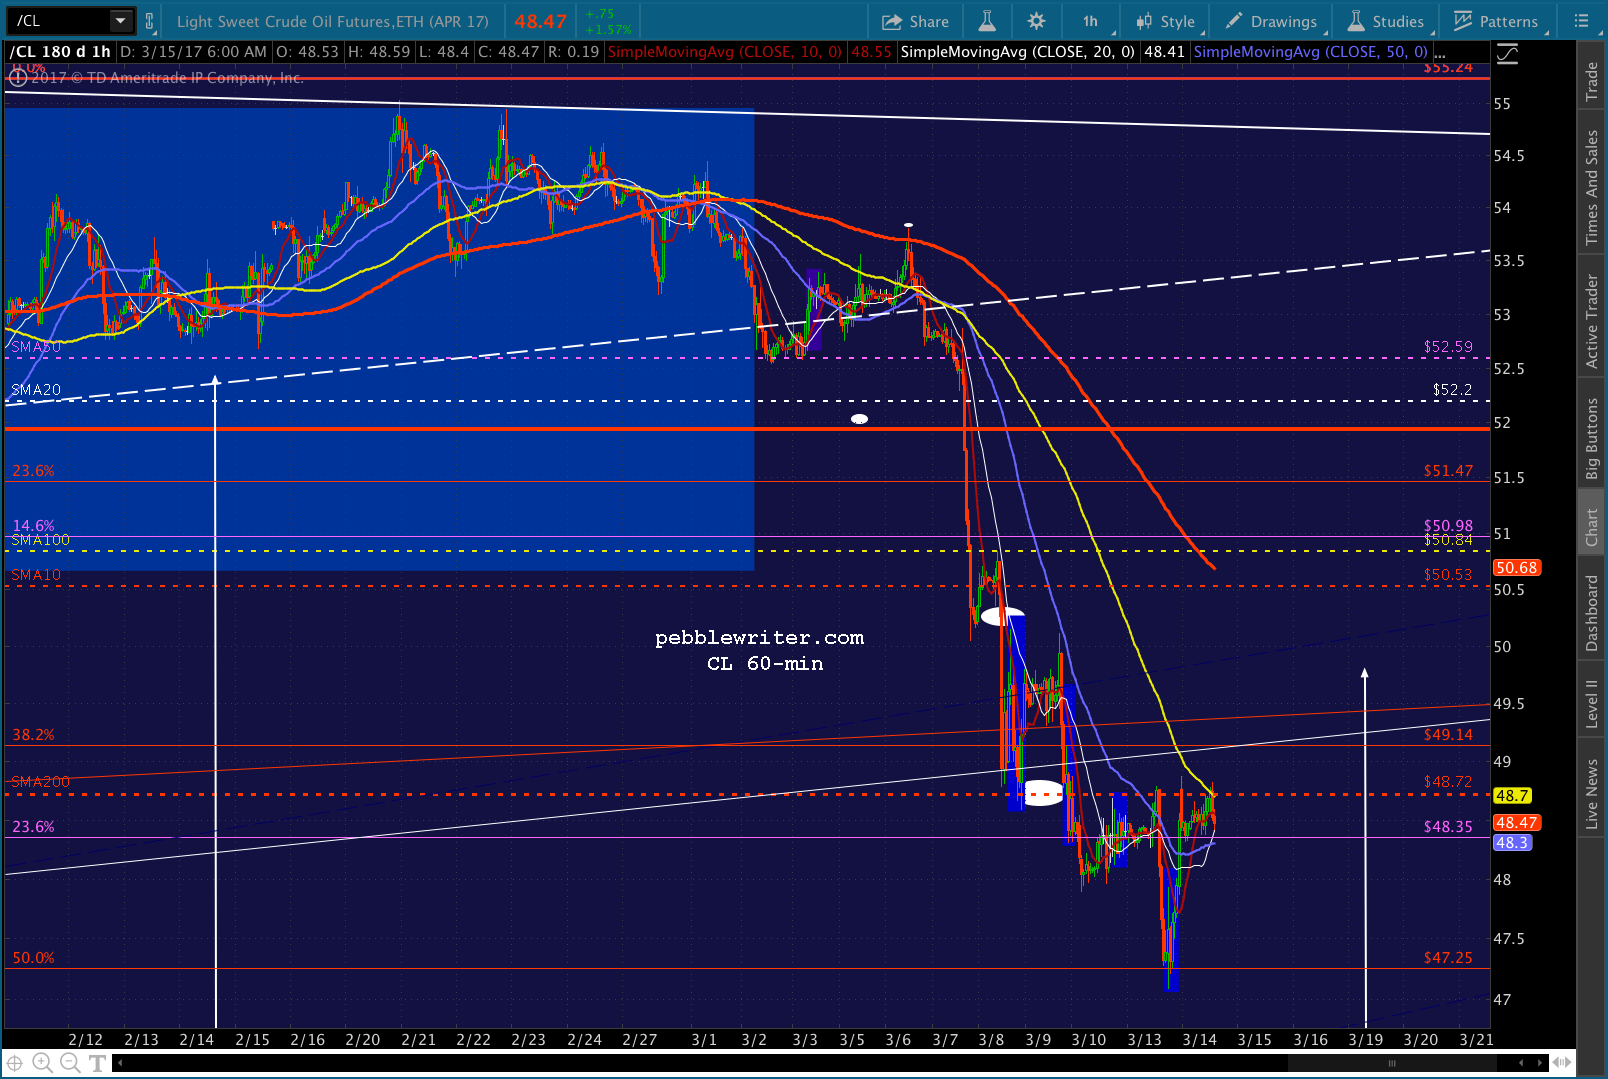
Bottom line — the report wasn’t enough to push CL past important resistance. And, since TPTB need CL to shed a few more points, we should see the failure to break out as reiterating our bearish outlook for oil and gas.
UPDATE: 11:29 AM
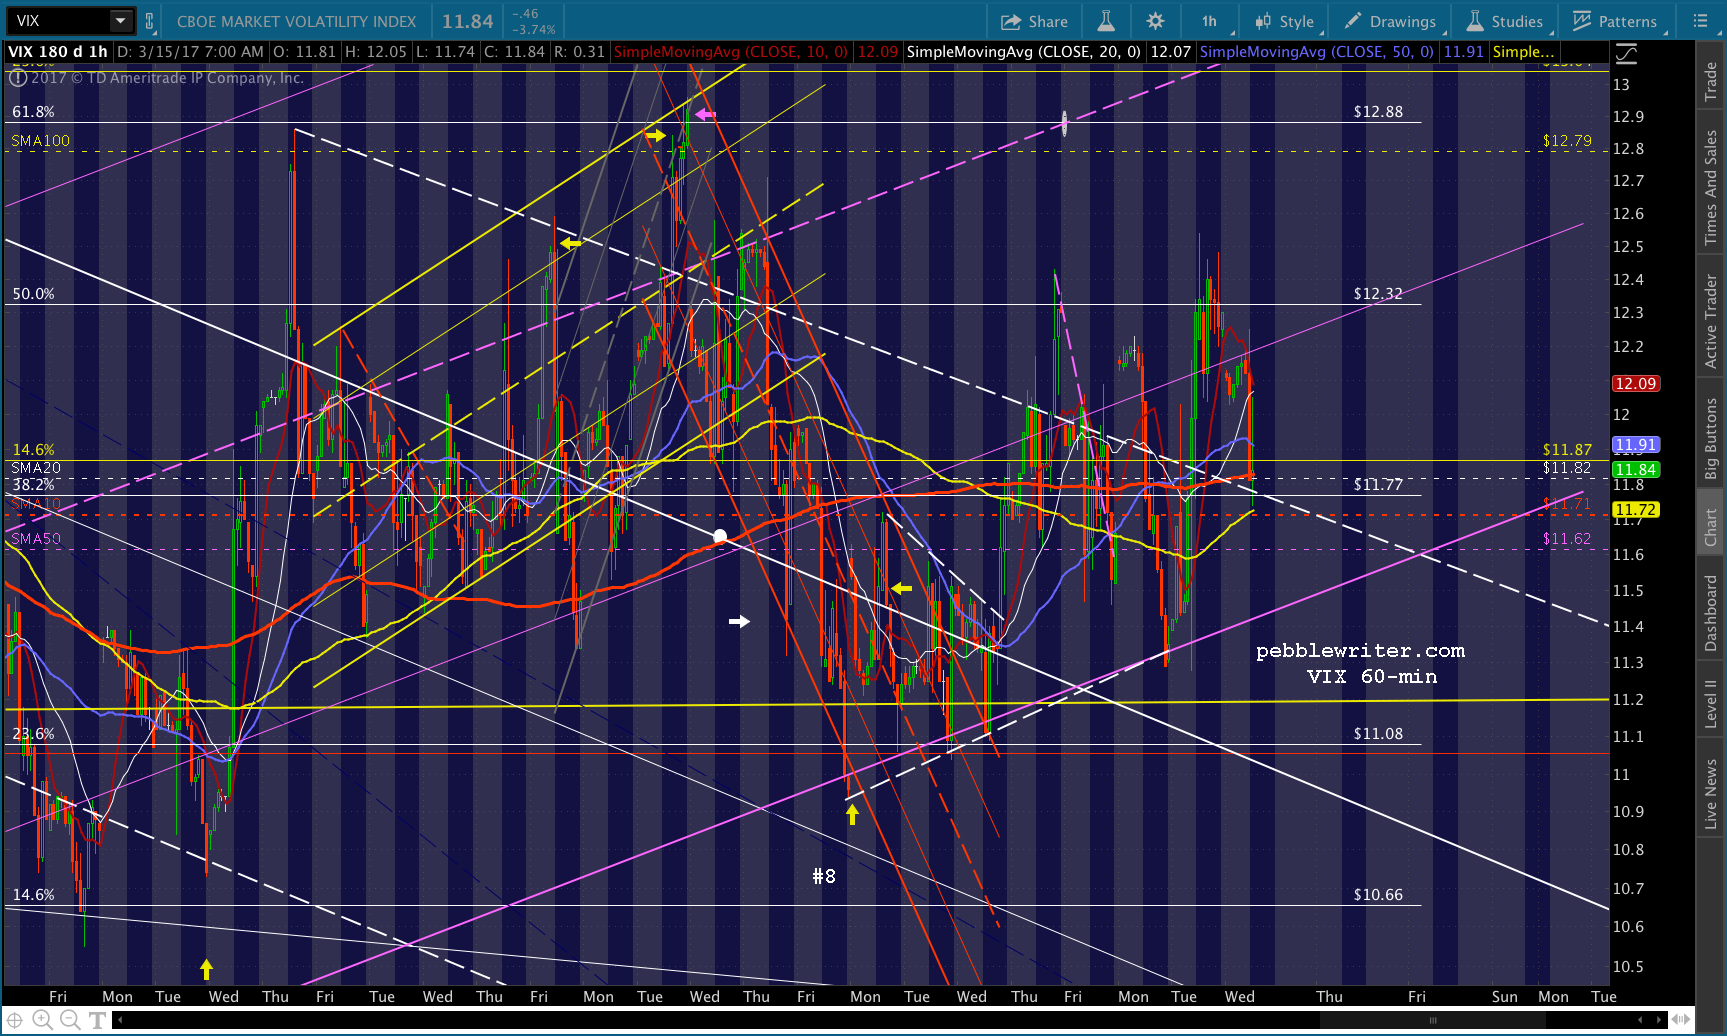
Despite CL being able to rally, USDJPY is ramping and VIX is dumping — currently off 4.6% and testing its SMA10. ES has pushed above its SMA10, so I imagine SPX won’t be far behind. I’d dump the short position if it does, but be prepared to re-open it if it reverses back below.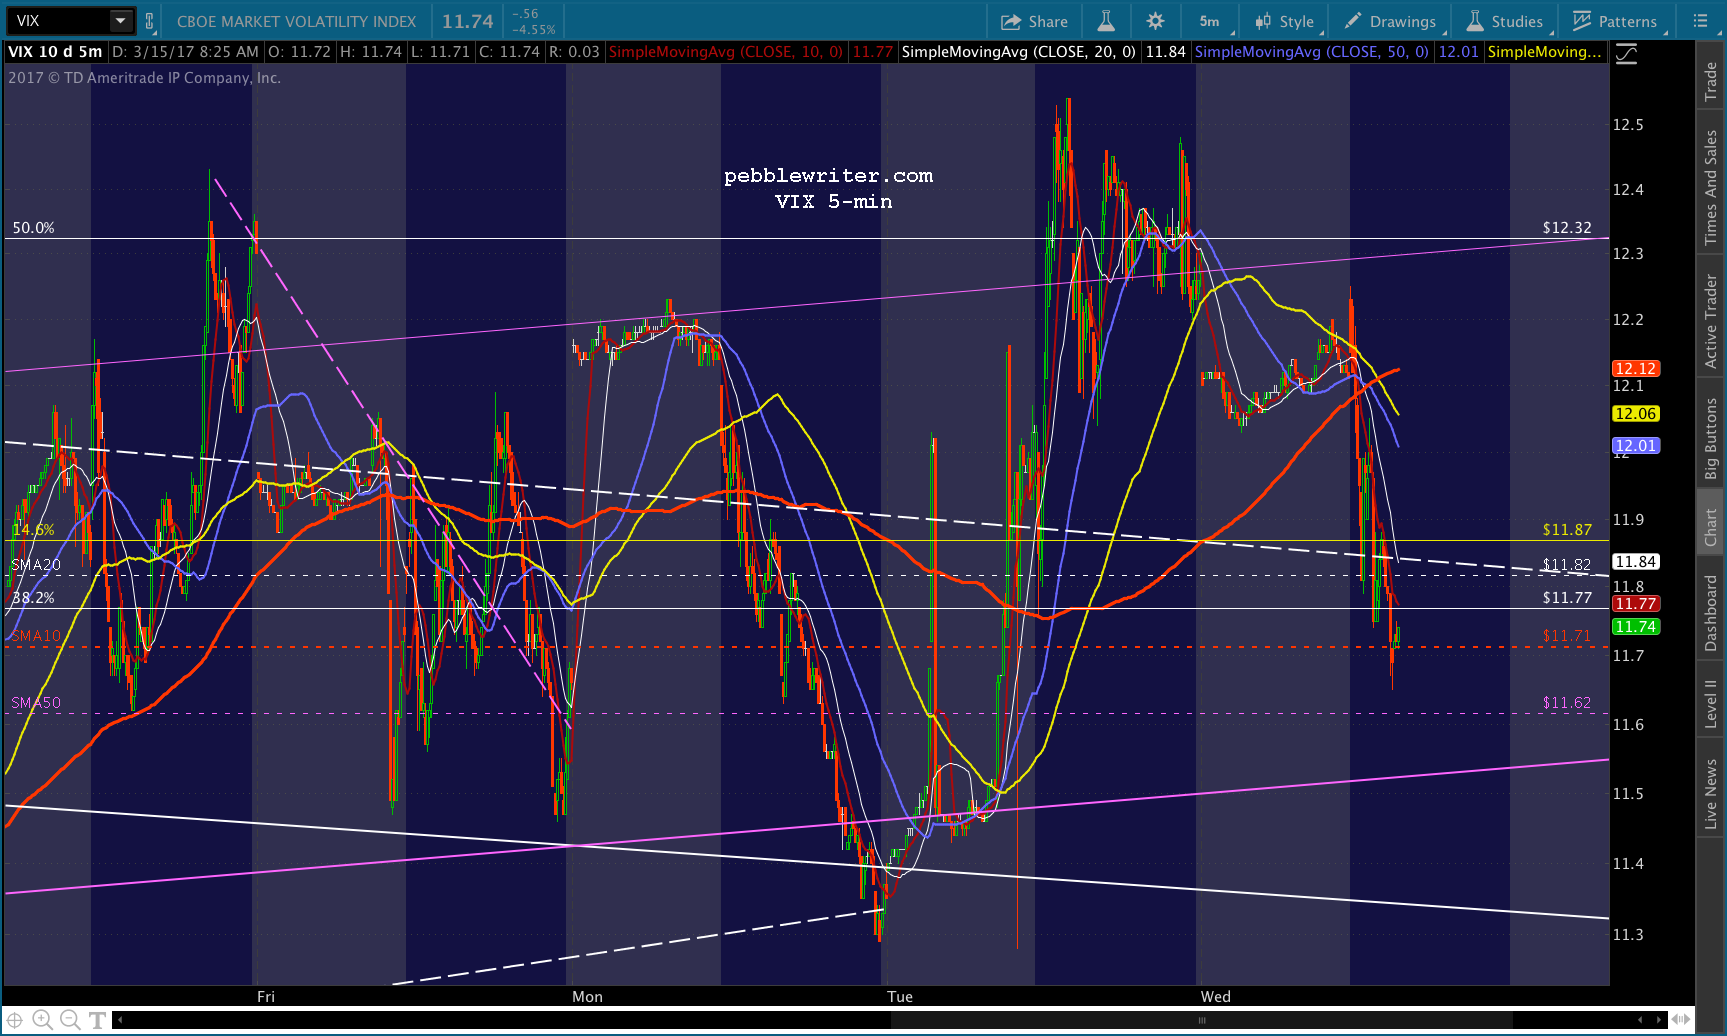

I assume today’s script calls for as much room as possible above the yellow channel top/1.618 Fib before the Fed decision — to provide more of a cushion in case of a swoon. That would explain VIX’s now 4.88% plunge.
A push by SPX above its SMA10, on the other hand, might be hard to bring back under control. I assume that’s why they haven’t pushed CL back above its SMA200, and why USDJPY hasn’t taken off, and why VIX hasn’t dipped below its SMA10.
If they simply wanted to ramp SPX past resistance, it would be rather easy to do. But, this hesitance to do so seems to confirm the idea of a post-announcement dip — hopefully to one of our targets at 2348.47, 2340.75 or 2335.34.
Stay tuned.
UPDATE: 11:48 AM
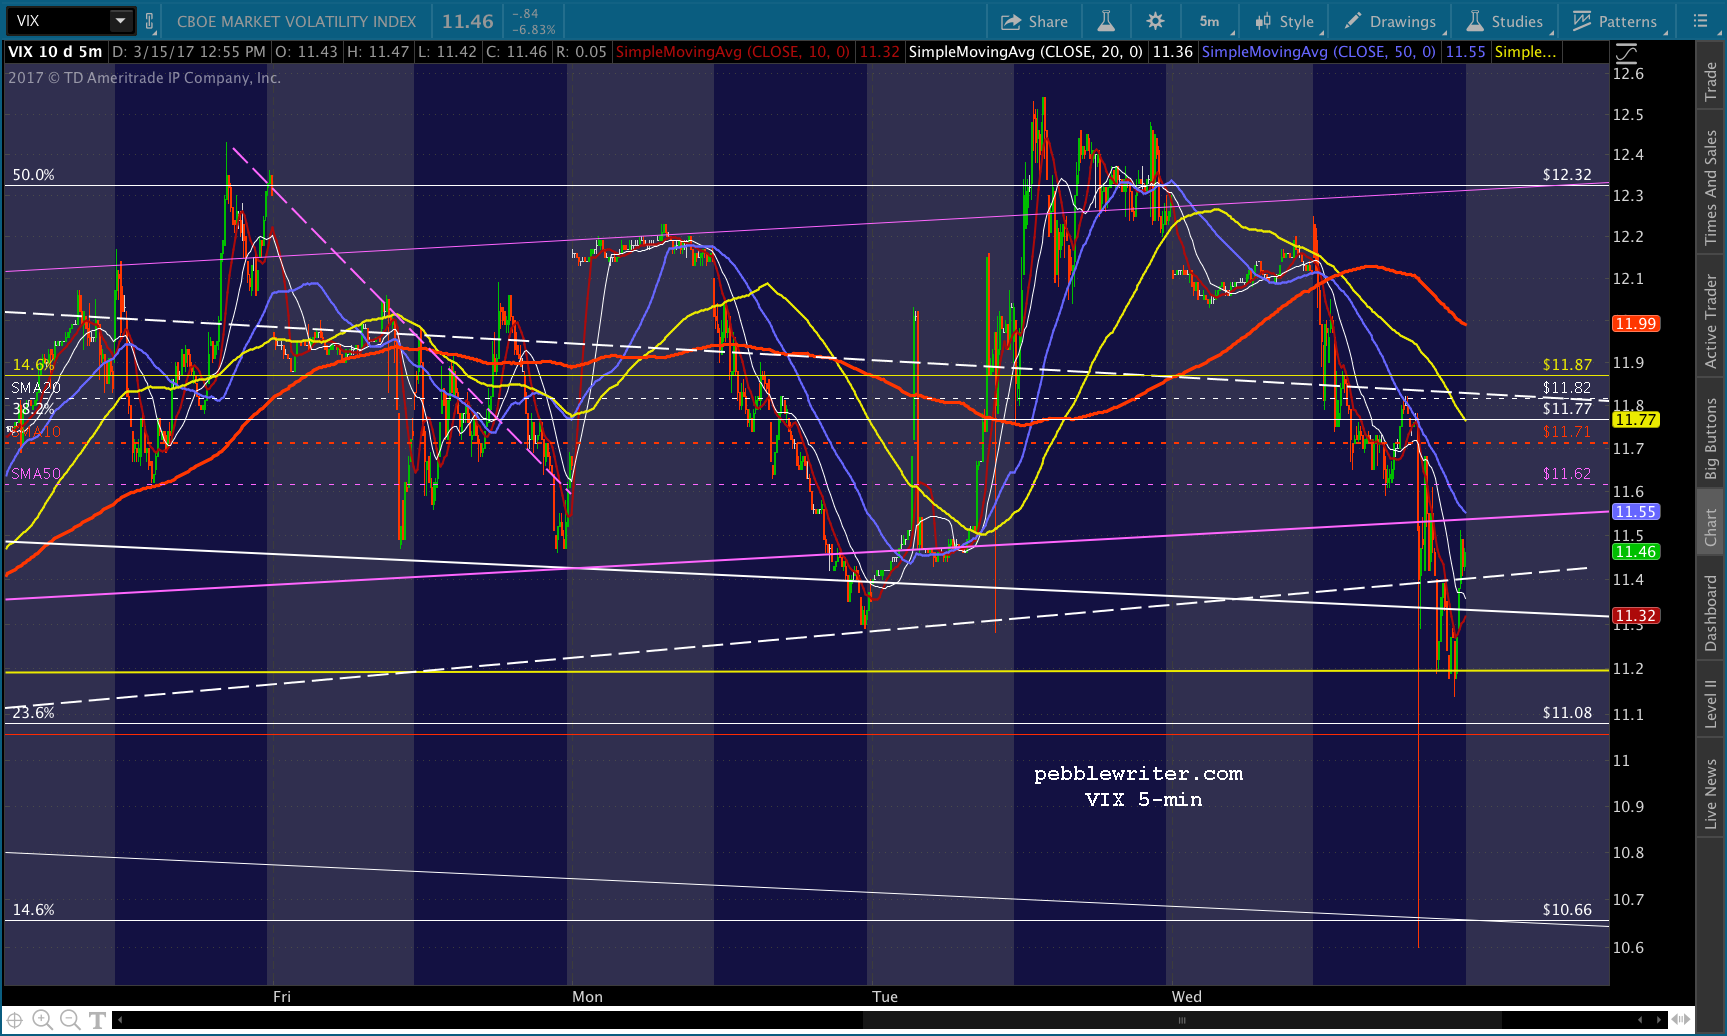
It would be so simple for VIX to drop through its SMA10, sending SPX above its. But, that hasn’t happened, so I’ll assume my above theory is correct. For those who didn’t hold short overnight in a swing position, this is a good entry for a short position — with tight stops, of course.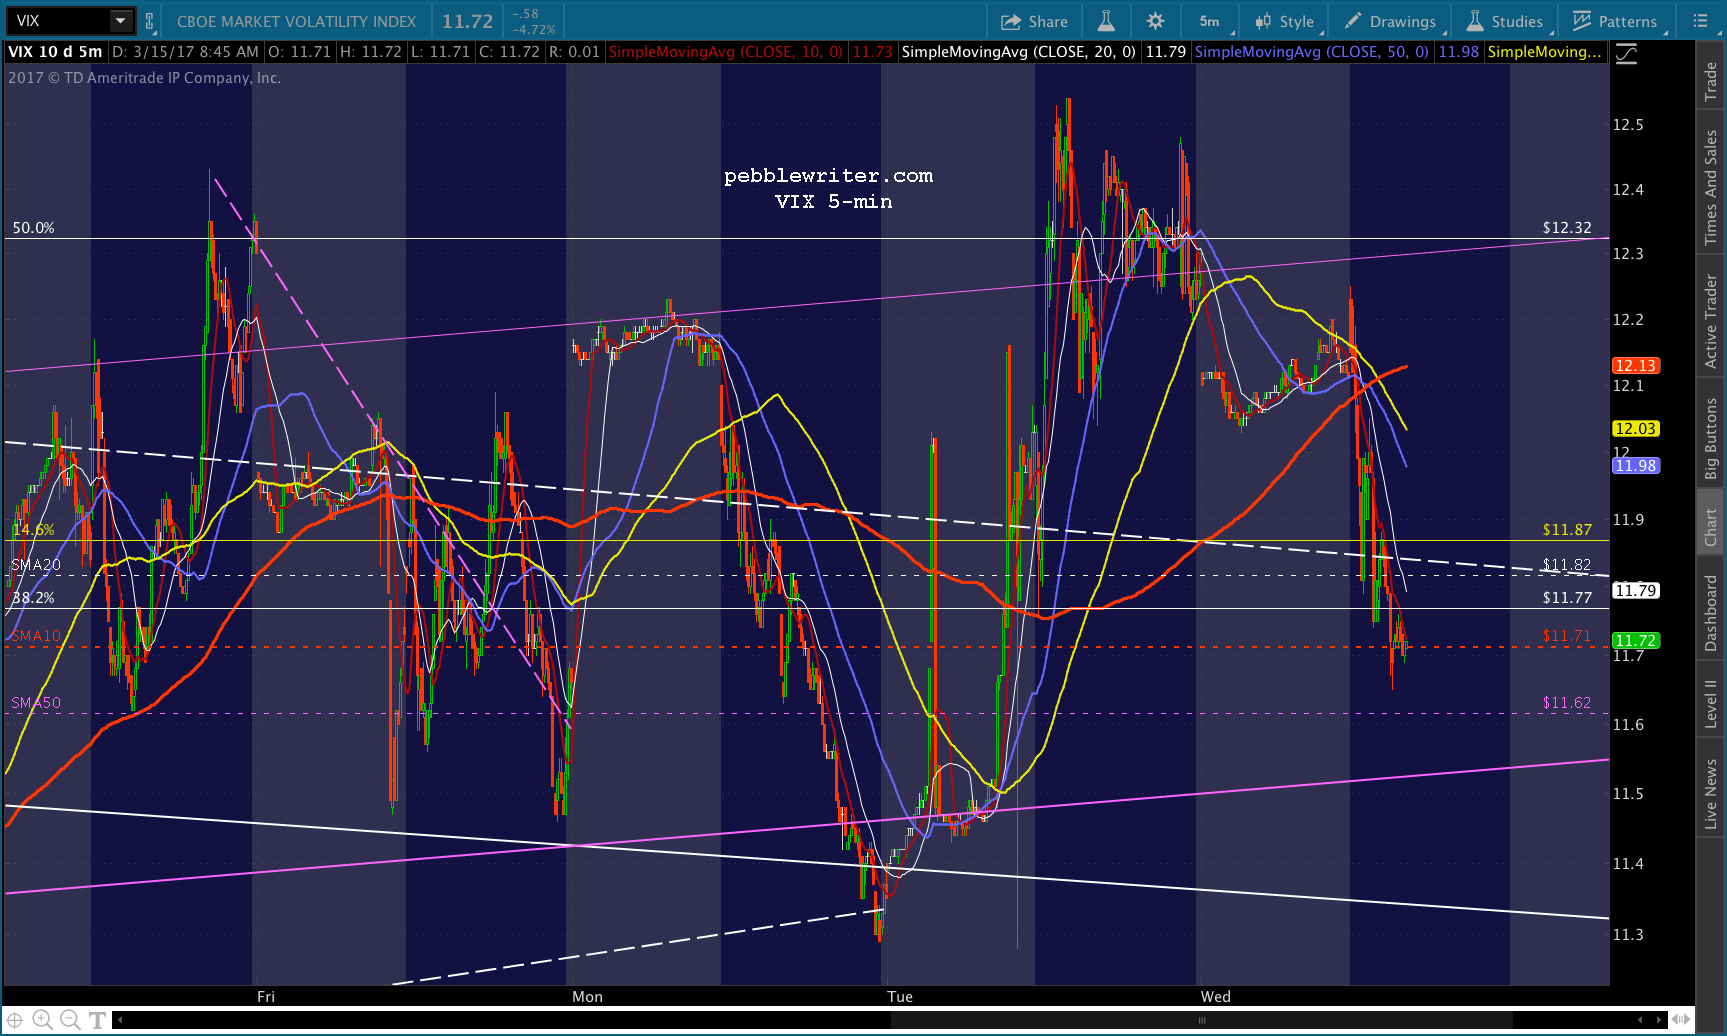
USDJPY is even backtesting its TL a second time. I wouldn’t be surprised to see it drop through the TL.
And, CL has resumed what looks to me like a forced sell off. 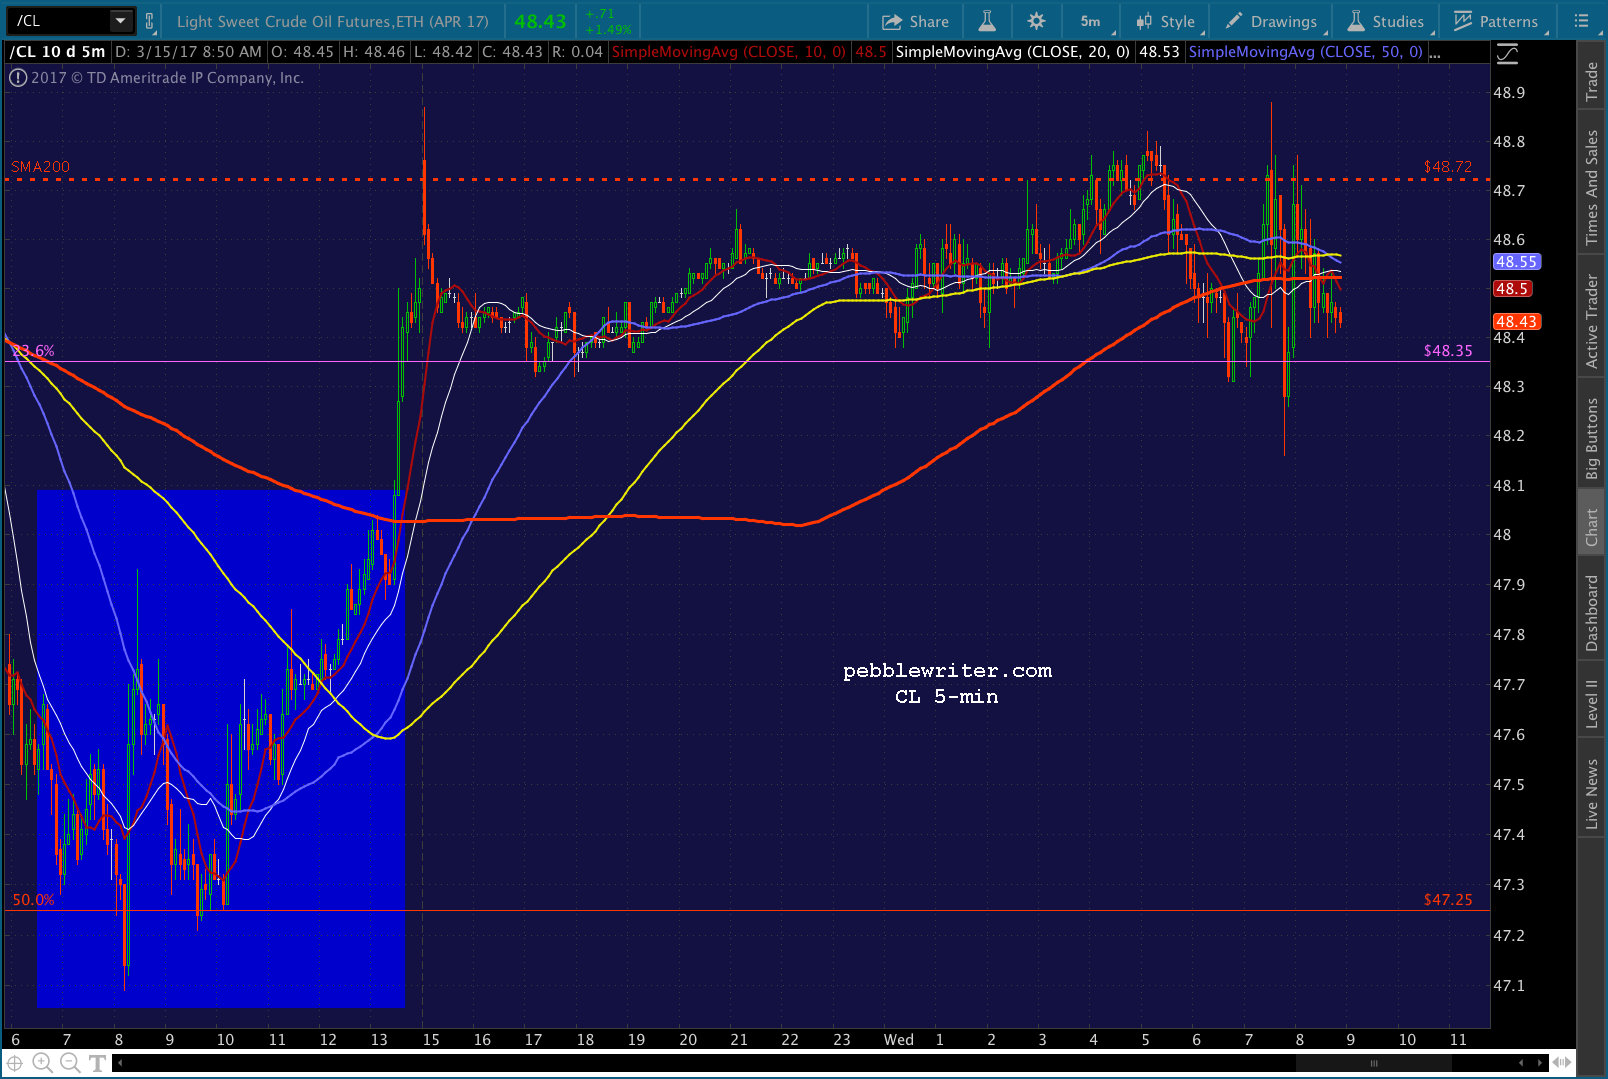
UPDATE: 12:40 PM
VIX continues to plunge – now down 5.6% on the day. USDJPY is dropping to compensate, but it’s not enough. SPX just nudged above the SMA10 and will test Friday’s high any moment. Watch your stops, as this could get messy. For nervous types, this is your exit call. If this pushes through 2377, the risk is for the rising purple channel to take over and push prices up to 2383 or even 2395. I don’t expect this to happen, but stranger things have happened.

UPDATE: 1:59 PM
Before…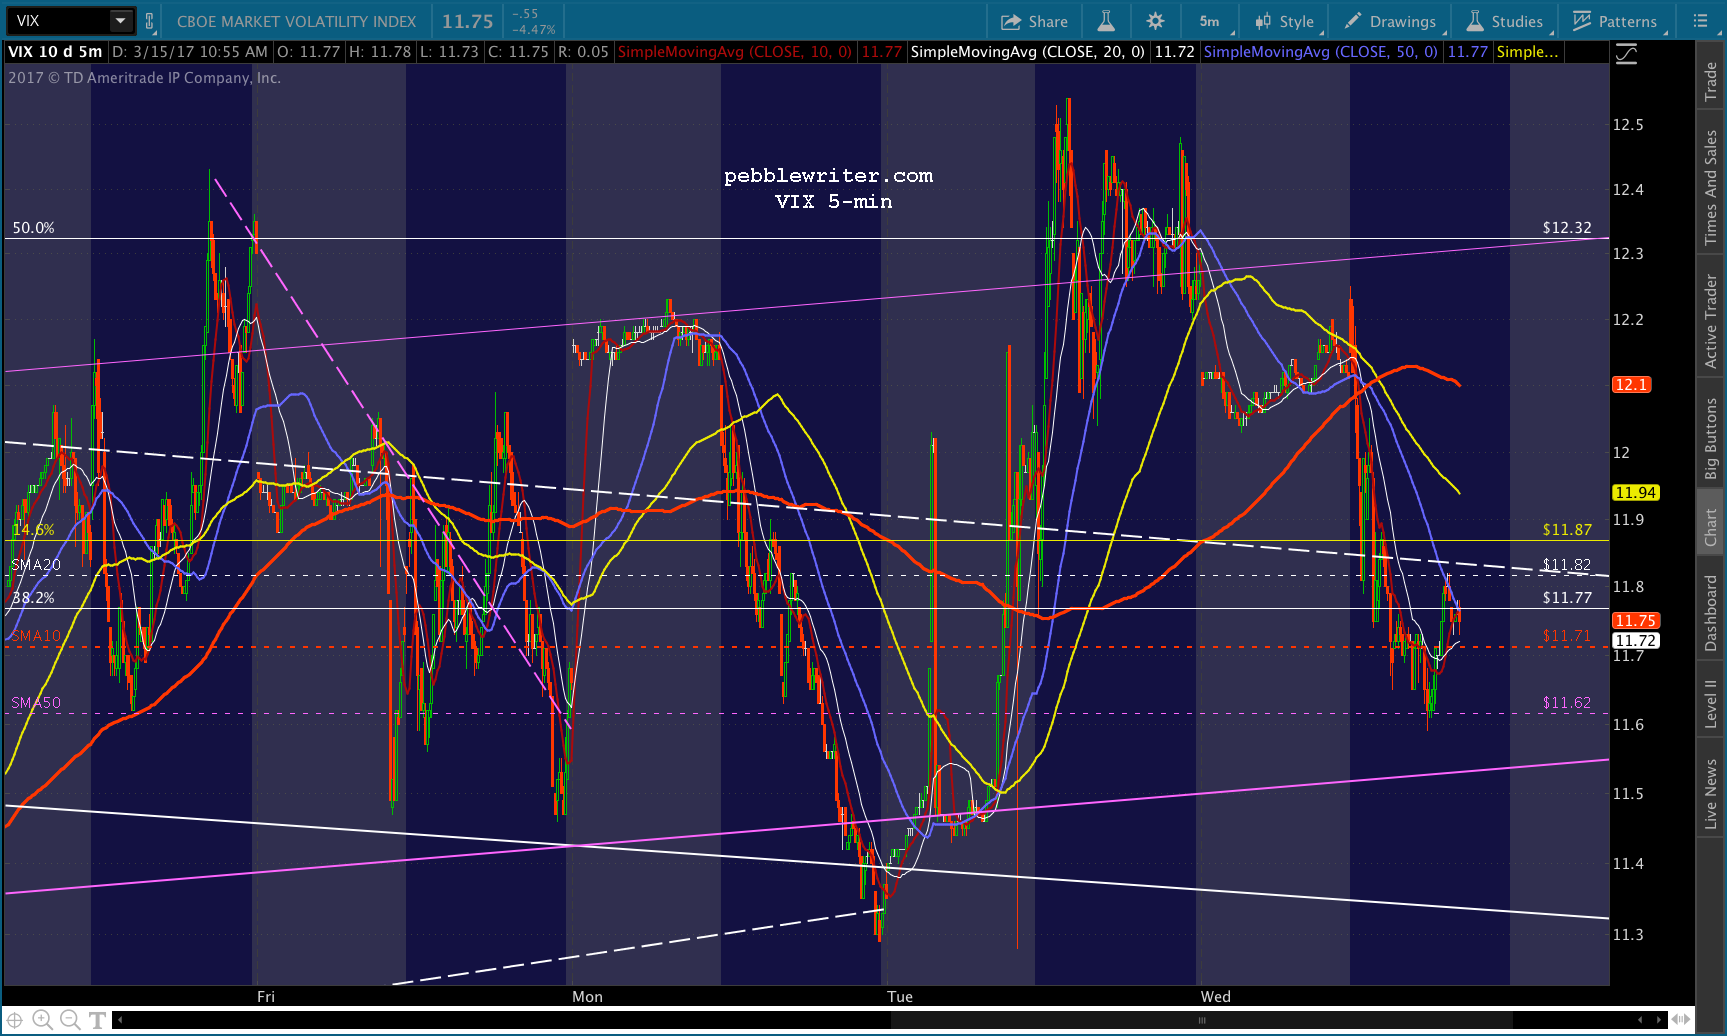

…and, after. I’d revert to short here at the purple .618 and white channel top. Note that we now have an C=A corrective wave (also known as a Flag Pattern) up to the .618.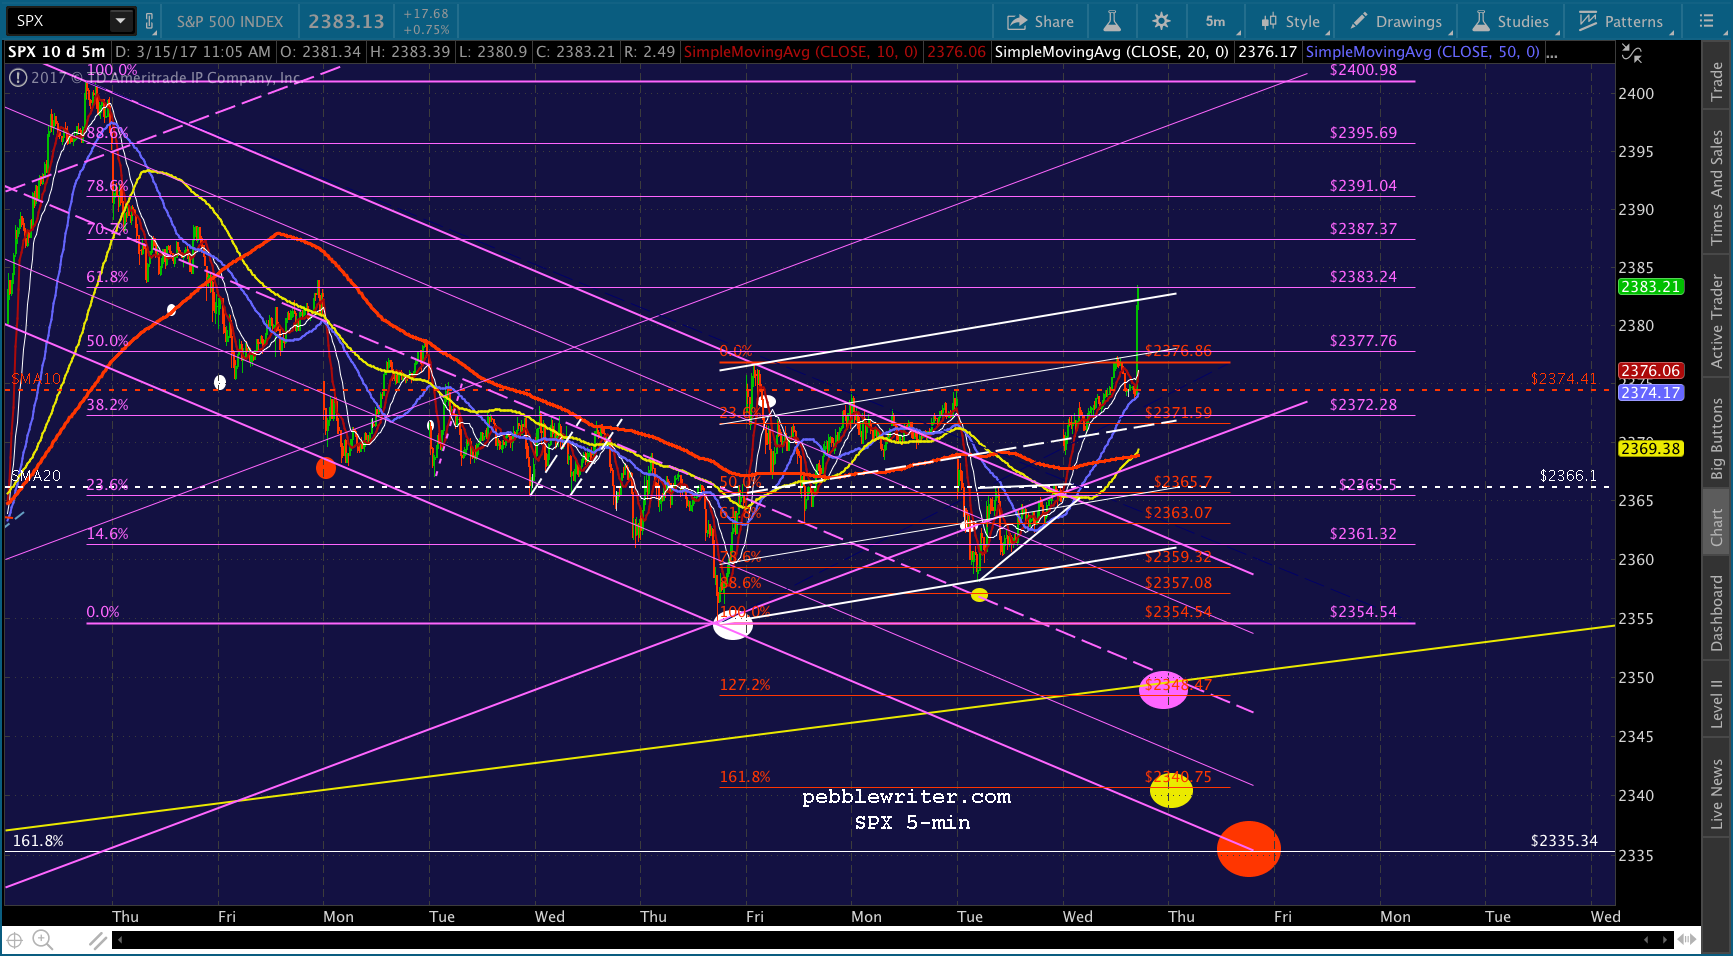 No surprise that VIX provided most of the spark…
…even as USDJPY plummeted. It has further to go.
And, CL continues to threaten a recovery.
Adjusting the red Fib grid, we can see that the red 1.618 is now more closely aligned with the white one. It’s a better fit, though the red 1.272 is no longer that well aligned with the yellow channel top.
VIX’s drop establishes an A-B-C corrective wave with C=A — but, obviously, we’d need to see a nice rebound here. In other words, tight stops are essential.
I’d keep a very close eye on the 5-min VIX chart and this white TL.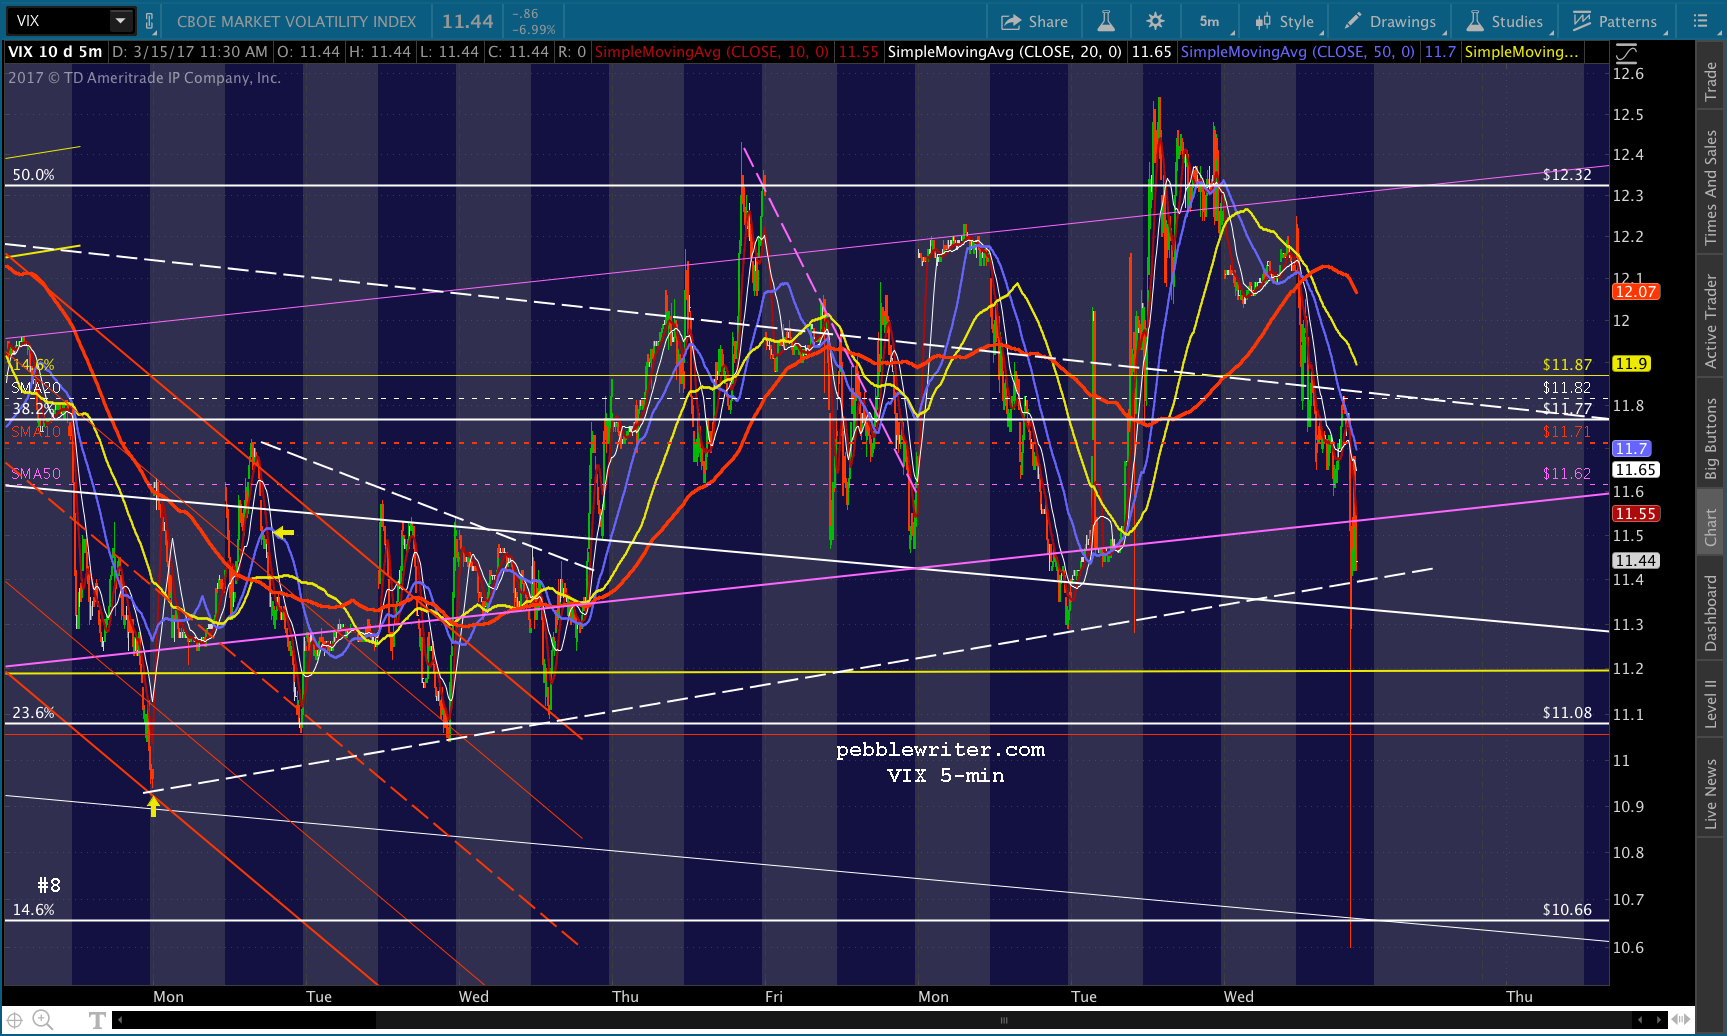
I’m going to sign off now and see what Janet Yellen has to say. Keep an eye on your stops, and I’ll check back in after she’s done.
UPDATE: 3:57 PM
SPX is almost back to the .618. For the adventurous types, we still have a shot at the yellow channel top tomorrow — especially if there’s any more debt ceiling drama. I’d hang short overnight if you can hedge or deal with the gap risk.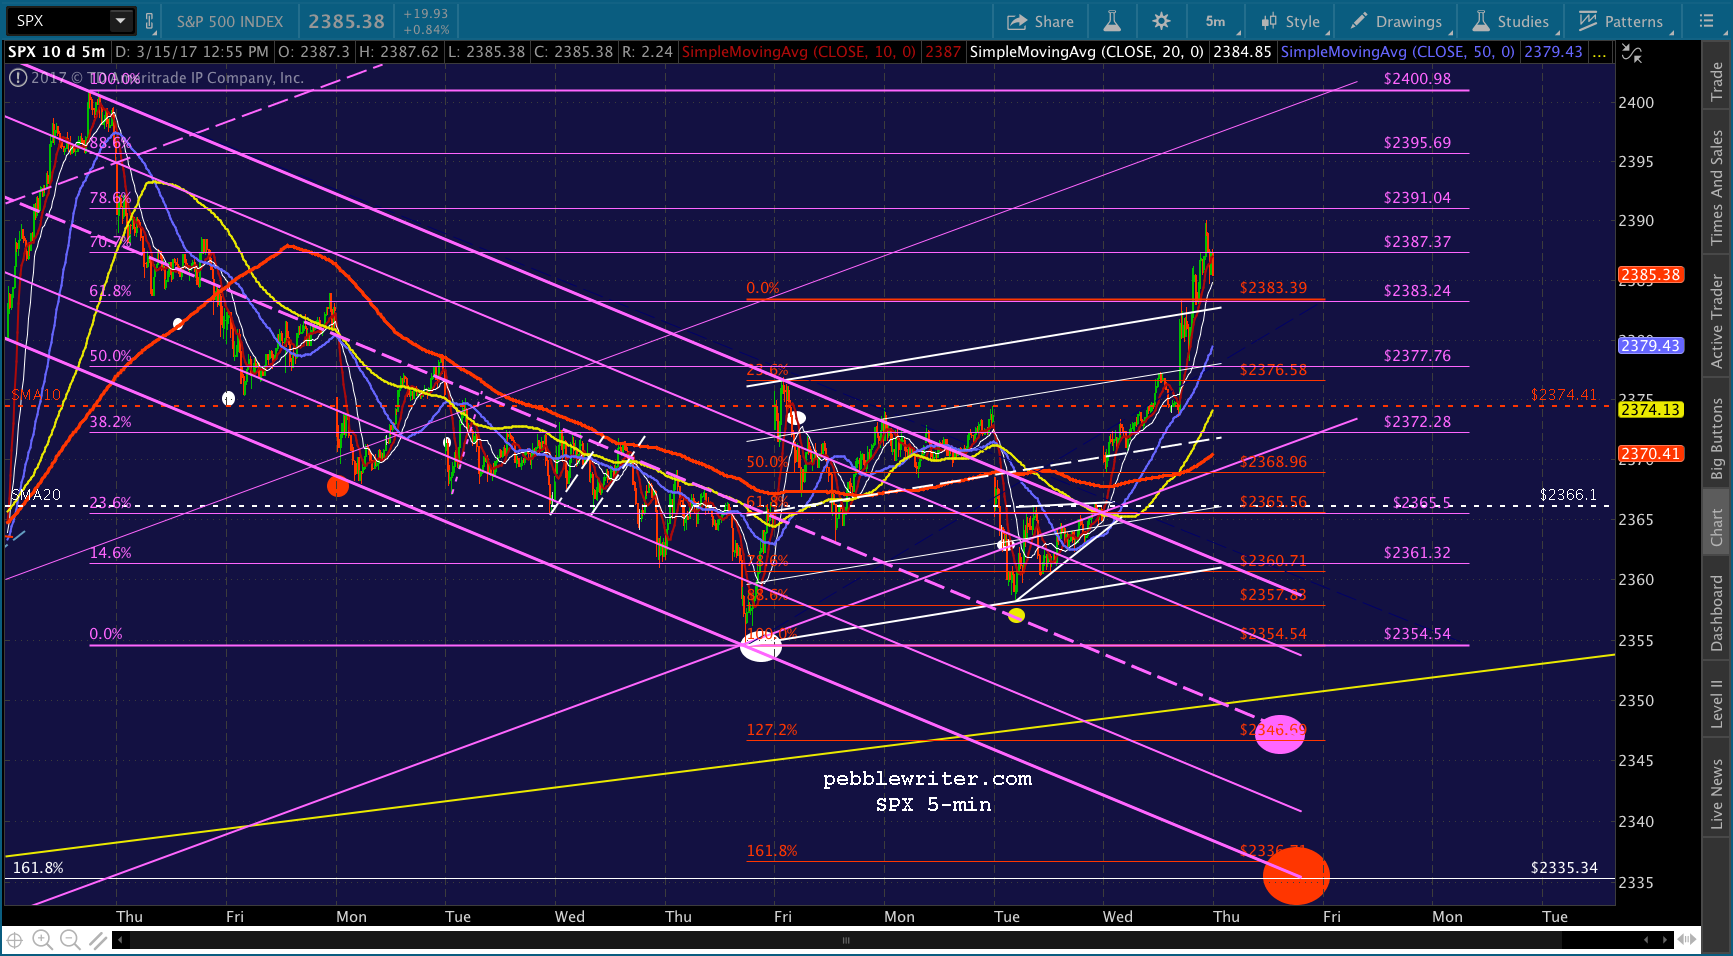
VIX is back above the white TL.
Though USDJPY tagged our target down at the channel bottom.
For its part, CL should drop back below the SMA200 after the close. The slight inventory draw doesn’t justify the rebound. Today’s rally was all about keeping stocks on the rise while Yoda spoke.