

Only a couple of years ago, central bankers became adept at repairing the damage done to stocks after big shocks. That changed with Brexit, when the strategy shifted to pushing stocks as high as possible before the damage was done… and, still doing all the requisite ramping after the fact.
They perfected the technique after the US election, turning a 5% overnight dump in the futures to a breakout above important resistance — where stocks remain, today.
It made a bold statement — that the market was resilient enough to weather a sea change in the political landscape. This week should be all about proving how resilient it is in a rising interest rate environment. Judging from the mild drop over the past week, investors are quite unconcerned.
Does this make sense, or are investors whistling past the graveyard?
continued for members…
Futures are flat this morning, though we ended last week nervously bearish, at an inflection point with SPX threatening to break out of the falling purple channel it’s been in since Mar 1.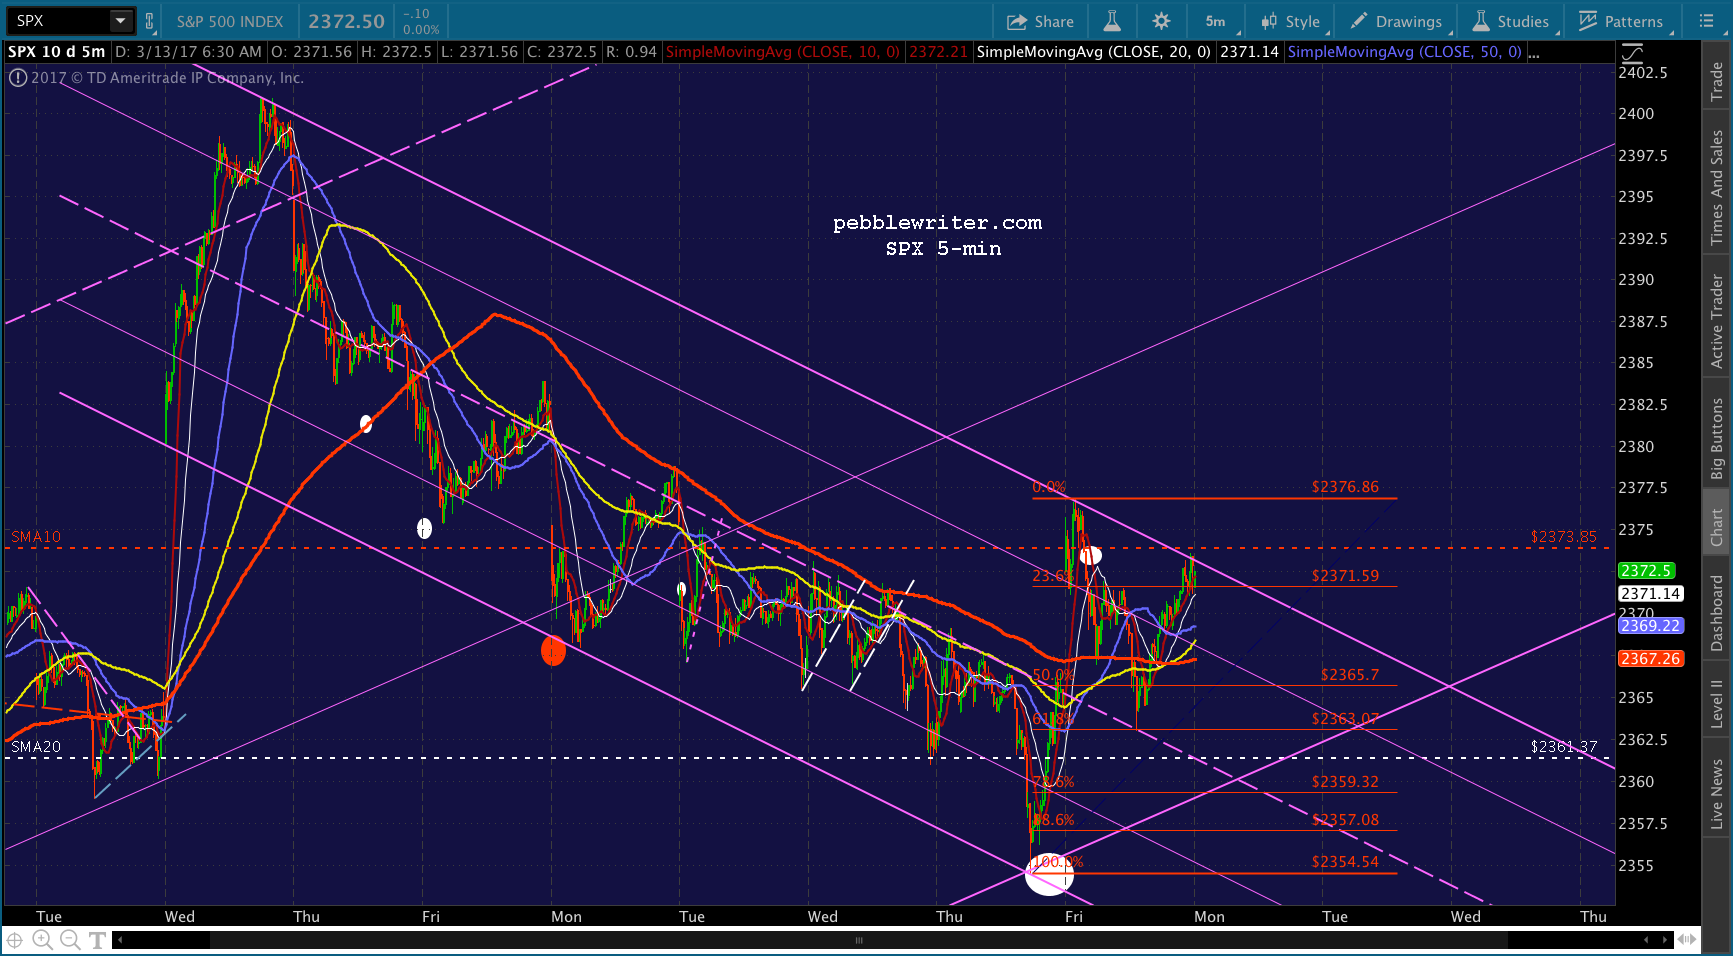
CL closed below its SMA200 and has further to go — though it will likely continue to put in much of its losses overnight and bounce during the day when it matters. 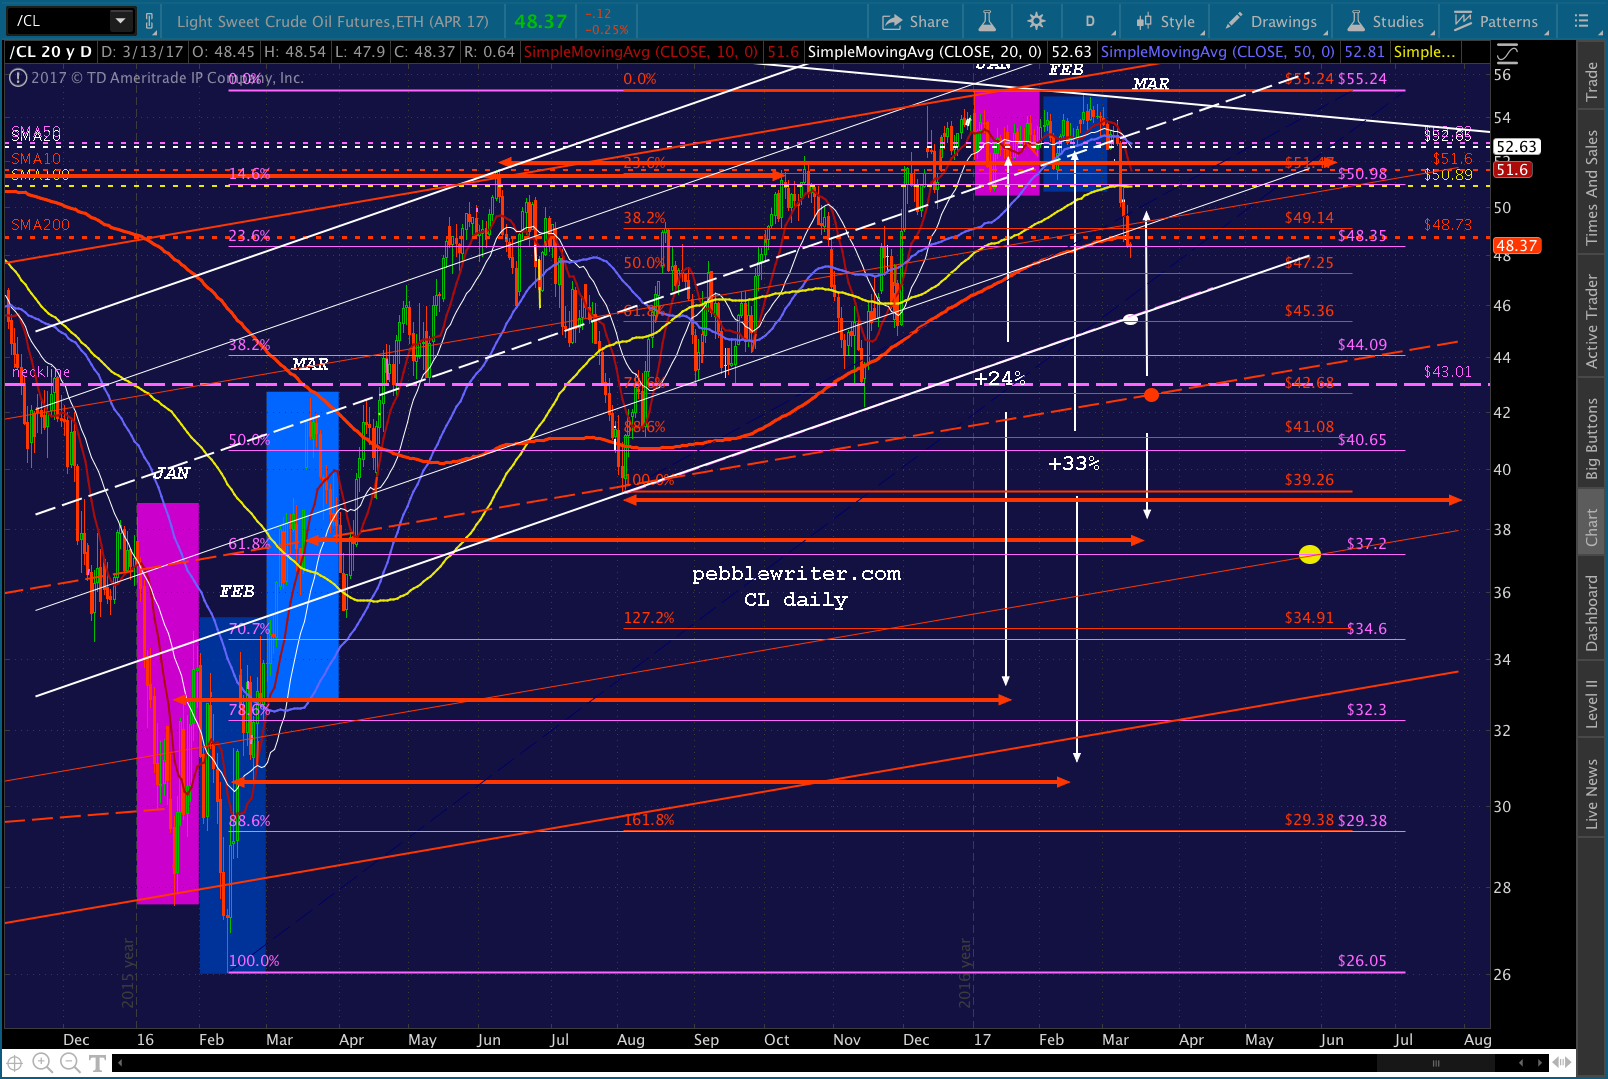 This morning, I’m looking for it to backtest the SMA200 and, if necessary, push past it.
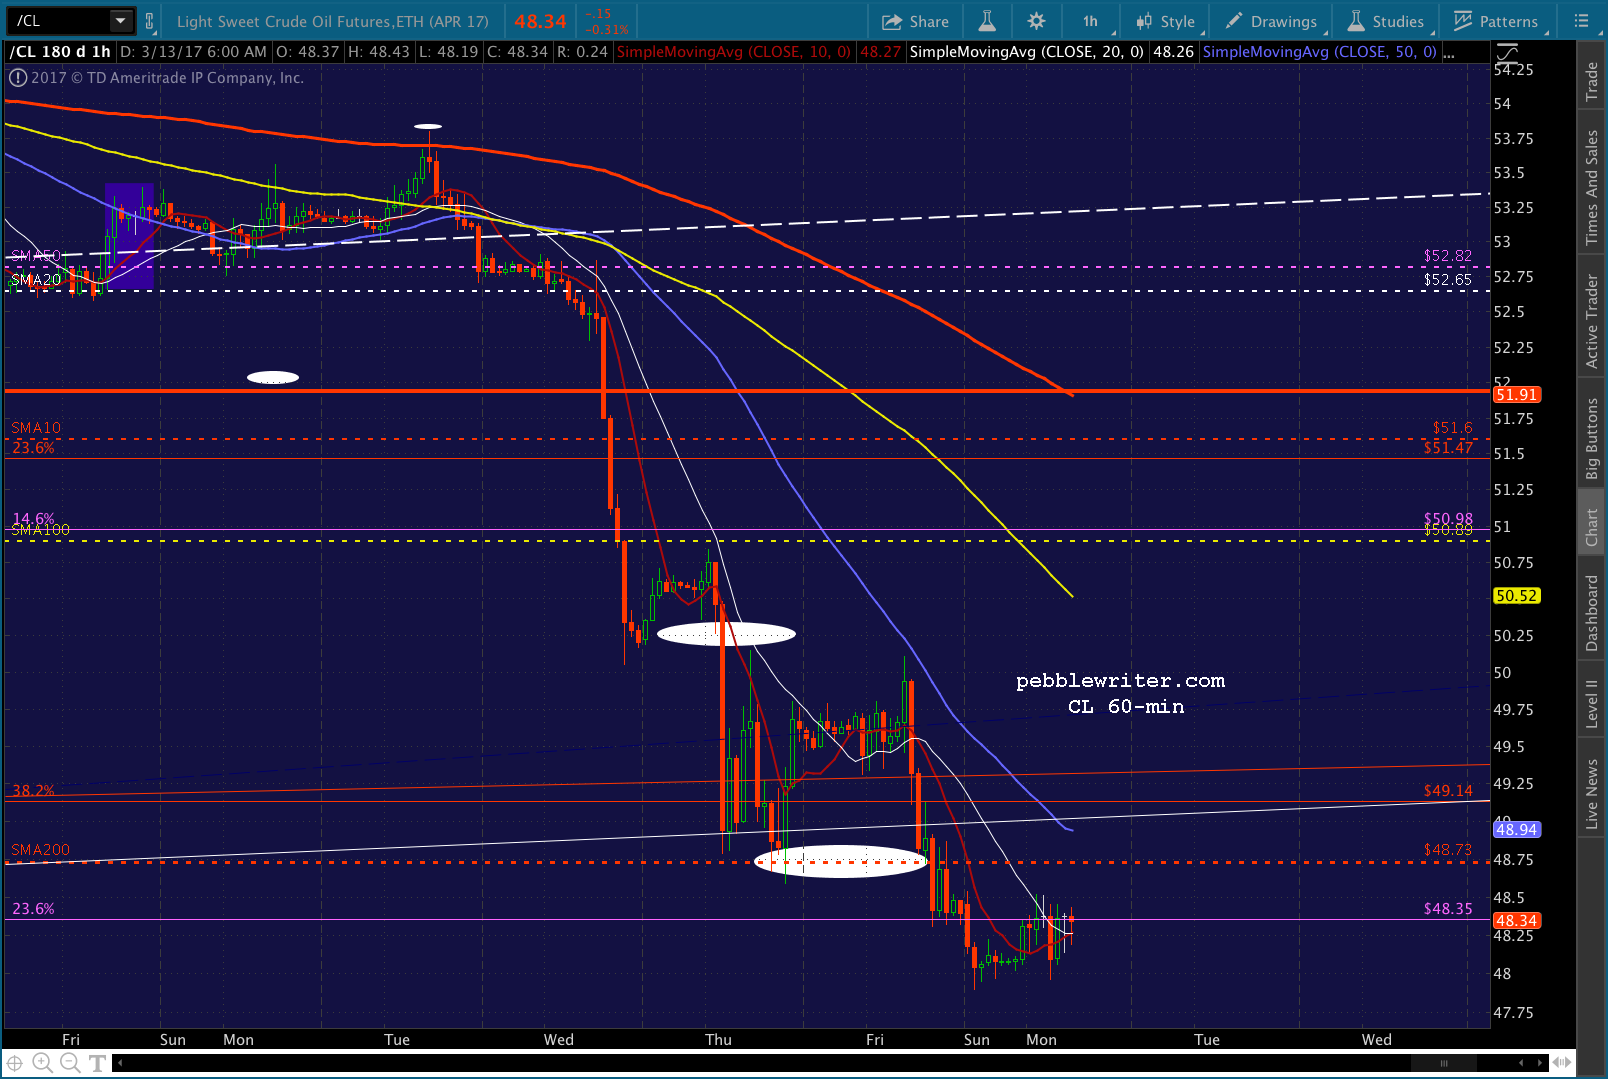
USDJPY appears to have finally picked a rising channel — the less aggressive white one.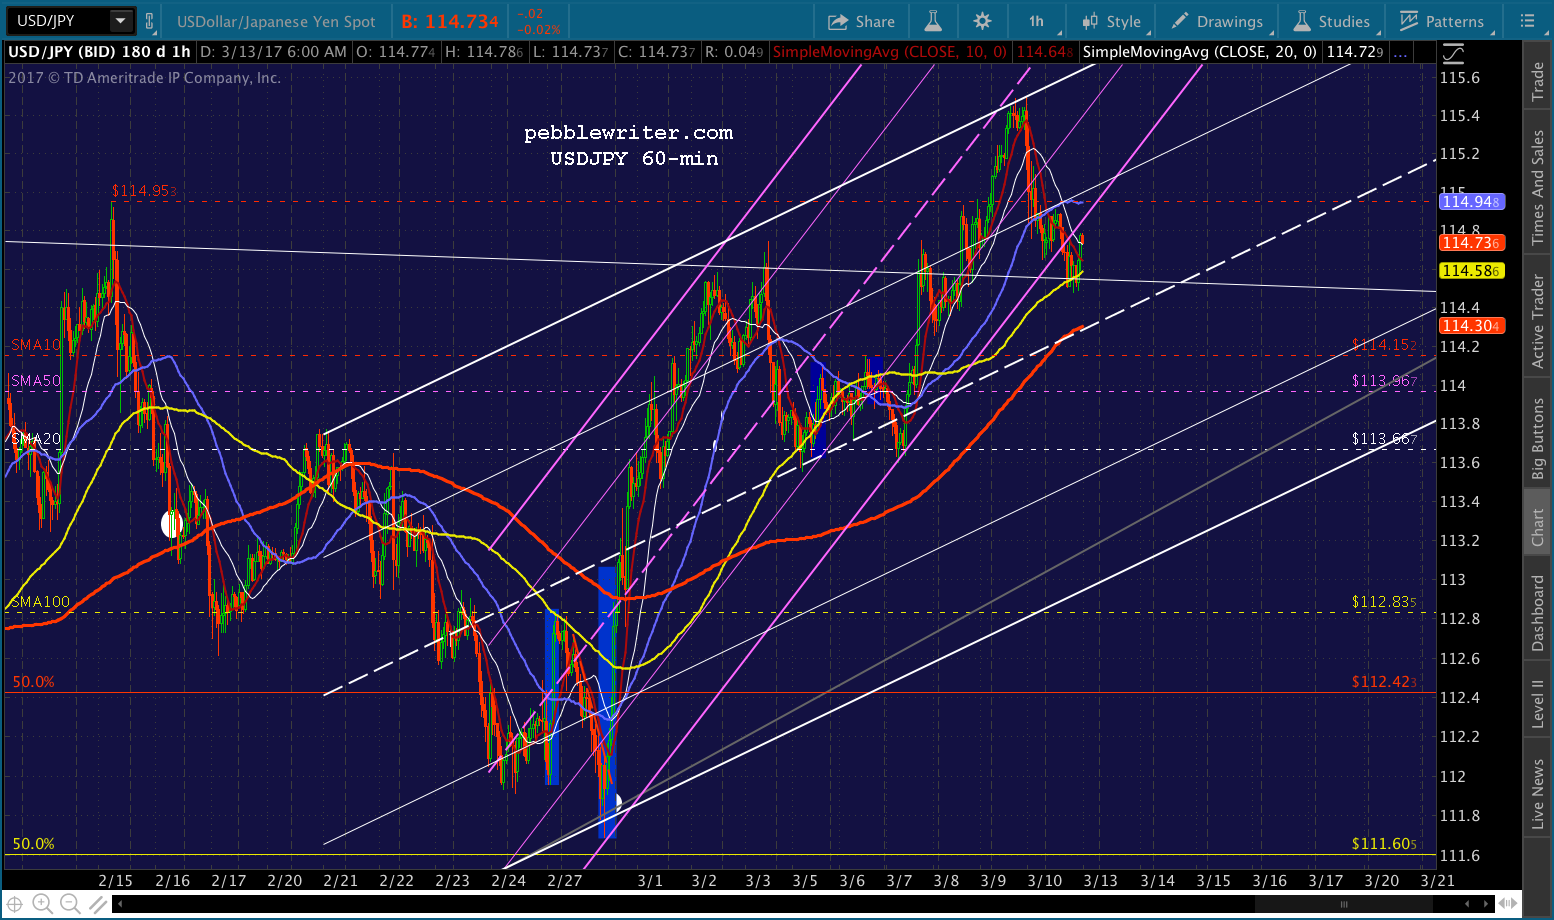
And, VIX is backtesting the white internal TL and SMA100 (11.87) this morning. It will probably remain the primary means of slowing or stopping any serious downside until the time is right.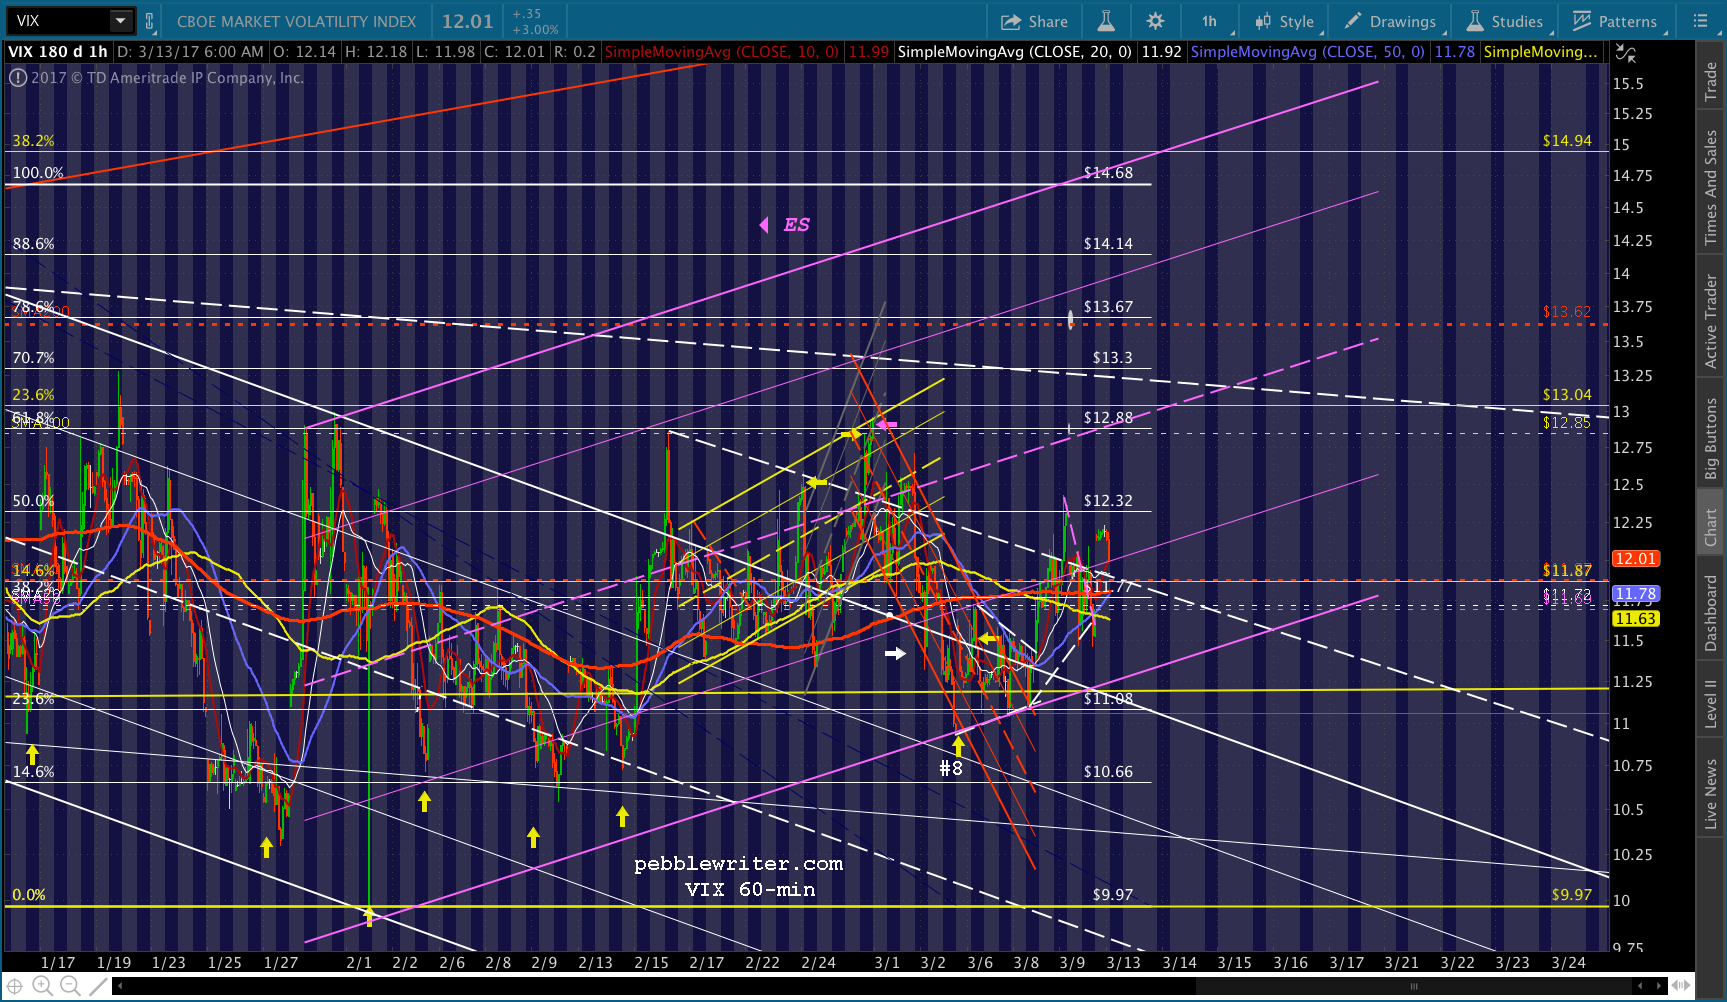
As discussed last week, SPX is likely to backtest the rising yellow channel, and possibly the 1.618 as well. I remain short from Friday, with expectations of tagging the red .786 (2359.32) or .886 (2357.008) to complete a Gartley or Bat Pattern today, and a dip to 2348 or 2335 after the FOMC announcement. This would mean a breakdown of the rising purple channel. But, I suspect that won’t happen until tomorrow at the earliest.
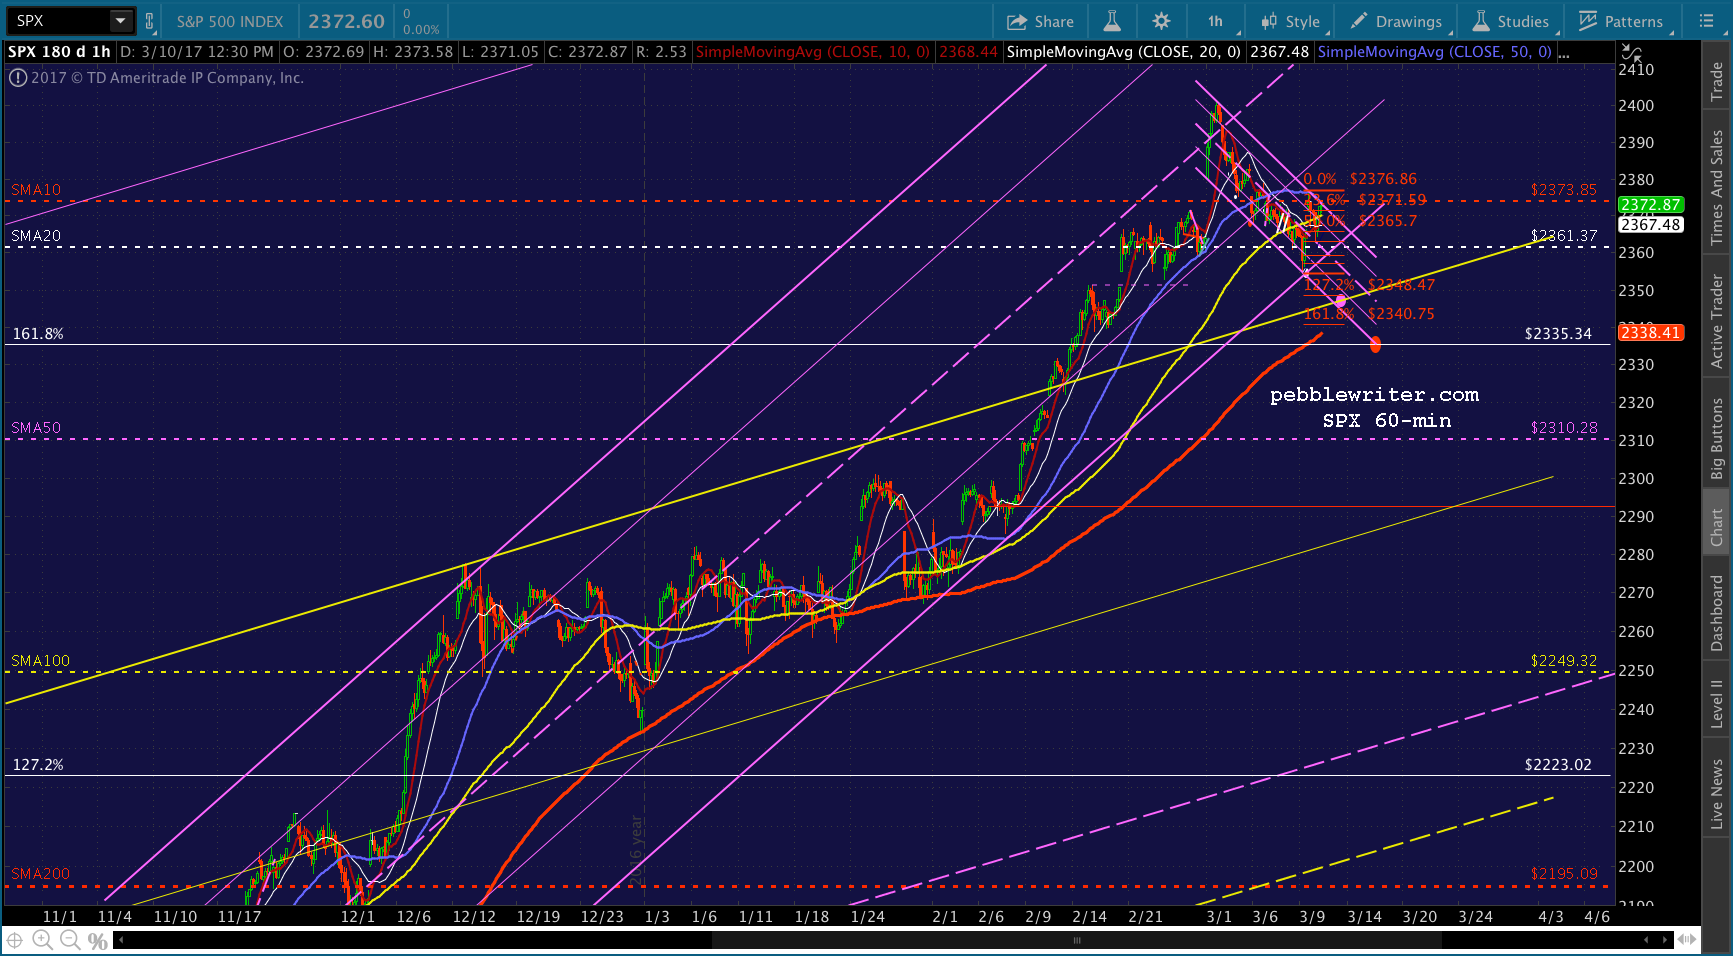
Given its age, it’s difficult to precisely place the yellow channel top. Hence the uncertainty over the backtest. The apparent proximity to the red 1.272 is a hint, but I could be off. The 1.618 Fib, on the other hand, is as precise as they come.
And, it has never really been backtested, even though it was a fairly important Fib level set up by the drop from 2134 to 1810.
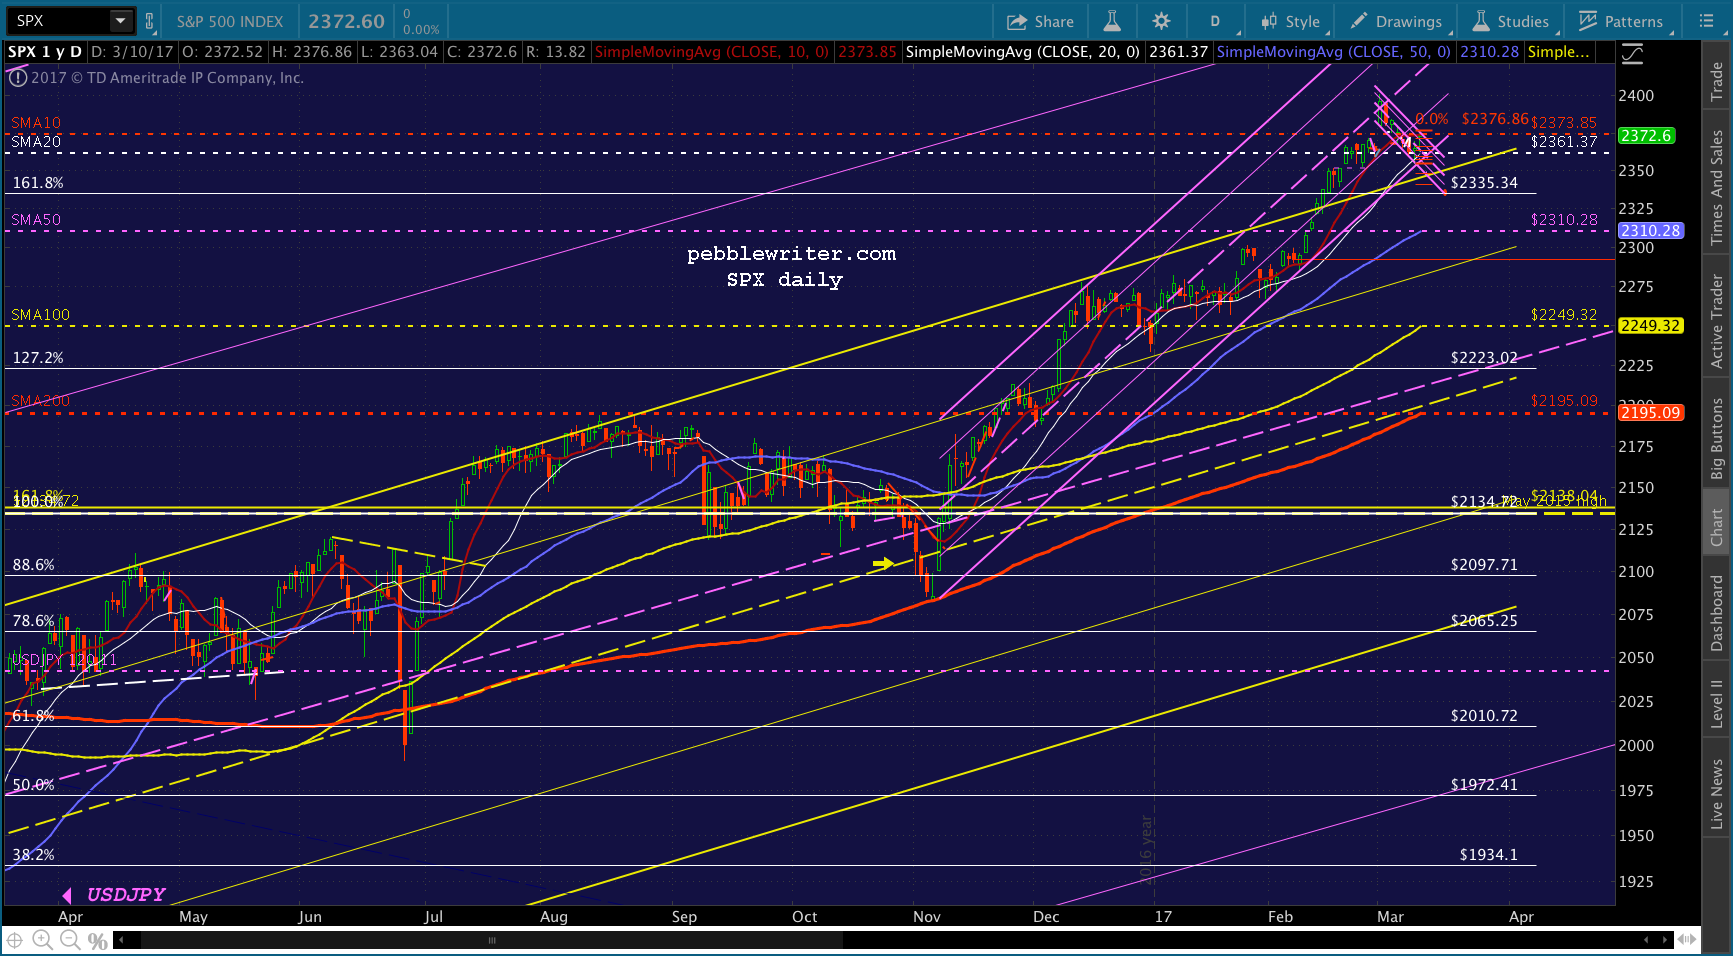
There was an attempt in Sep 2016 following the much overdone Brexit recovery, but that failed — yielding a lower low in October and another one in November. Only the massive manipulation which produced the election night recovery and fraudulent “Trump Rally” was able to get SPX up and over that resistance.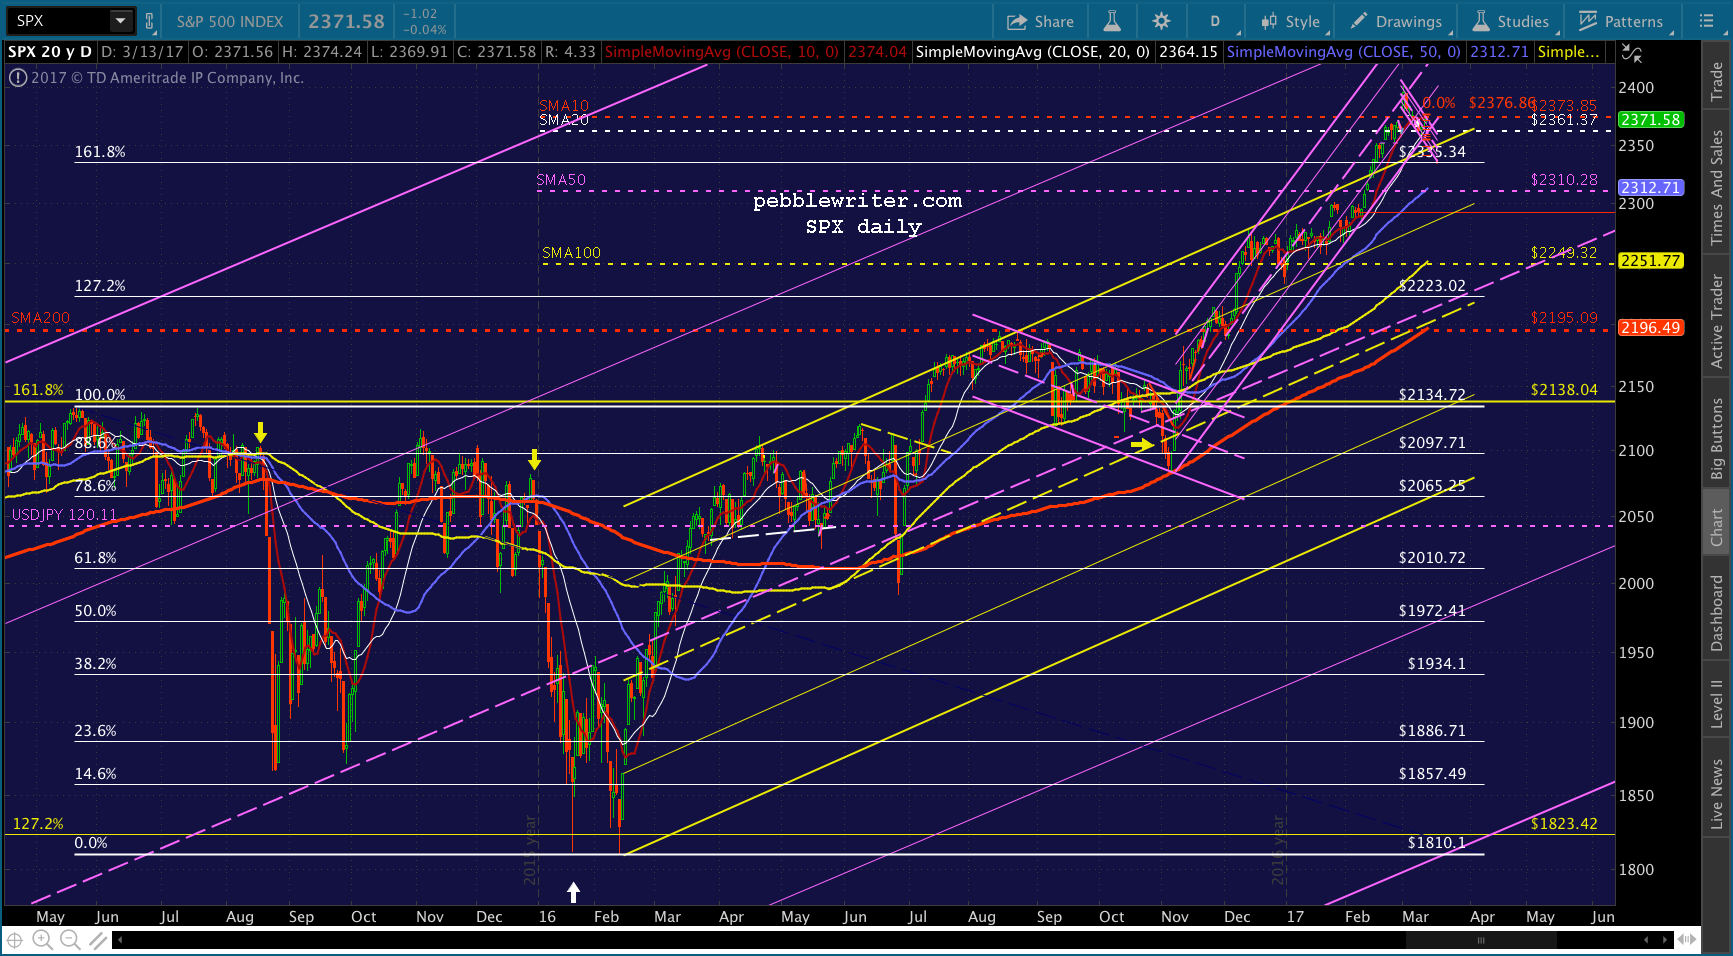
As can be seen, the yellow channel is just a subset of the much larger purple channel that has guided stocks since the 2009 lows. So, its importance is really that it keeps SPX rising within the rising purple channel — seemingly suggesting that the purple midline is history and the .236 line, currently about 2470, is the next target. 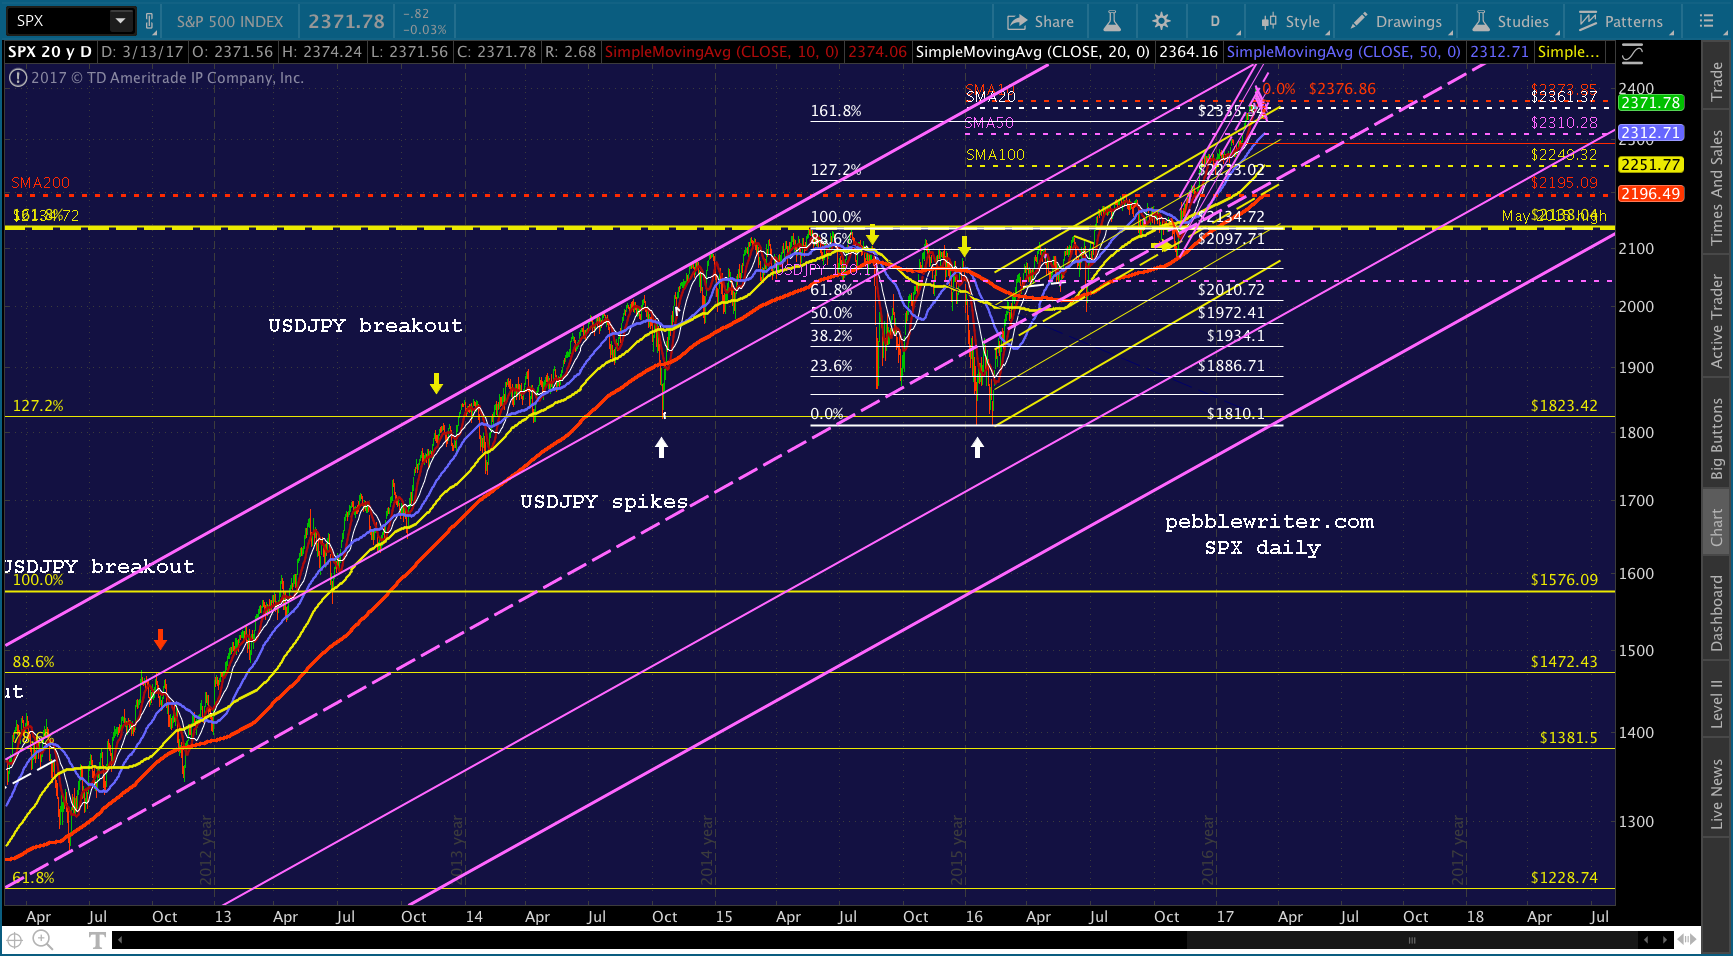
It wasn’t long ago I felt like an outlier calling for a rate increase in March. Now, it is widely expected. So, it’s unlikely that investors will be spooked. The inflation numbers, on the other hand, have the potential to spook folks. Another potential problem — the debt ceiling, which some Republicans have indicated they won’t vote to raise.
I’m looking for at least 2.7-2.8% on inflation, which shouldn’t be too surprising — but, who knows? Likewise for the debt ceiling — which has always made for great political theater.
If investors are spooked, there are many significant levels of support below that Fib at 2335.34. The SMA50 is currently at 2310.28 and could be up to 2335 by the end of the week. The SMA100 is at 2249.32, and doesn’t really intersect with anything important any time soon.
The SMA200 is currently around 2195 and could reach the nice round number of 2200 by Wednesday. Note that it’s also right next to the yellow channel midline and the just below the purple channel midline — both of which have provided most of bottoms over the past year.
For this reason, I’d include the SMA200 in the list of potential downside targets, which then reads as follows:
– yellow channel backtest at 2348ish
– 1.618 Fib at 2335.34
– 1.272 Fib at 2223.02
– SMA200 and purple midline at 2200ish.
– 1.618 Fib at 2138.04
Is there the potential to lose almost 10% to 2138? It seems unlikely unless Yellen’s comments are really upsetting, inflation is more like 2.9%+ and/or Congress doesn’t raise the debt ceiling.
.