

After allowing a six-session slump (that saw SPX nail our downside target), The Powers That Be can be forgiven for insisting on an overnight ramp job. Last night, it was USDJPY pushing through horizontal resistance, VIX getting clobbered through three separate moving averages, and oil continuing a nice bounce off our 48.63 target. It should be enough to get SPX up over its SMA10 on the opening bell.
Since the bounce is mostly about oil’s “recovery,” we’ll focus today on what to expect over the next few weeks.
Oh, and for those of you who clicked on this post expecting to get their Debbie Harry fix, HERE YOU GO.
continued for members…
Futures wasted no time getting this particular ramp started. ES dropped 7 points after yesterday’s break, but quickly ramped higher — up and out of the falling white channel and back above the yellow channel line.  Interesting that its now back below the SMA10 as CL is drooping.
 Perhaps getting SPX to the top of the falling purple channel is all the script calls for.
 If so, no one told VIX, which has put in a bullish (for stocks) overnight performance…
 …as has USDJPY, steadily creeping higher after accommodating yesterday’s sell-off.
 UPDATE: 9:45 AM
It rarely works out, but with VIX back above all those SMAs, ES back below its SMA10 and SMA5 200, CL still slumping and USDJPY is backtest mode, we’re being encouraged to short. I suspect this is a head fake and that SPX’s drop will be cut short by the rising SMA5 10 and we’ll see it push on up to the channel top at 2376.40ish.


 UPDATE: 10:00 AM
Mom and Dad are fighting again, with VIX plunging to break SPX out of its purple channel and USDJPY plunging to keep it in. CL is cowering in the corner, hurt and confused. I’d try a short position here at 2376.42 with tight stops just in case VIX is head-faking us.
We might get only a backtest of the SMA10 at 2373.33. But, if we’re lucky, we could close this morning’s gap or better. We’ll find out when the rising SMA5 10 arrives at 2373.33. Keep in mind that Fridays — regardless of direction — tend to be head fakes which are often undone the following Monday.


UPDATE: 11:05 AM
SPX just reached the SMA5 200, almost closing this morning’s gap. We should expect a bounce here, especially as VIX just backtested its SMA10 and the purple TL. Day traders/scalpers might wish to cover here and/or try a long position. But, I don’t see this going all that high. CL, the liquified mastadon in the room, is still edging lower.

* * *
Okay, on to oil. The question I’m struggling with is “how low is low enough in order to keep CPI at an acceptable level?”
This begs the question “what’s acceptable?” CPI was up to 2.5% in January (reported Feb 15.) That figure incorporated a 24% YoY in the average monthly price of gasoline as reported by the EIA. For February, the YoY increase was 32.5%. All things being equal, we should expect Feb CPI (to be reported Mar 15) to come in higher — perhaps 2.6-2.8%.
CPI is a closely managed number. The gas component, for instance, is derived by surveys conducted three times during the month — which seems to me to be rife with opportunities for data error and manipulation. And, once the data is collected, the real fun begins. For a great treatise on how and why CPI is manipulated, see THIS ARTICLE by John Williams.
In any case, since today’s employment number was healthy enough, next week’s February CPI release will be accompanied by a Fed rate increase (CPI at 8:30AM, the rate decision at 2PM) which will seem perfectly justified by the data. Who knows, maybe the PCE will even hit 2%.
The “markets” will react however they’re going to react. But, the tone will be set for an environment of rising inflation that pretty much everyone has been expecting. I’m guessing the FOMC won’t want to let things get away from them, so they’ll be looking to hold rates steady the following meeting on May 2-3. This meeting will, of course, incorporate the April release of March’s data.
That brings us around to a forecast. Here’s what I was doing last night instead of sleeping. Jan and Feb’s CPI numbers are already baked in at 2.5% and something north of 2.5%. If the Fed wants to take a breather in April, it’ll need for the Mar 2016 to Mar 2017 comparison to hold steady or, preferably, come in a little lower than the previous month.
 Here are the actual EIA data. If we hold March’s YoY increase to 24% as occurred in January, then we’d be looking at an average price of 2.349 in March versus 1.895 recorded in Mar 2016 and 2.227 in Feb 2017.
In other words, gas prices could actually rise 5.5% in March and still come in at a 24% YoY increase. Again, presuming that all else remains equal, this would theoretically lower CPI back to 2.5% (a gross oversimplification, to be sure.)

Will the Fed be happy with CPI stabilized at 2.5%? Who knows? But, if they wanted it to revert to, say, December’s 2.1%, it would change things a bit. Gas prices increased only 12.6% YoY between Dec 2015 and Dec 2016 — half the January rate of increase.
Working backwards, this would suggest an average price for March of 2.135 — a 4.2% decrease from February. Again, all things being equal, this is not a dramatic drop from current prices. What, then, does this imply for prices over the next few weeks?
April RBOB futures have sketched out a pretty clean rising channel since last summer. Prices are currently testing the channel bottom, which — so far — has held. The problem is the falling white channel. Since RB dropped through its midline this week, it leaves open the idea of the rising white channel breaking down — at least intraday — and RB tagging the .786 or even .886. An alternative is the red .786 at 1.5256. If we look at the continuous contract chart, this seems reasonable. A drop to 1.5259 — the bottom of the rising red channel and the red .786 — would match up nicely with a drop to 1.5256 in RBJ7.
 If that were the actual bottom, it would produce a rather mild Mar 2016 – Mar 2017 increase in prices — assuming RB bounced off the bottom and the middle of the shaded area represented the average price for the month (again, lots of conjecture.)
What would this mean for CL? As long as we’re spitballing this, how about the rising purple TL that intersects the bottom of the shaded March price range? It’ll be around 45.36 on Monday. It would be a sharp drop, and would mean dipping below the SMA200. But, CL did it before in both August and November 2016.
There’s another reason I like this TL and a target price of 45.36: channels. We’d like to see SPX backtest the yellow channel it broke out of in mid-Feb (currently around 2345) and/or the 1.618 Fib at 2335.34. But, the rising purple channel has prevented that from happening so far. If much more time goes by, the gap will be even larger and the backtest even less likely.  If CL were to dip below or close below its SMA200, SPX might just have a chance to drop those extra 25-35 points — especially with the fear of an impending rate increase thrown into the mix.
If SPX were to close above yesterday’s lows or anywhere in the purple channel, it would make for a lovely head fake for a big plunge early next week. Getting back to CL…a drop to the purple TL would also constitute a tag on the red .618 at 45.36. It’s rubbish on the purple harmonic grid, so we need some backup targets in case 45.36 doesn’t hold.
 We could choose the red .786 at 42.68 or 41.08. Both are relatively close to the white channel midline. And, the purple .500 at 40.65 is in the neighborhood. But, again, none are a great fit with this channel. That’s why I wondered if they were hoping for a “better” channel.
Due to the lack of solid tags on its top, this one is a little suspect. But, it might work in establishing a downside target. It also provides little help in getting prices back to the sweet spot (at least for OPEC) that is good enough to balance the budget but low enough to keep US frackers from increasing production.
So, here’s another alternative that I like better. The red channel fits the highs nicely, and its midline works nicely with the Aug lows. The red target at 42.68 would presumably be low enough to temper fracker enthusiasm, but not put OPEC out of business. The nice, added benefit is the median of the shaded March 2017 range would be about 25% higher than the median of the shaded Mar 2016 range.
So, I’ll stick with this forecast for now: a further drop next week to 45.36, and if that fails, to 42.68. Gasoline, which has presented better inventory numbers lately, would drop to around 1.51-1.52 (April futures.)
If things go all to hell, and the Fed needs a reason to increase accommodations in June, then look for CL to drop to the purple .618 at 37.2 in late May (the yellow dot.) It would confer a large (10%+) drop in oil/gas prices versus the year-earlier comparison and would test frackers’ contention that they can break even at prices as low as $30/barrel. Just for grins, we’ll couple all that with SPX targets of 2345-2347 by next Monday and 2335 by Wednesday or Thursday. That would enable VIX to reach the SMA 200 at, say, 13.67. And, as long as I’m going out on a limb, let’s look for USDJPY to continue up toward 120.11 in order to stop the bleeding.
UPDATE: 3:09 PM
Clean, updated SPX chart shows that today’s action continues to follow a very precisely scripted path. Note the .618 reversal. A close at or near 2359.32 might make sense, especially given that CL has pushed below its SMA200. And, I’ll revised the purple target to 2348.47 — the 1.272 Fib extension.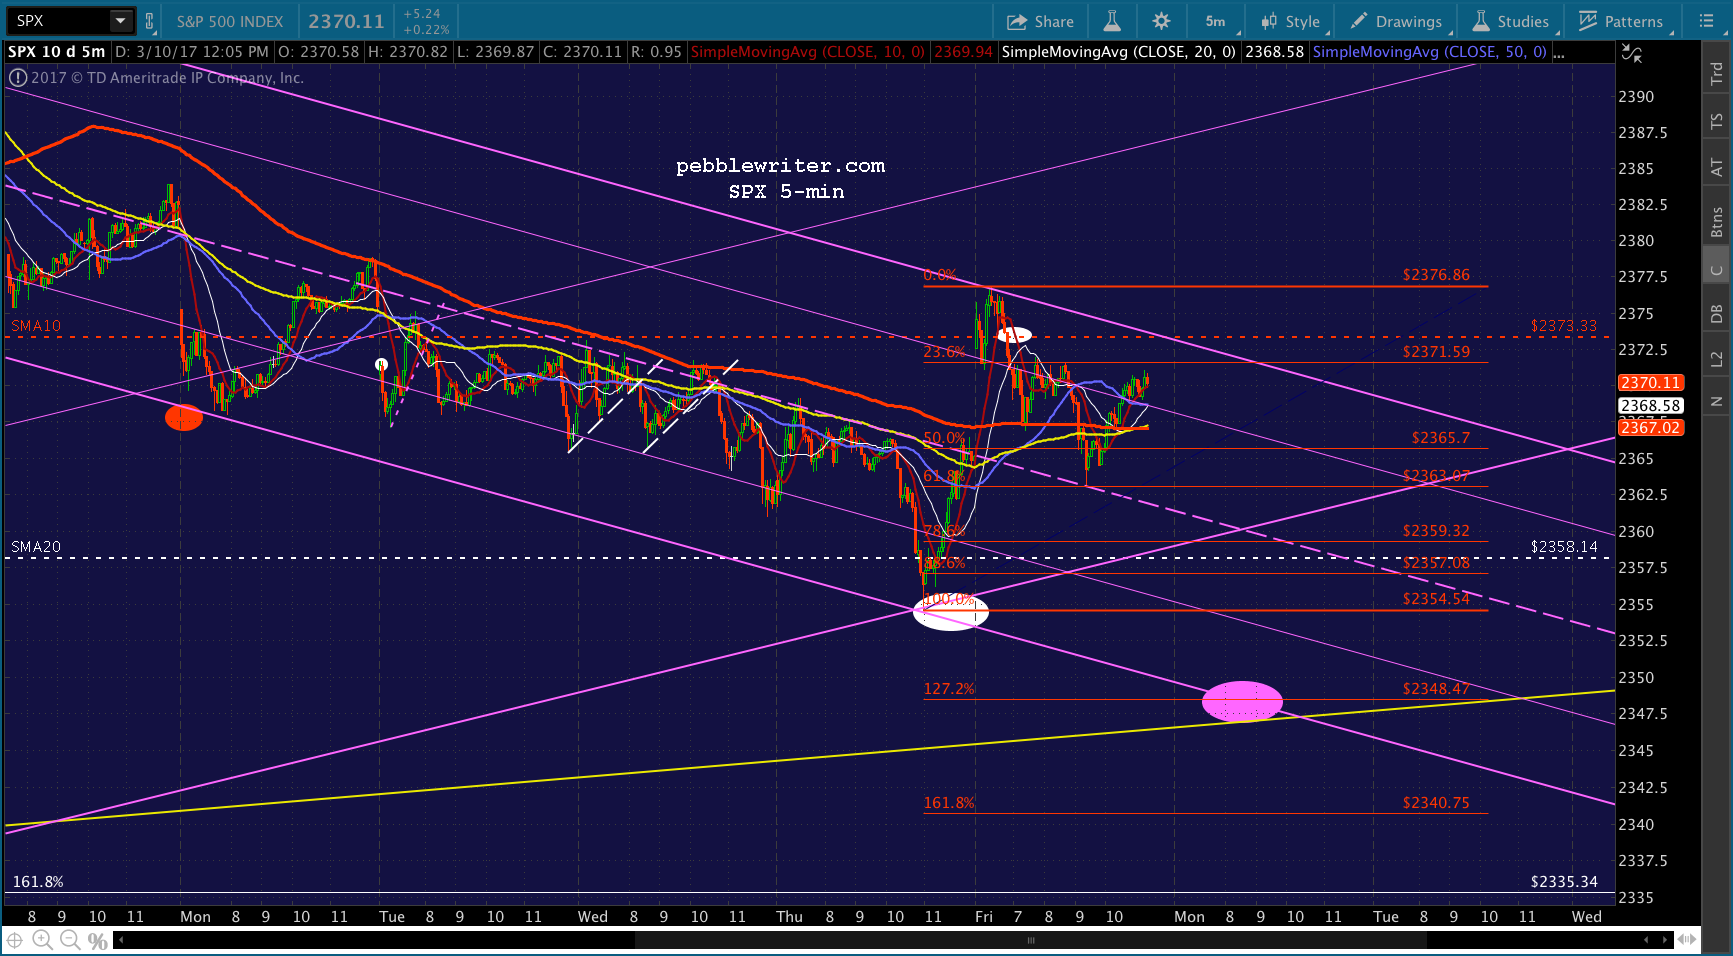
UPDATE: 3:30 PM
With CL off 1.7% and RBOB off 1.9%, only VIX is driving SPX higher. I’m not dissuaded from shorting here. But, the clearer opportunity is in remaining short CL and RBOB.


 In mid-January, I mentioned SCO — an ultrashort oil ETF that at time was trading at 32. I notice, today, that it reached 39.61 — a nice 23% bump. From the looks of its chart, there’s more to come.