Author: pebblewriter

  • By Hook or By Crook

    With futures stuck in a consolidation for the past two weeks…

    …and, VIX finally breaking down, is it just possible we’ll see a rally this morning?

    And, why not?  Thanks to the timely dip in oil and gas prices (and, some creative accounting over at the BLS), CPI came in at an annual rate of 2.7% — down from last month’s 2.9%.

    In other words, the argument for a December rate hike just got a little weaker.

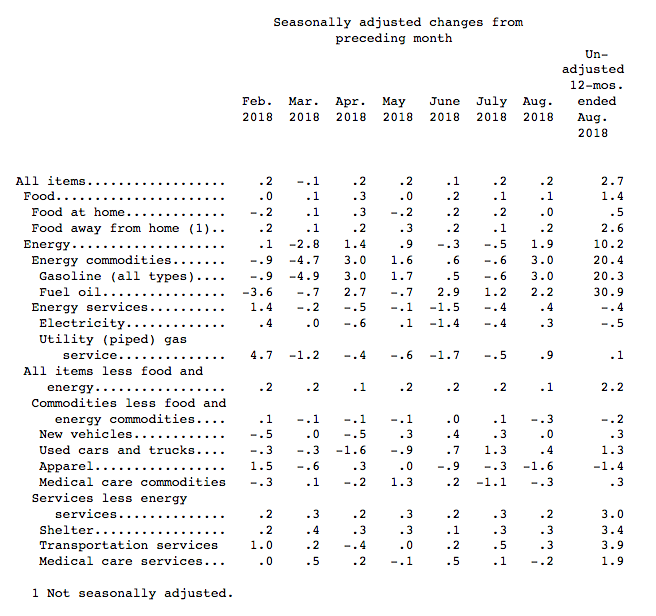
    Toss in a bullish (sp?) statement from Draghi [announcing the end of QE as the ECB trims its growth forecast …yeah, right] and the algos are loving it.

    continued for members(more…)

  • Core PPI Ticks Higher

    This is the most interesting PPI report in some time.  The headline number fell from 3.3% to 2.8%.  But, Core PPI (less food, energy and trade services) ticked higher.  We’re used to seeing food and energy prices as the cause of higher inflation.  Apparently, this time it’s everything else that is ticking higher.

    When core price increases become problematic, the solutions aren’t quite as simple as driving down oil/gas prices (which, by the way, bounced pretty dramatically yesterday.)

    It should be interesting to watch the 10Y.  Will the triangle continue to hold?

    For now, DXY is hanging in there – back above the important trend line established back on June 14.

    continued for members(more…)

  • Charts I’m Watching: Sep 11, 2018

    After a reasonably clean backtest of its January highs, ES has broken trend and is back below that benchmark as well as its SMA20.  Currently in the red by 11 points, SPX is indicated as opening below its January highs (2872.87.)  So, either we get some algo heroics in the next hour or the market will be in for some trouble in the session ahead.

    Without question we face some important tests today — starting with TNX, which is back to the top of its triangle.  It has now been over seven months since it reached our 28.56 target.continued for members(more…)

  • Monday Morning Meltup

    The backtest we expected last week played out almost exactly as planned.  So, naturally, we’re getting a fairly typical Monday morning meltup.


    None of last week’s troublesome issues have dissipated, but the market has made a statement about additional downside.  All we’re waiting on now is for VIX to follow through with a breakdown.

    continued for members(more…)

  • It’s a Wonderful Market

    SPX and ES had no trouble reaching our initial downside targets — a backtest of their January highs.  We wondered, however, whether the SMA20s, loitering just below, might come into play.

    Sure enough, ES tagged its SMA20 with ease.  But, emini traders strongly resisted a drop through the SMA20 – bad mojo, don’t you know.

    So, SPX only reached 2867.29, just shy of the SMA20 at 2866.27. And, faster than you can shout “help me Clarence!” SPX bounced the 16 points we anticipated, just like it did on Wednesday.

    It was a near miss..or, was it?  As we discussed on Tuesday…

    One little trick we often see on days when it’s difficult to convince the machines to sell/short down to an obvious bounce point such as the SMA10 is to drive the price merely to where the SMA10 will be tomorrow.  The SMA10 will likely increase by another 5 points tomorrow, so getting within 2-3 points is potentially “good enough.”

    As luck the algos would have it, today’s SMA20 came in at…wait for it…2866.27.  January highs and SMA20 were both tagged.  So, all is well, right?  Not so fast.  Futures are currently off 10 points, banks are tanking, oil and gas are slipping, FB is scurrying toward the basement and TSLA has tumbled 15% since Tuesday’s short call.

    In the distance, sirens.  A mob of nervous investors crowds the door.  Might the Building & Loan actually be in trouble?

    Thanks to overeager algos, the S&P 500 has thus far ignored the threats of tariffs, political turmoil, emerging market meltdowns, rising interest rates and historically high multiples. None of that matters as long as corporations can borrow cheap and repurchase their own shares, VIX can be hammered when necessary, the dollar continues rising and oil/gas prices don’t crash.

    If any of those support mechanisms falters, however…  Well, we’ve seen what can happen.  Keep an eye on 2867.29.

    continued for members(more…)

  • Touchdown

    One of the old adages that’s earned its keep over the years is that “markets take the stairs up and the elevator down.”  In other words, rallies come at a steady pace and corrections happen quickly, without notice.

    That observation might have applied during the hundreds of years leading up to present day.  But, for backtests such as we’ve seen this past week…not so much.  ES completed its backtest of its January highs yesterday, tagging our initial target in a nearly incident-free landing.

    Unfortunately for those who abhor excitement, the final 5 points weren’t quite as smooth.    But, the subsequent runway bounce got the index aloft again without incident.  The only problem: SPX didn’t backtest its January highs — which are the equivalent of about 2872.75 in ES, ideally around 12pm.

    It’s quite likely we’re in for a little more turbulence.

    continued for members(more…)

  • Crypto Carnage

    As the currency turmoil continues, it’s interesting to note that cryptocurrencies are having a worse go of it than EMs.

    Meanwhile, futures dipped enough overnight to finally backtest the SMA10.  They’ve since rebounded enough to backtest the broken red channel.  It remains to be seen whether SPX will join in and backtest its SMA10 and whether both can manage a backtest of their January highs.

    On the commodity front, RB finally tagged our next downside target — cratering 4.5% from yesterday’s highs.

    continued for members… (more…)

  • Waiting…

    ES/SPX failed to reach their 10-DMAs on Friday.  Given the long holiday weekend, those moving averages are now 5-6 points higher — leaving the twin targets even further apart.

    Interesting, isn’t it, that futures are off several points even in the face of huge overnight ramp jobs in oil and gas?  And, on that topic…it has now been 47 weeks since WTI dropped down to tag its 200-DMA (29 weeks for RBOB.)

    The last time each went this long was in 2011, following the first major post-crash peaks when rising oil and gas prices produced 3%+ CPI and 3.5%+ 10Y yields.  It also marked a collapse in the yield curve, from 2.72 in Jul to 1.52 in Sep.

    At least a few of you also remember the 22% collapse in SPX between May and October — with most of it occurring the first week of August when the curve flattened the fastest.

    Of course, it marked major bottoms for USDJPY and DXY, ushering in outstanding trading environments for currency pairs.  Today, with the 2Y and 10Y a scant 22 bps apart and DXY’s recent rally sparking crises in EM currencies, we have to wonder whether a repeat is possible.

    continued for members(more…)

  • A Backtest or More?

    Today should shape up as a battle between holding a much-cherished round number (SPX 2900) and backtesting solid support (the January highs.)

    The futures are off about 5, with yesterday’s downside target of 2878.50-2881.95 still looking good — if SPX will relinquish 2900.

    Much will depend on the yen, which is strengthening in the midst of the EM turmoil…

    …and the 10Y, which has been in a holding pattern for months.  It looks ripe for a breakdown, but that would almost certainly invert the curve and usher in more than a backtest.

    continued for members(more…)

  • Dollar Strength: No Free Lunch

    Don’t look now, but the Turkish lira is taking a beating again.  Much of it is self-inflicted (Erdogan), but it’s impossible to ignore the fact that the breakout from both the white channel and the more aggressive red channel occurred as the DXY rebounded sharply from it’s February lows.

    About 50% of Turkey’s external debt is denominated in US dollars — roughly twice as much as its total foreign reserves.  And, Turkey’s not the only country in trouble.  According to the BIS, EM dollar-denominated debt totals $3.7 trillion.  It recently published a list of 13 countries whose debt represents a bubble just waiting to pop.

    The US, as a net importer, benefits from a strong dollar.  It keeps inflation low and helps prop up the stock market.  But, at what point might the brewing currency crisis come home to roost?

    Futures are off about 5 points this morning, with ES currently backtesting the channel from which it broke out yesterday.  Holding it will be the important test for equities.  Stronger support remains at 2878.5, where the red channel bottom intersects with the former highs.

    continued for members(more…)