

ES/SPX failed to reach their 10-DMAs on Friday. Given the long holiday weekend, those moving averages are now 5-6 points higher — leaving the twin targets even further apart.
Interesting, isn’t it, that futures are off several points even in the face of huge overnight ramp jobs in oil and gas? And, on that topic…it has now been 47 weeks since WTI dropped down to tag its 200-DMA (29 weeks for RBOB.)
The last time each went this long was in 2011, following the first major post-crash peaks when rising oil and gas prices produced 3%+ CPI and 3.5%+ 10Y yields. It also marked a collapse in the yield curve, from 2.72 in Jul to 1.52 in Sep.
At least a few of you also remember the 22% collapse in SPX between May and October — with most of it occurring the first week of August when the curve flattened the fastest.
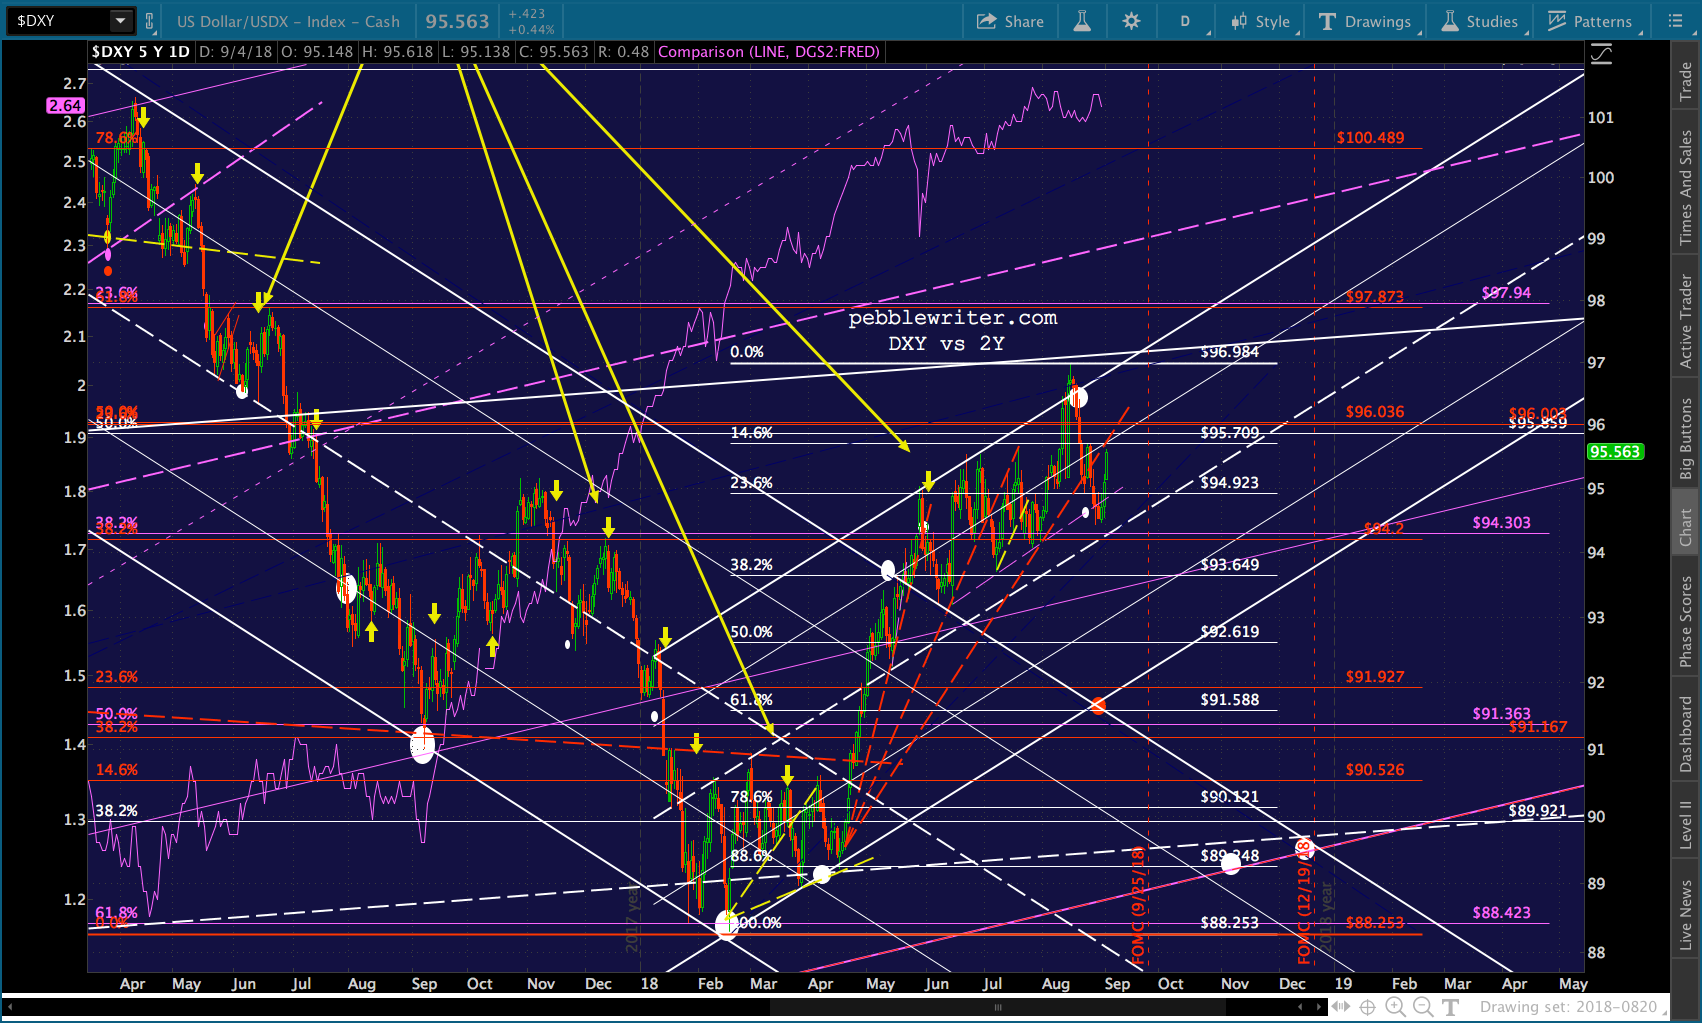
Of course, it marked major bottoms for USDJPY and DXY, ushering in outstanding trading environments for currency pairs. Today, with the 2Y and 10Y a scant 22 bps apart and DXY’s recent rally sparking crises in EM currencies, we have to wonder whether a repeat is possible.
continued for members…
TNX’s continued levitation feels very long in the tooth.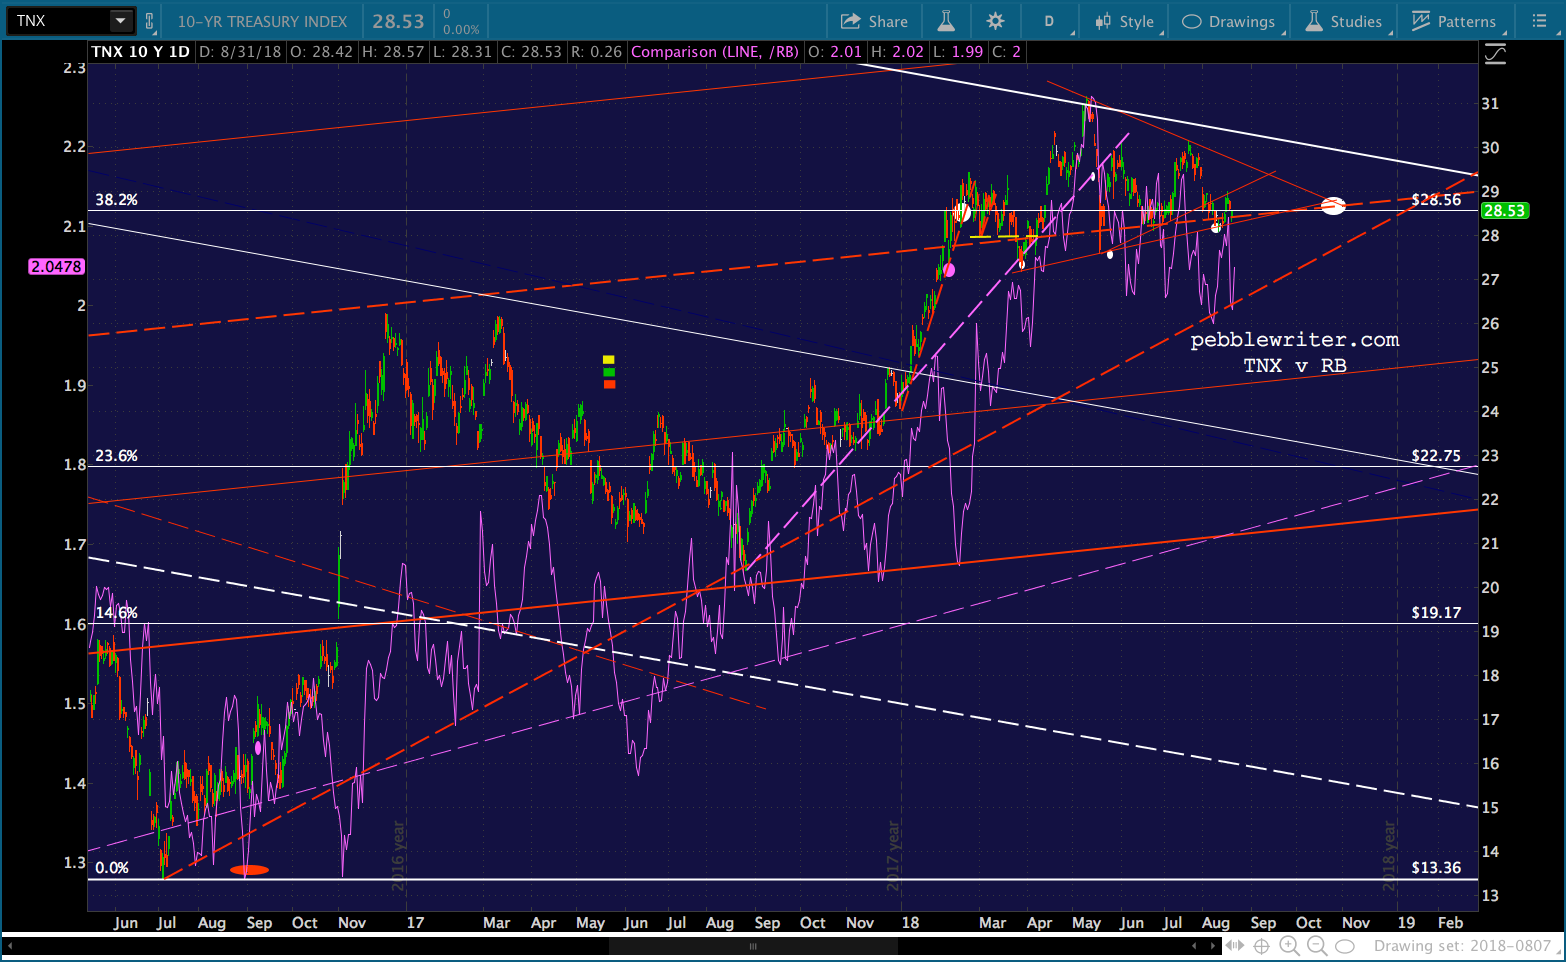
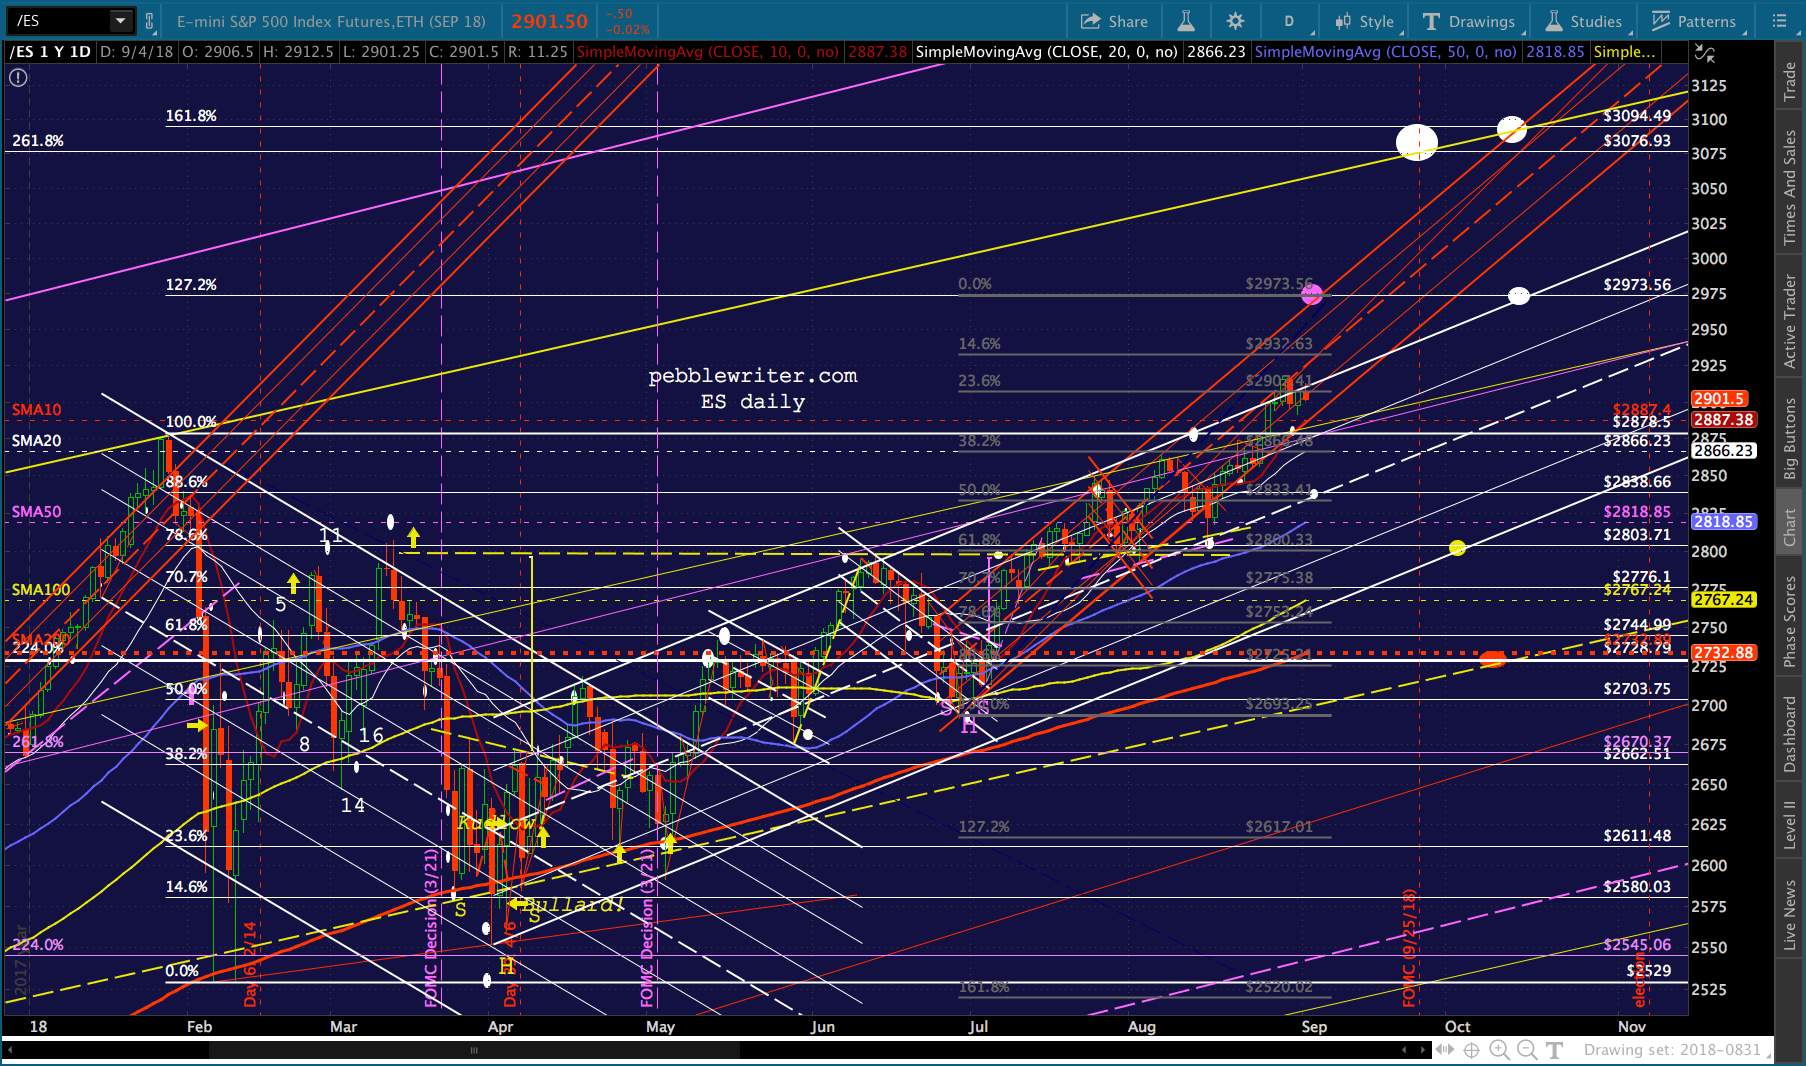
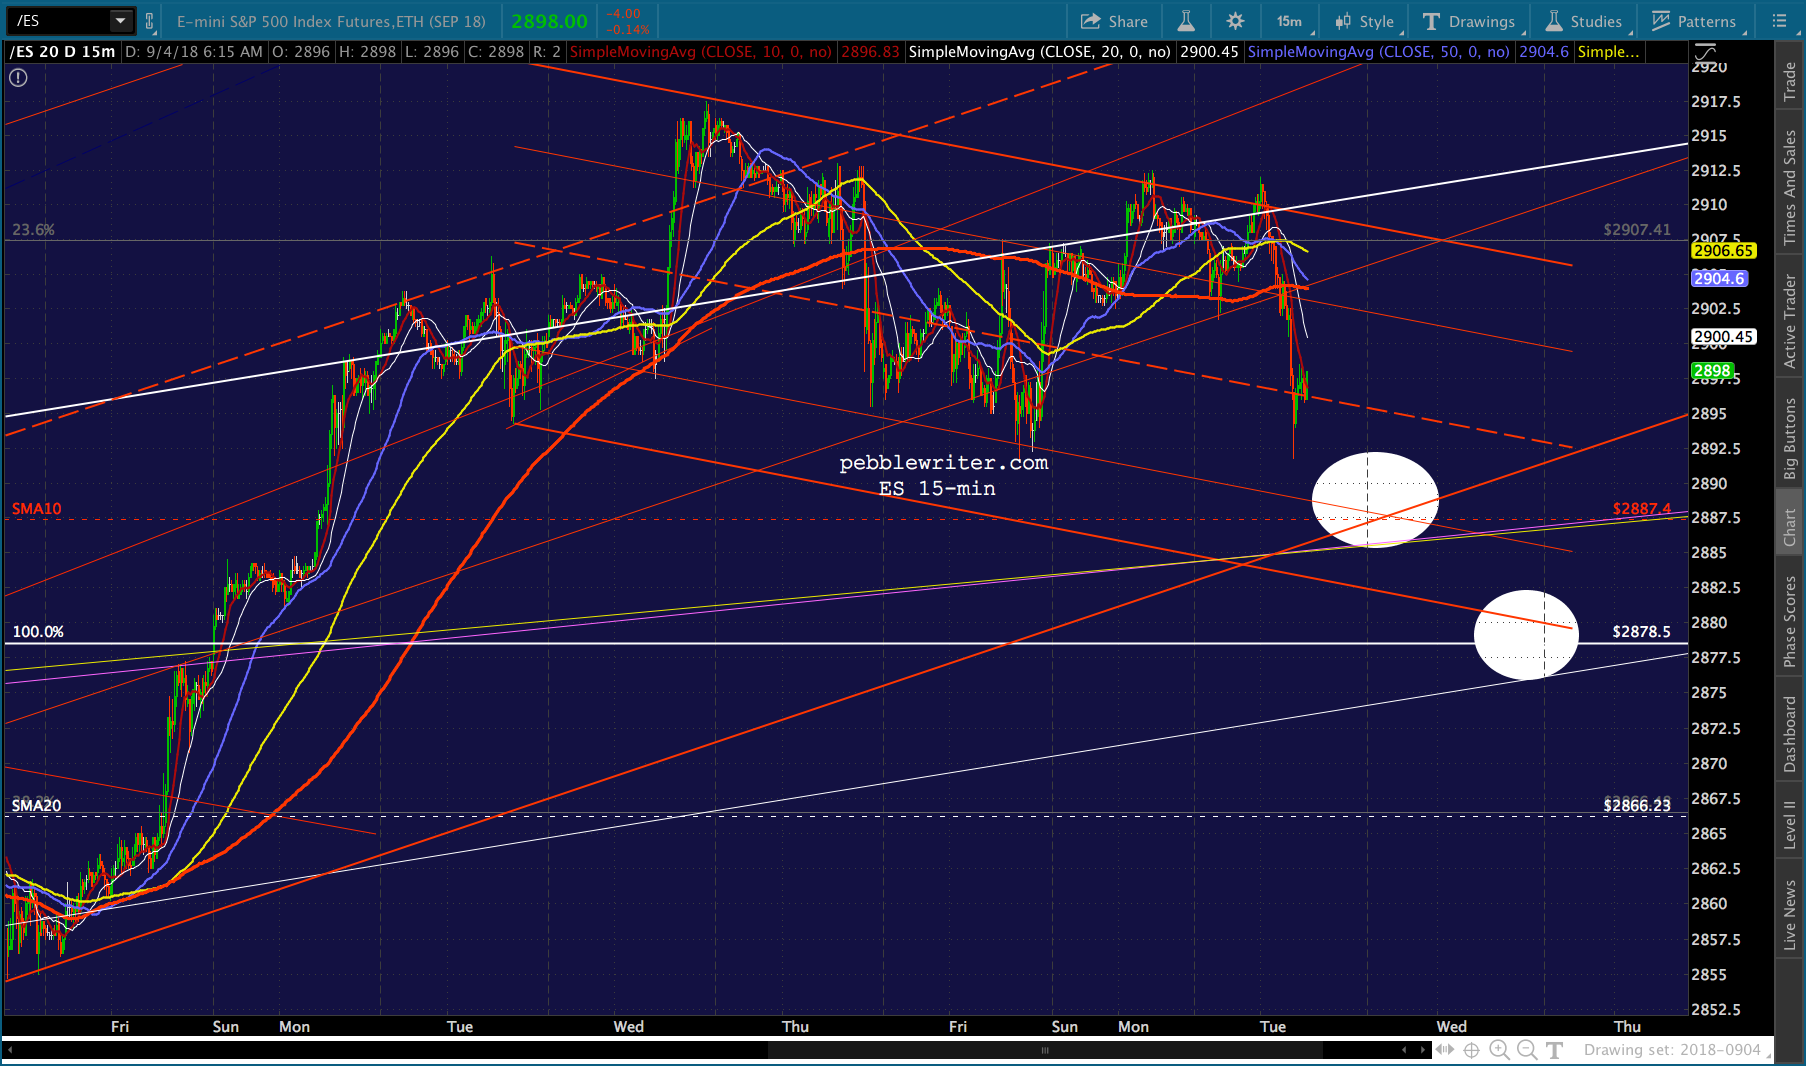
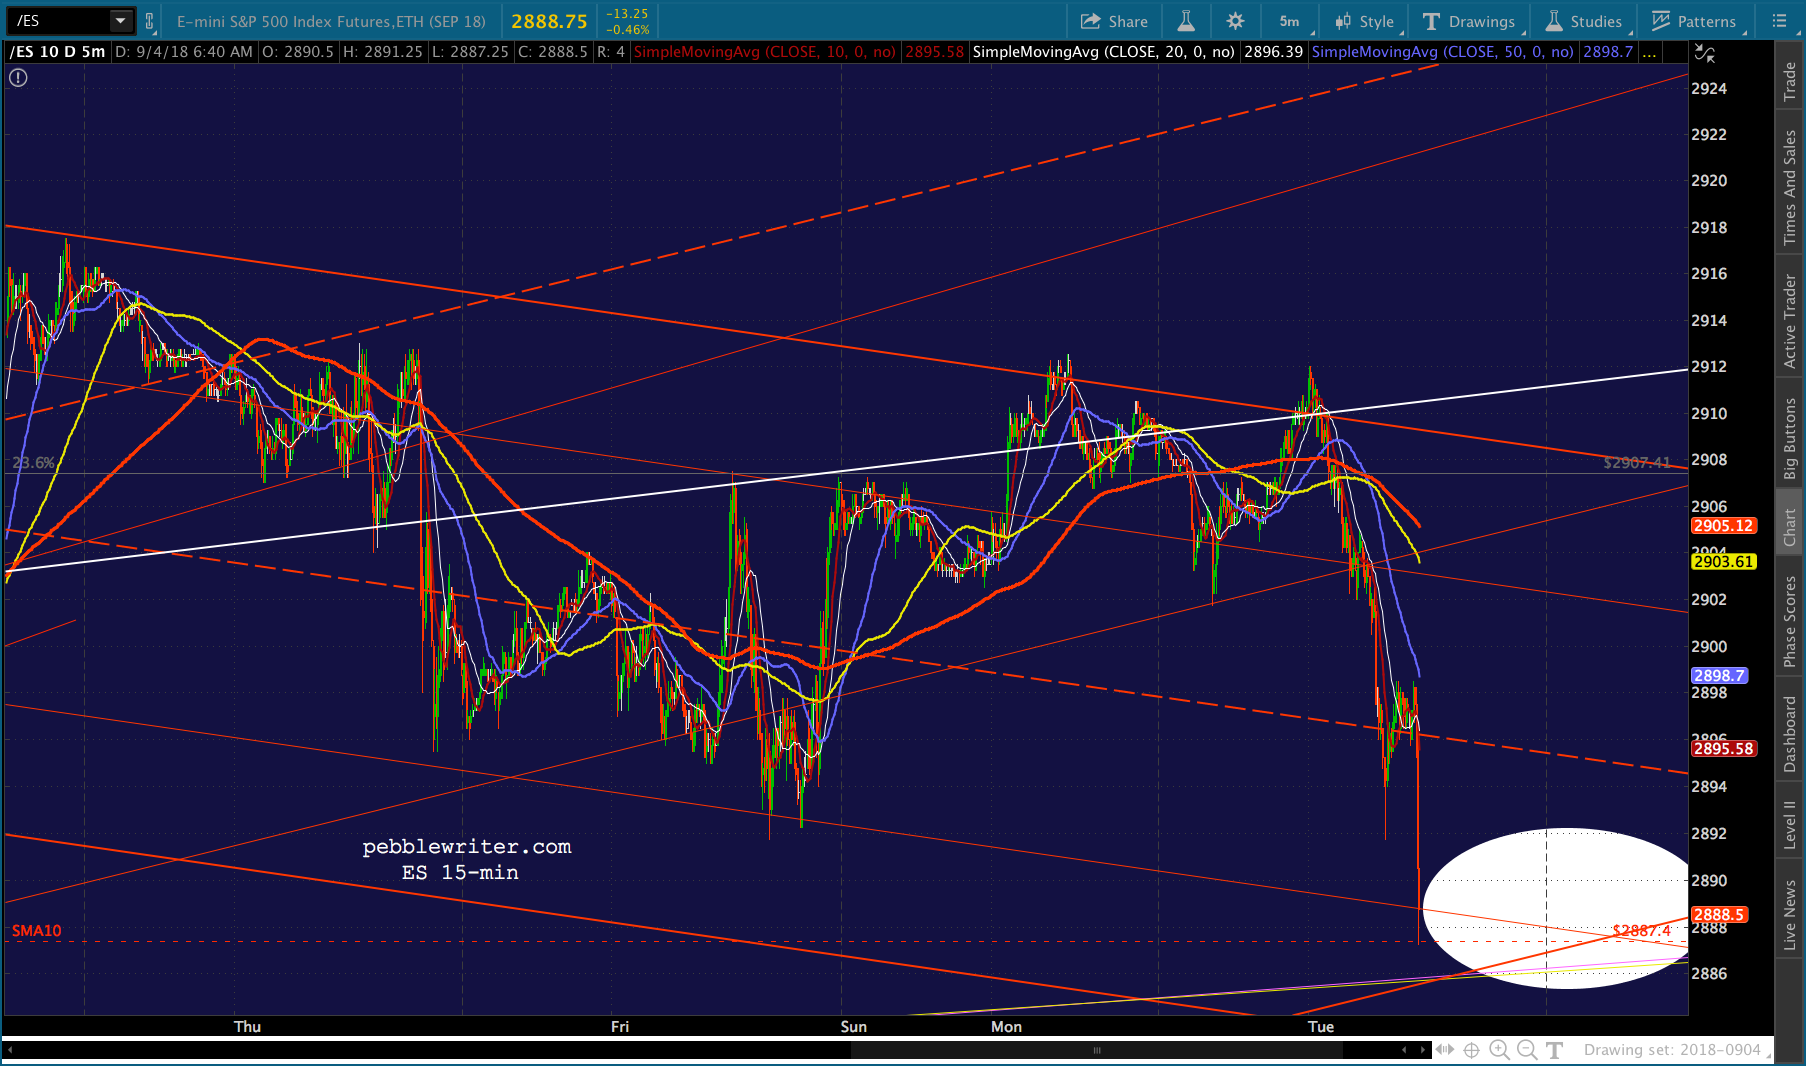
ES’ SMA10 has risen from 2881.95 to 1887.40…
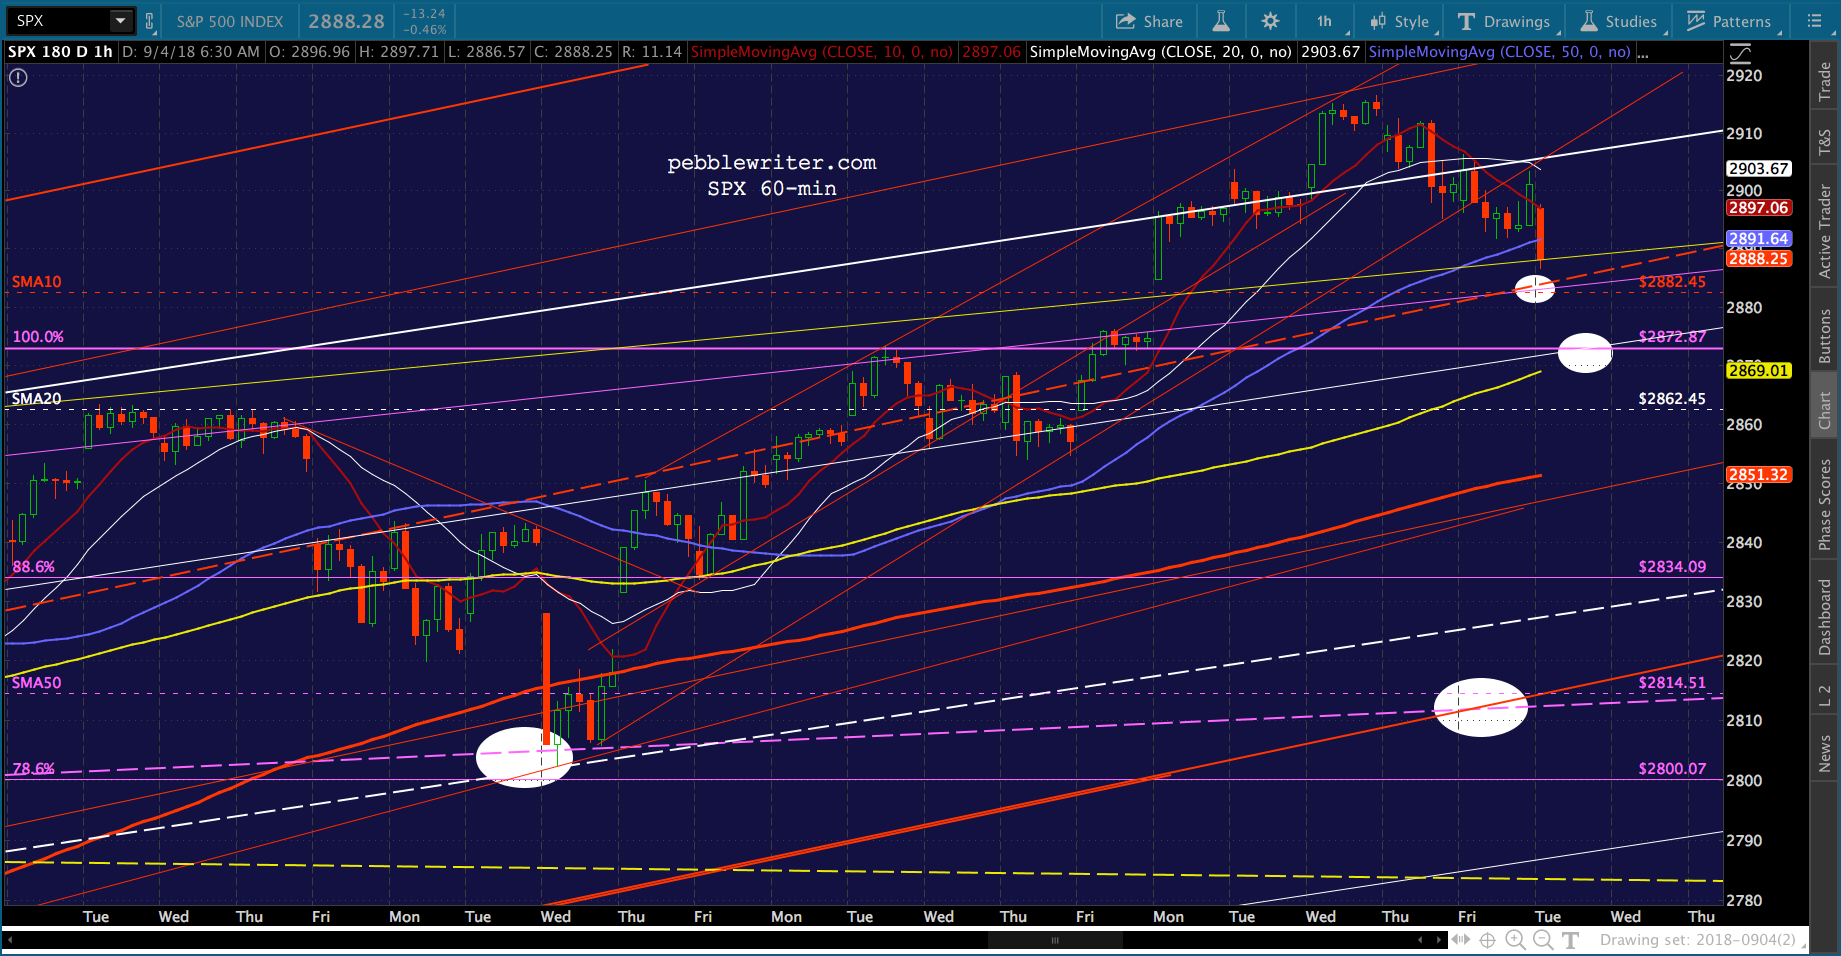
…and SPX’s from 2877.31 to 2882.45.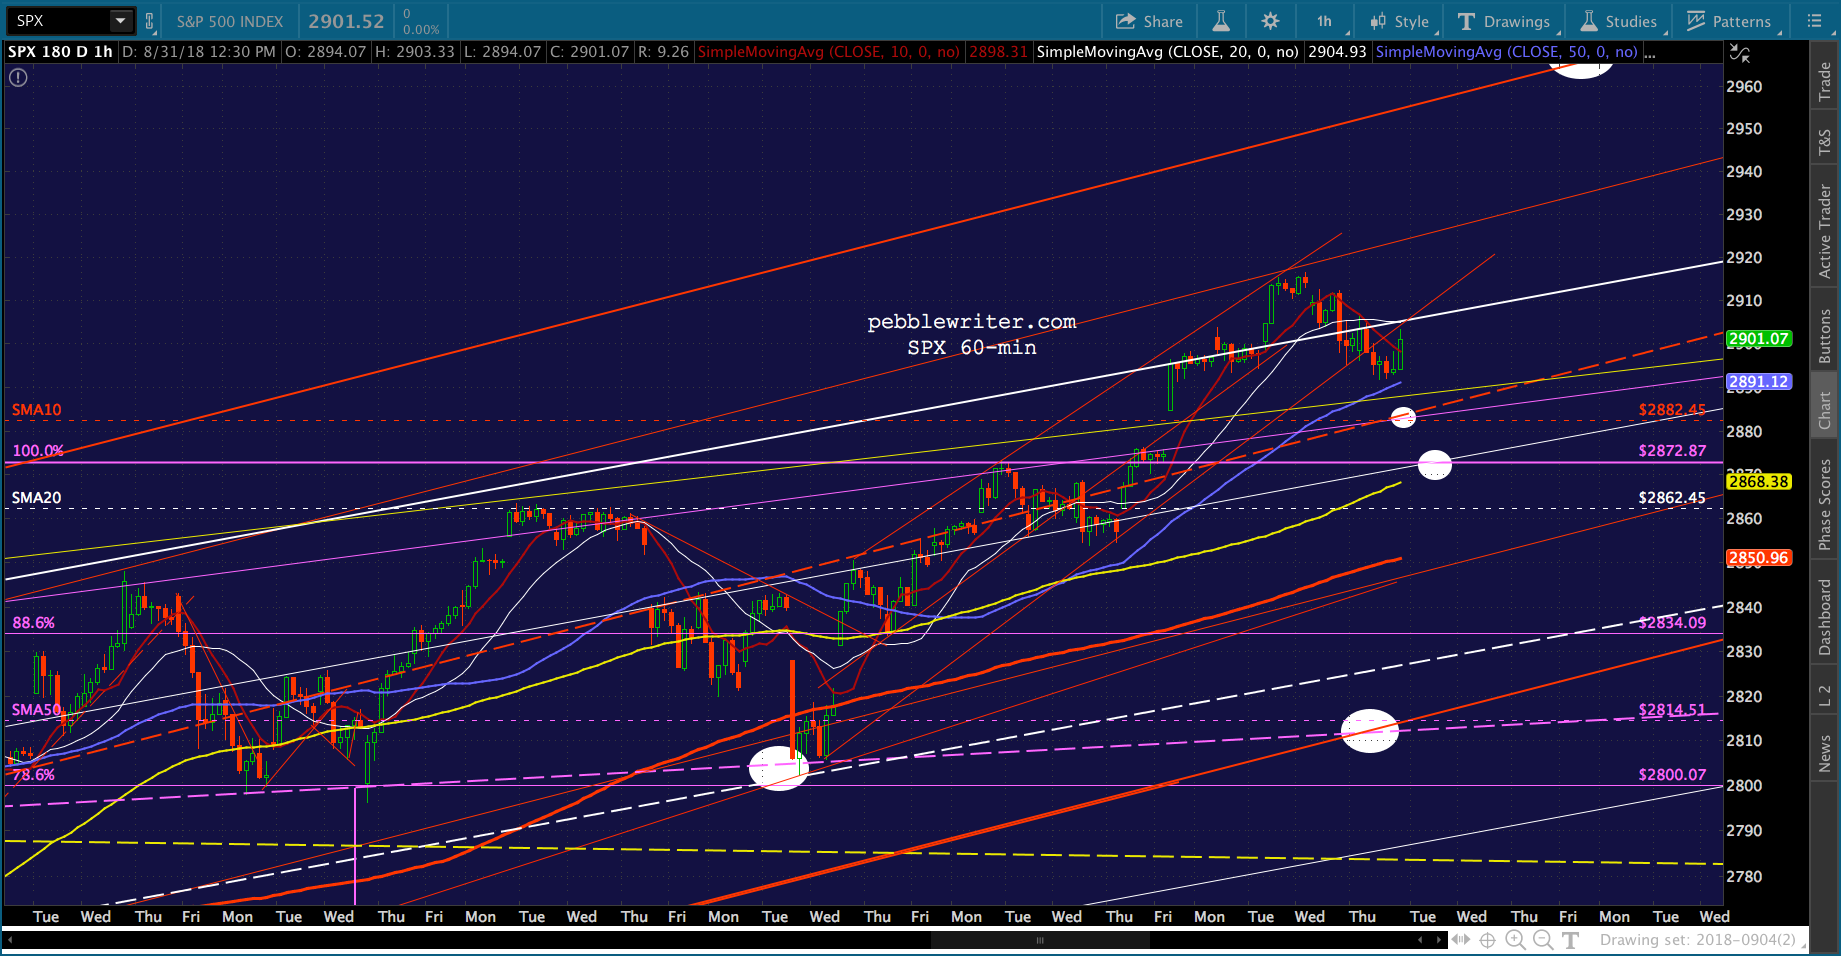
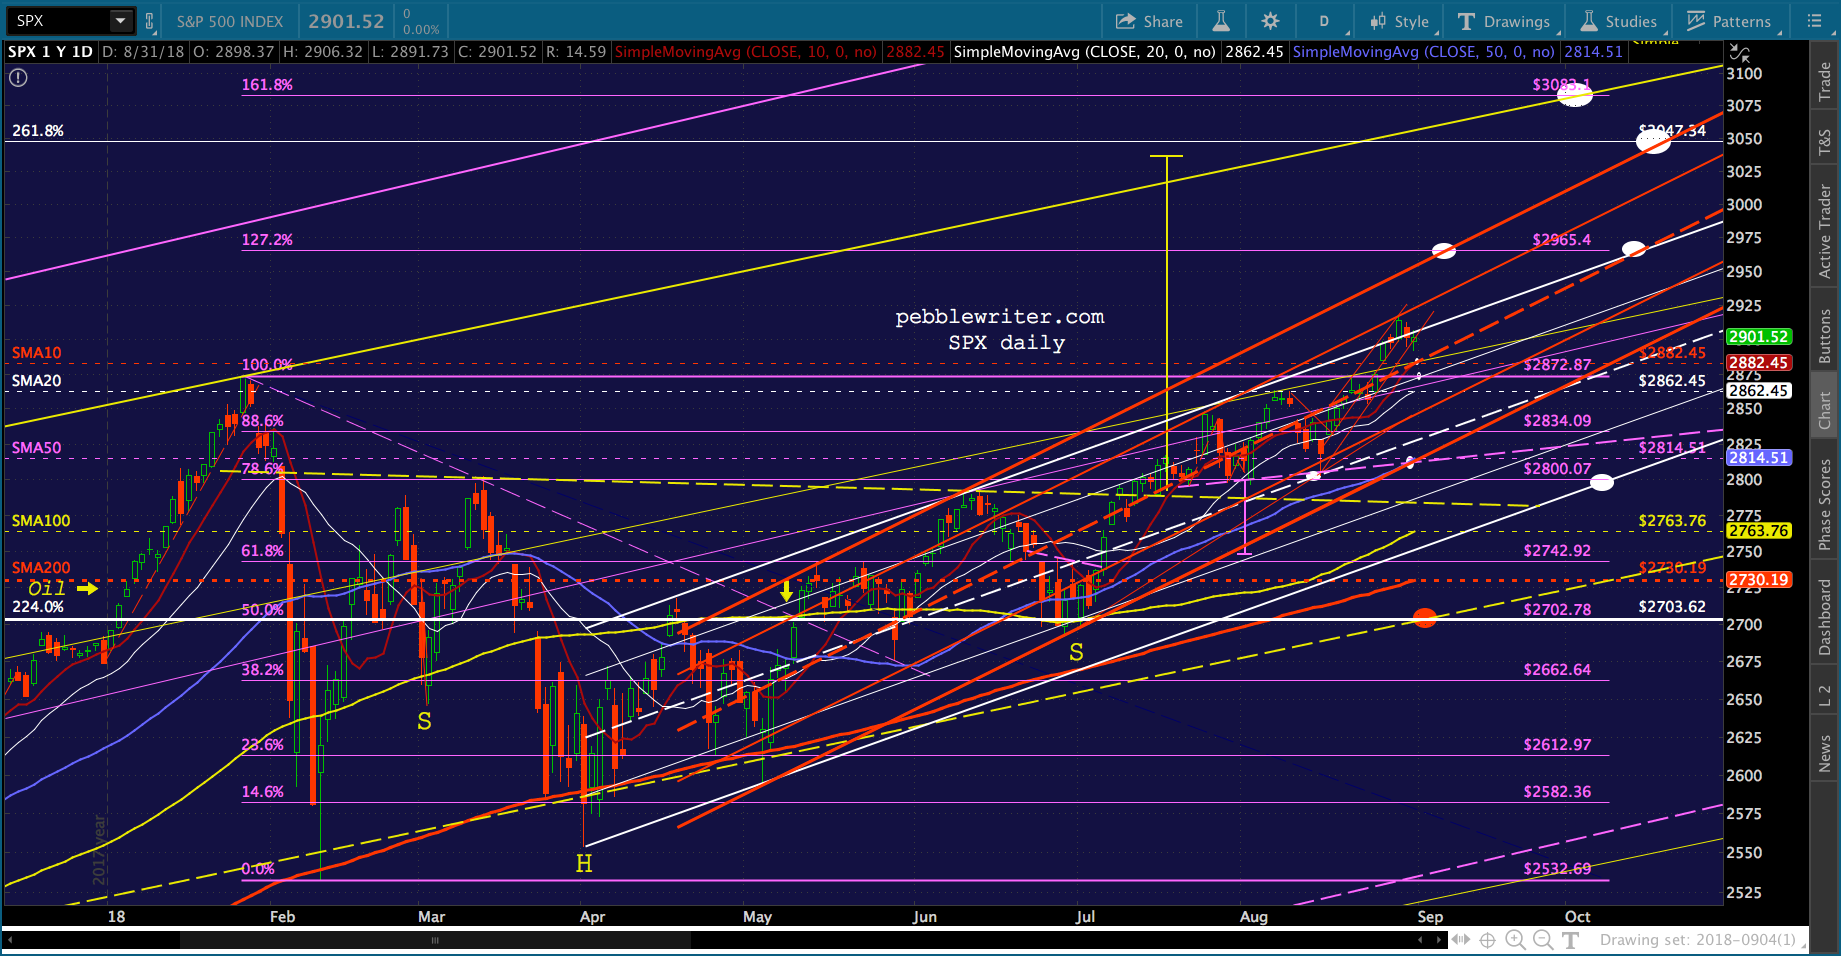 This makes the risk of a drop to backtest the previous highs of 2878.50 (ES) and 2872.87 (SPX) even dicier. As we pointed out Friday, we also have round number support at 2900 to contend with.
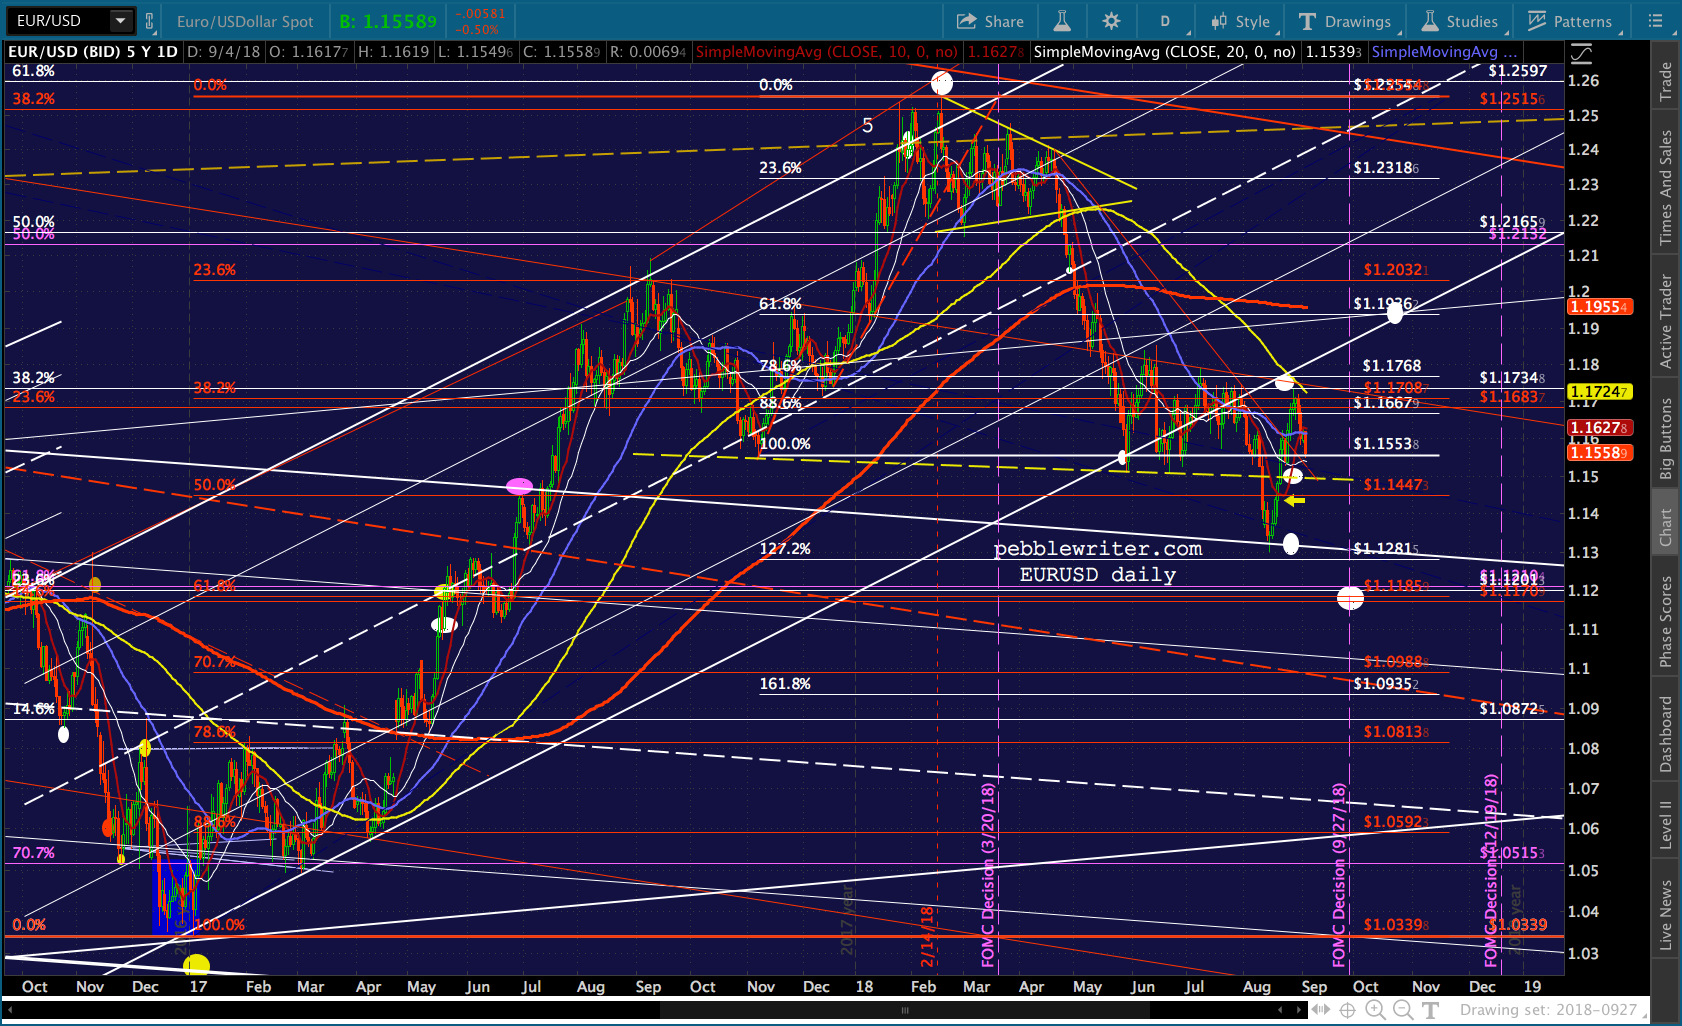
VIX continues to seep higher, with the SMA200 at 14.64 still the most obvious resistance.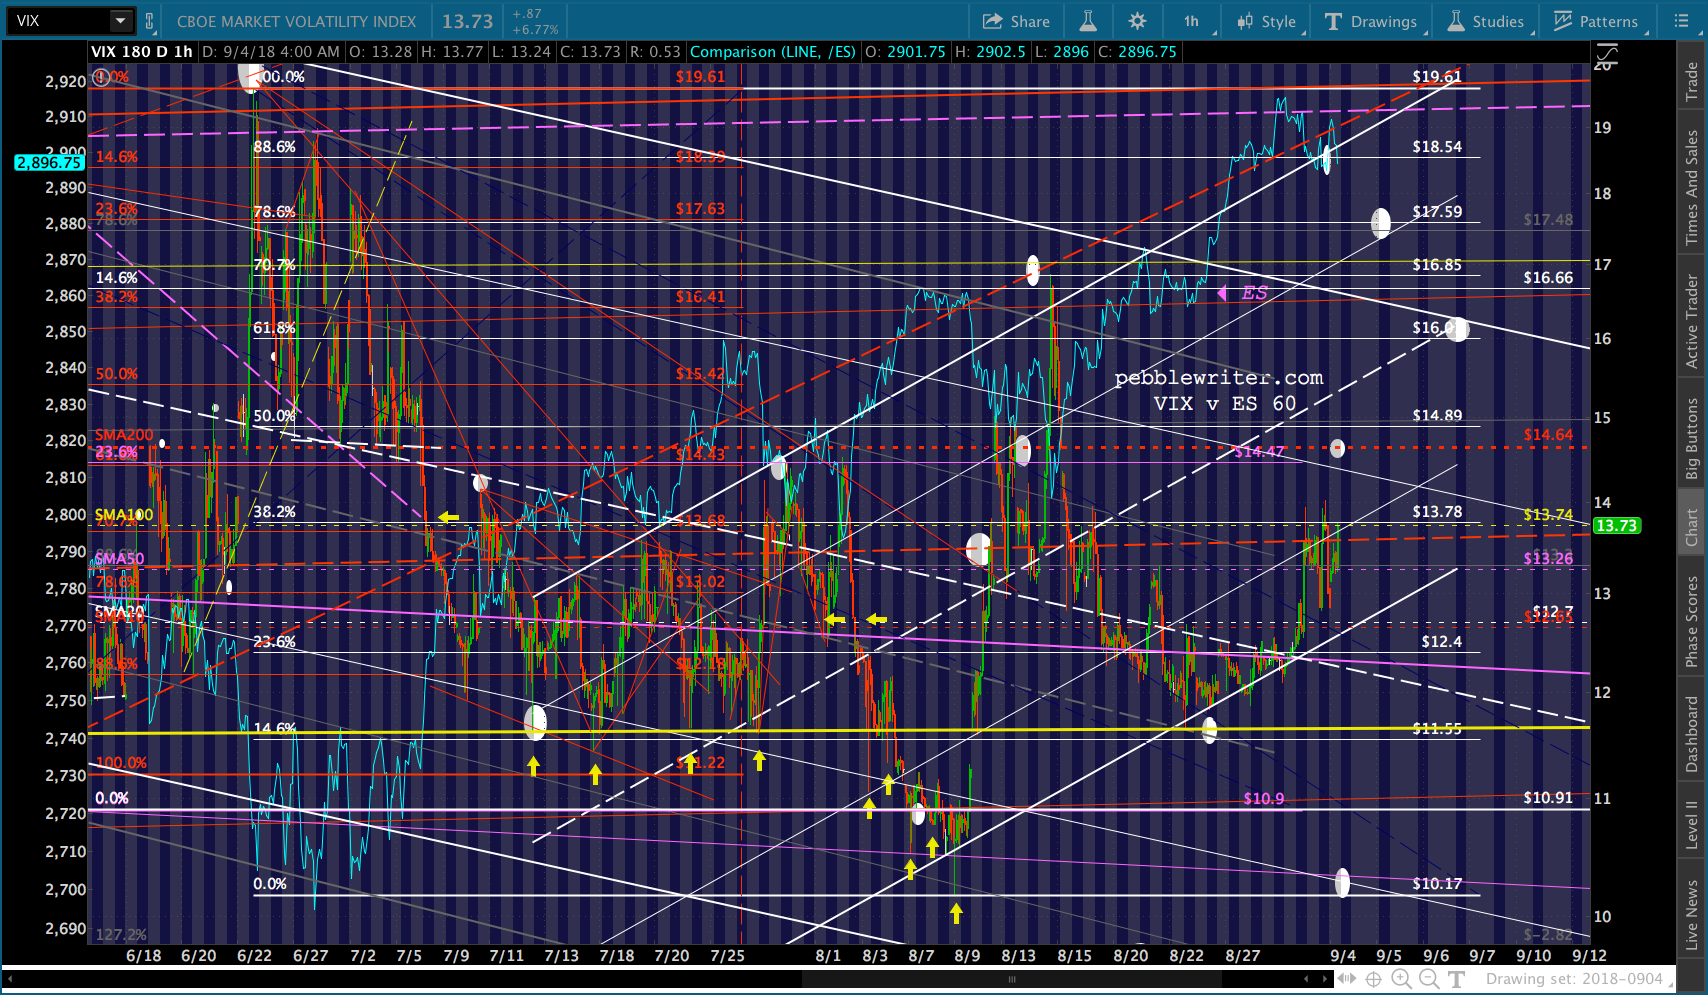 Currencies are in a position to help, with DXY regaining its purple TL thanks to a slumping JPY and EUR.
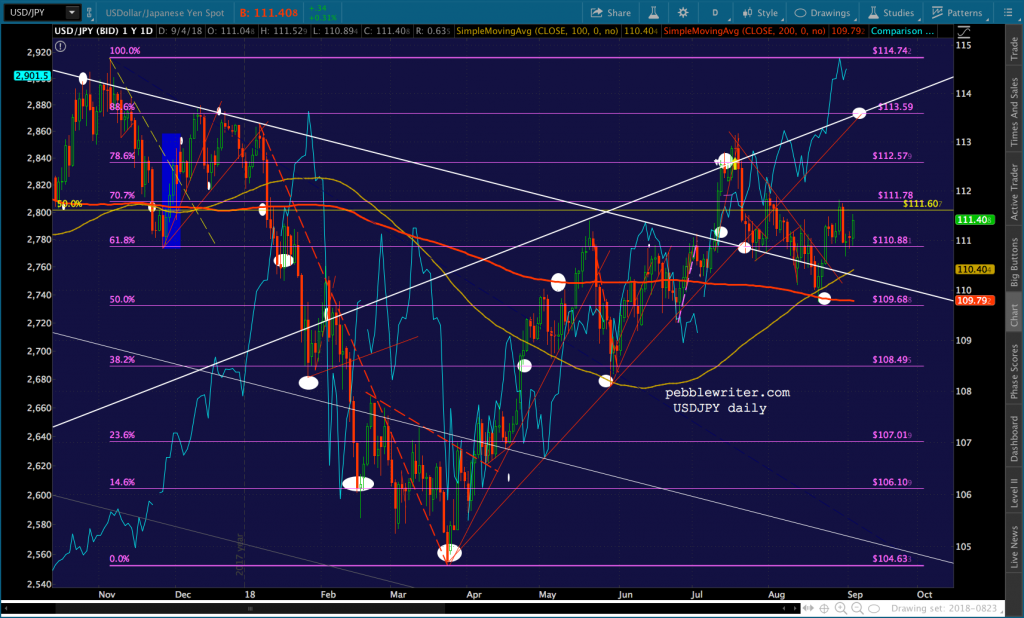
Oil and gas are getting pre-API bumps from Tropical Storm Gordon (potential hurricane) and the usual Middle-East rumblings. Interestingly, CL has reached its .786 channel line…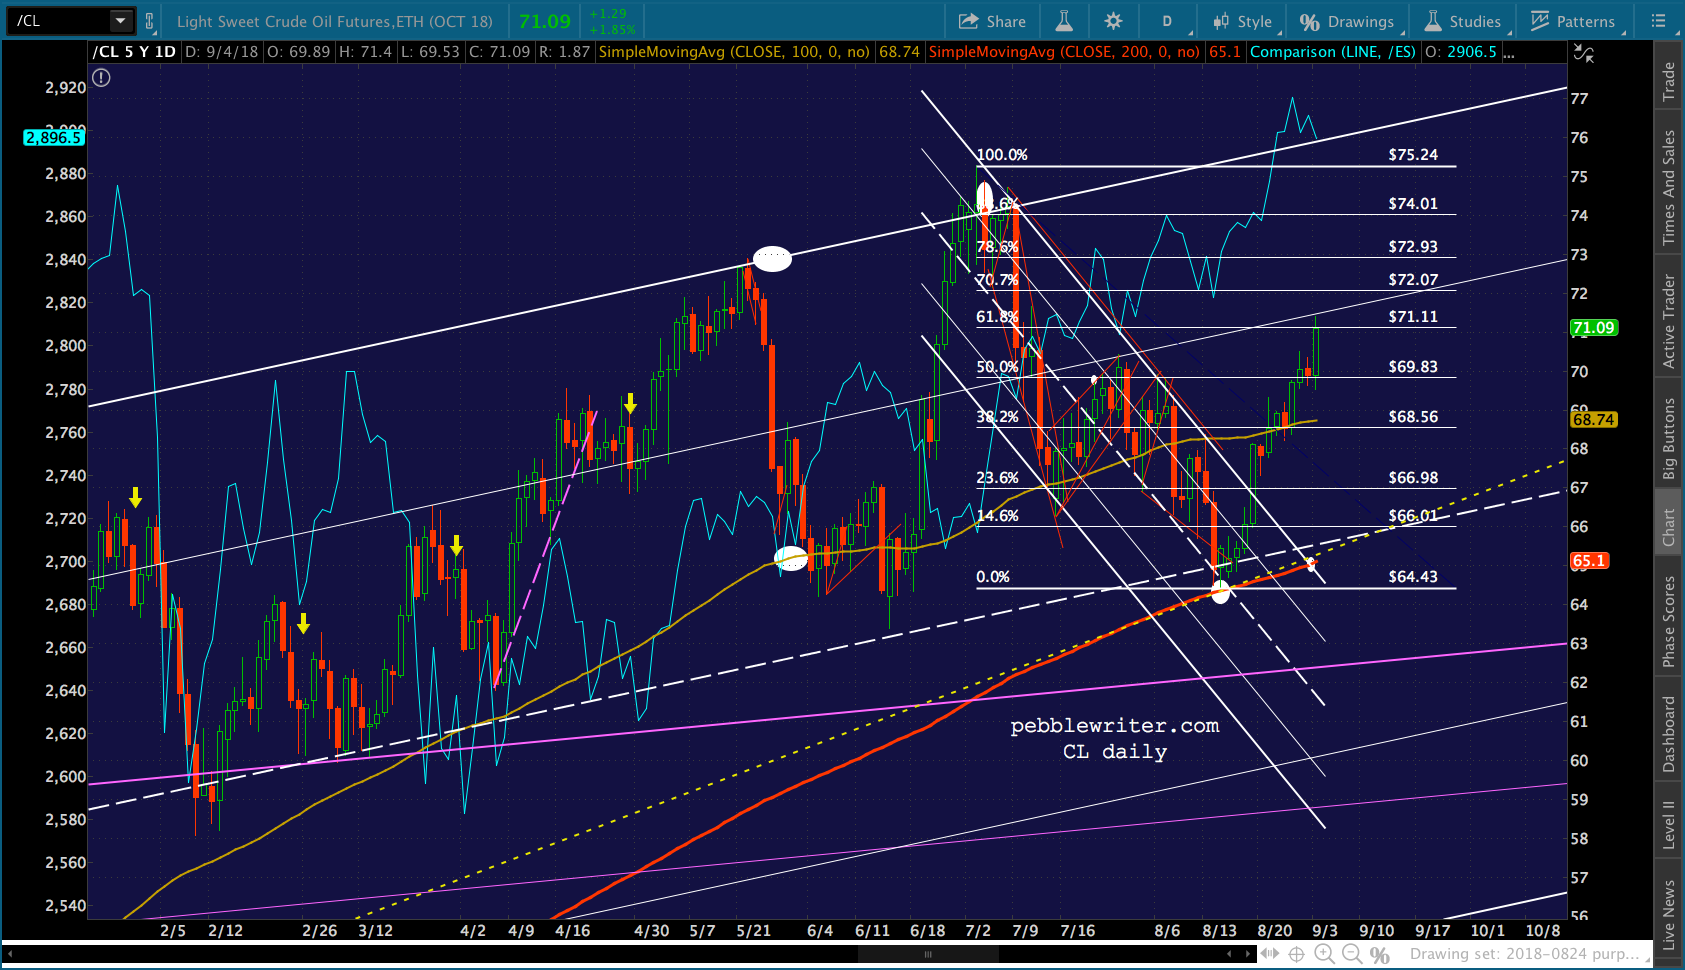 …and RB passed up a perfectly good opportunity to backtest its purple channel and SMA200 all at once.
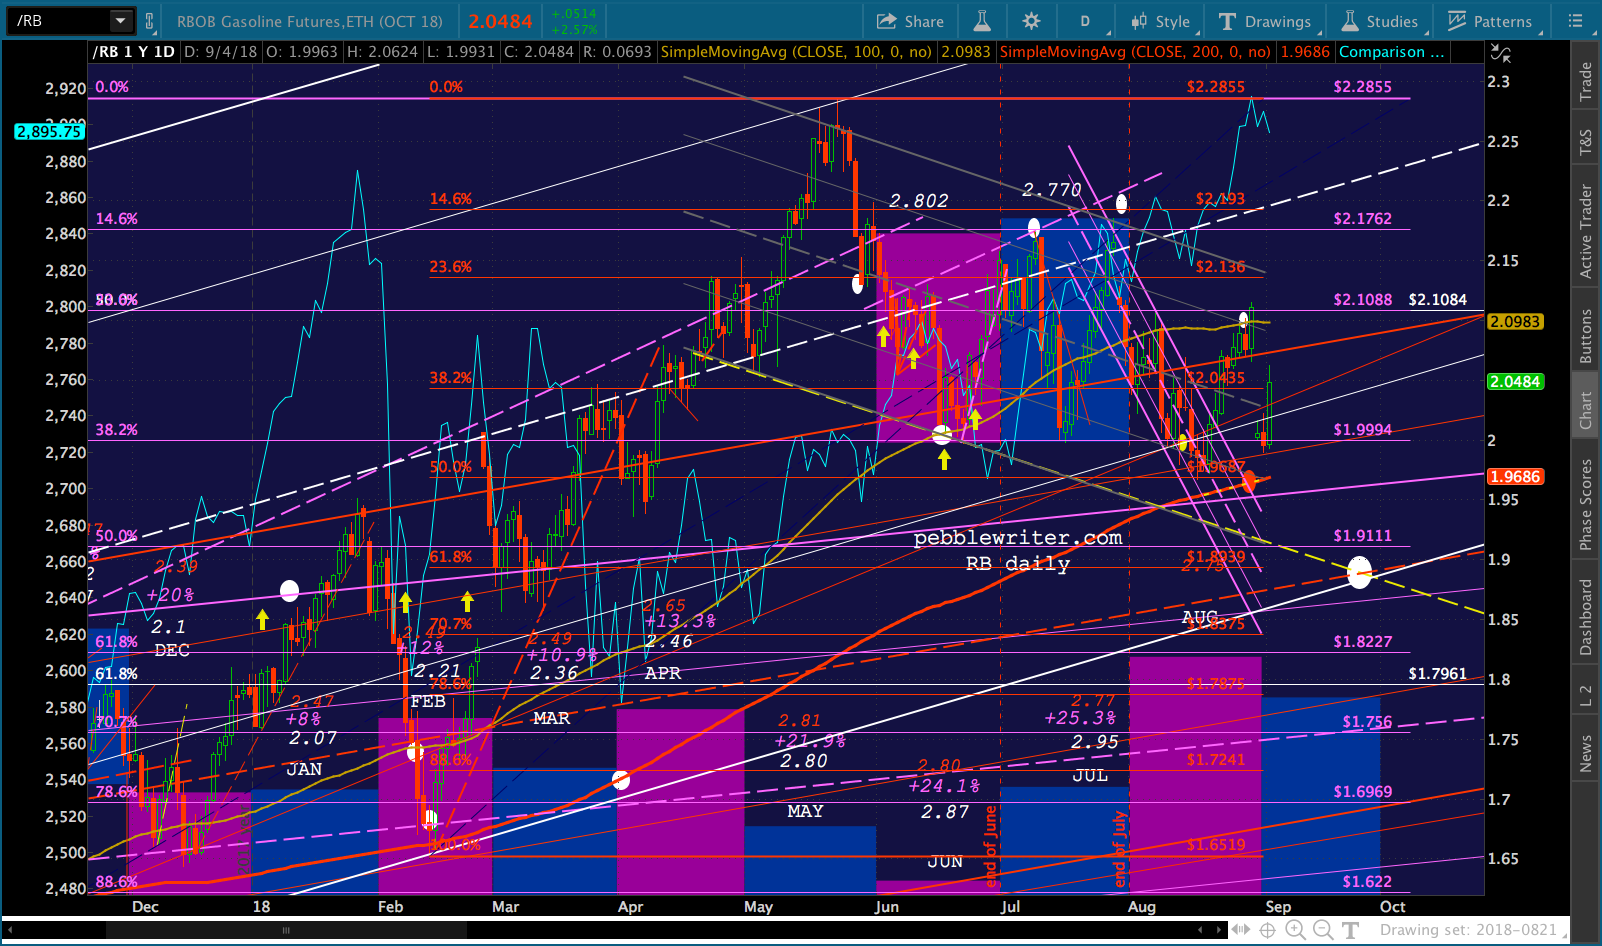 A clear path to both targets…
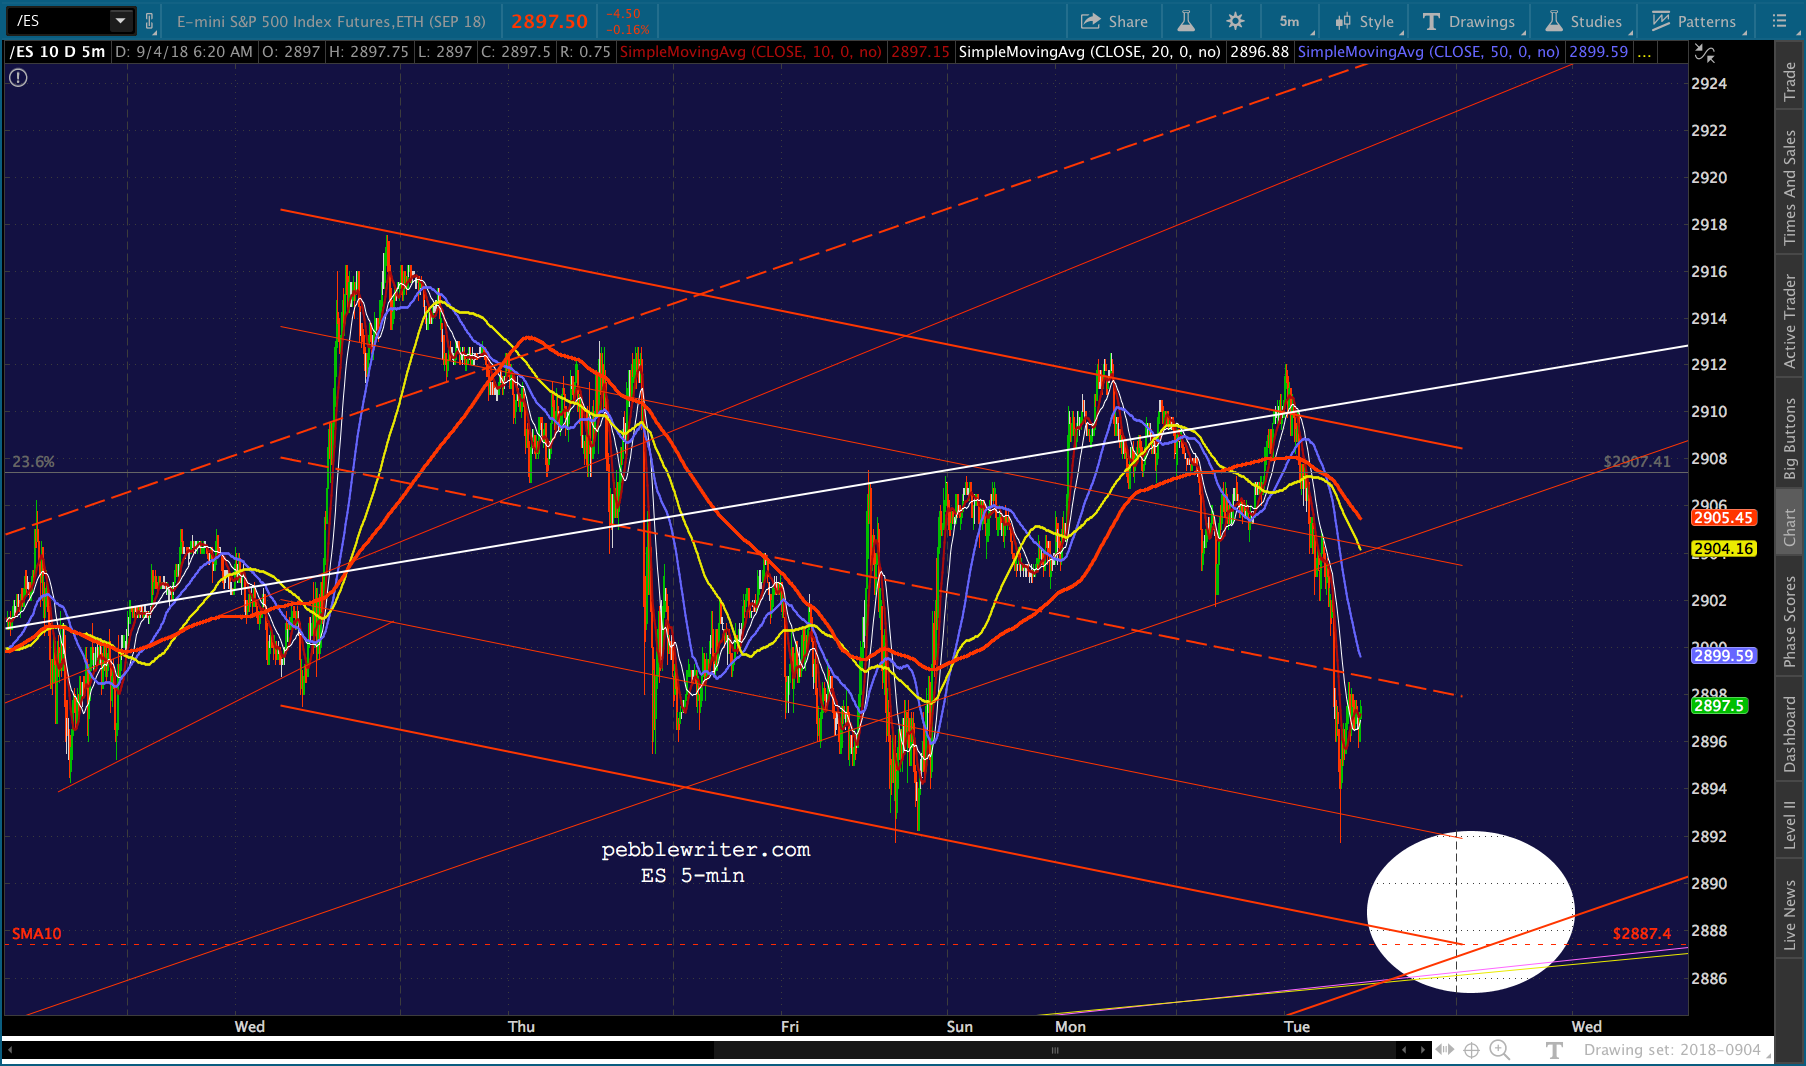
 UPDATE: 9:44 AM
ES tagged its SMA10, but SPX has a little ways to go and VIX hasn’t reached its SMA200. SPX 2882.45 should be about ES 2883. In other words, still waiting…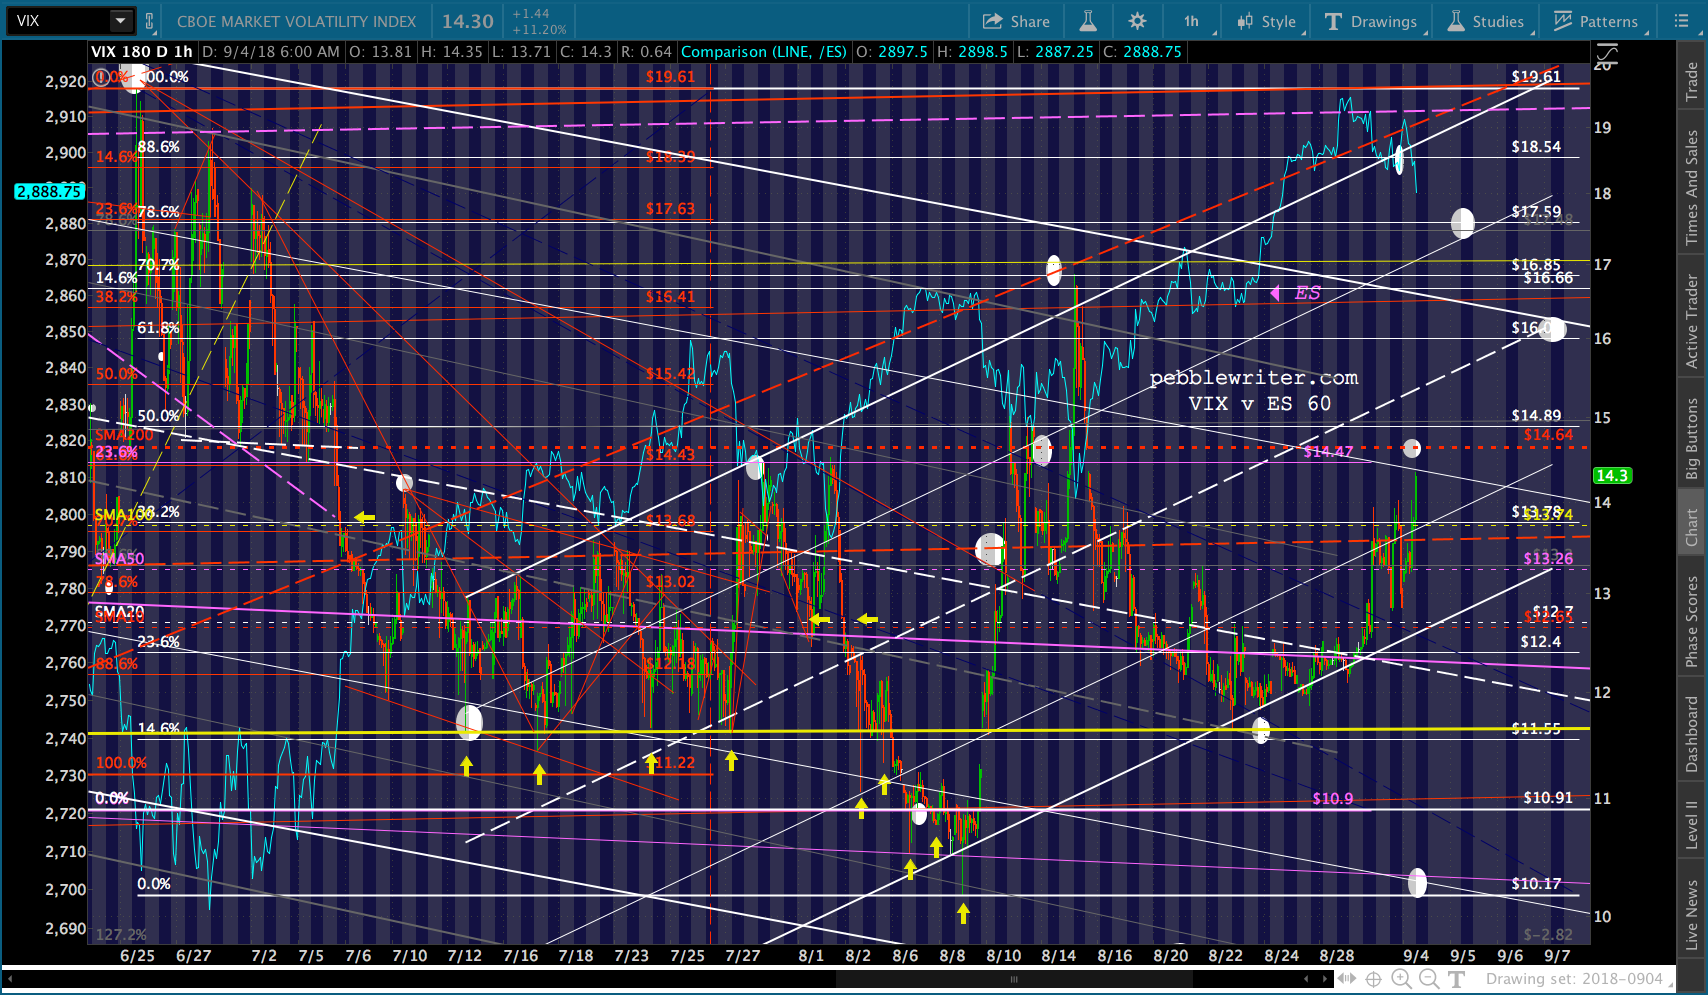
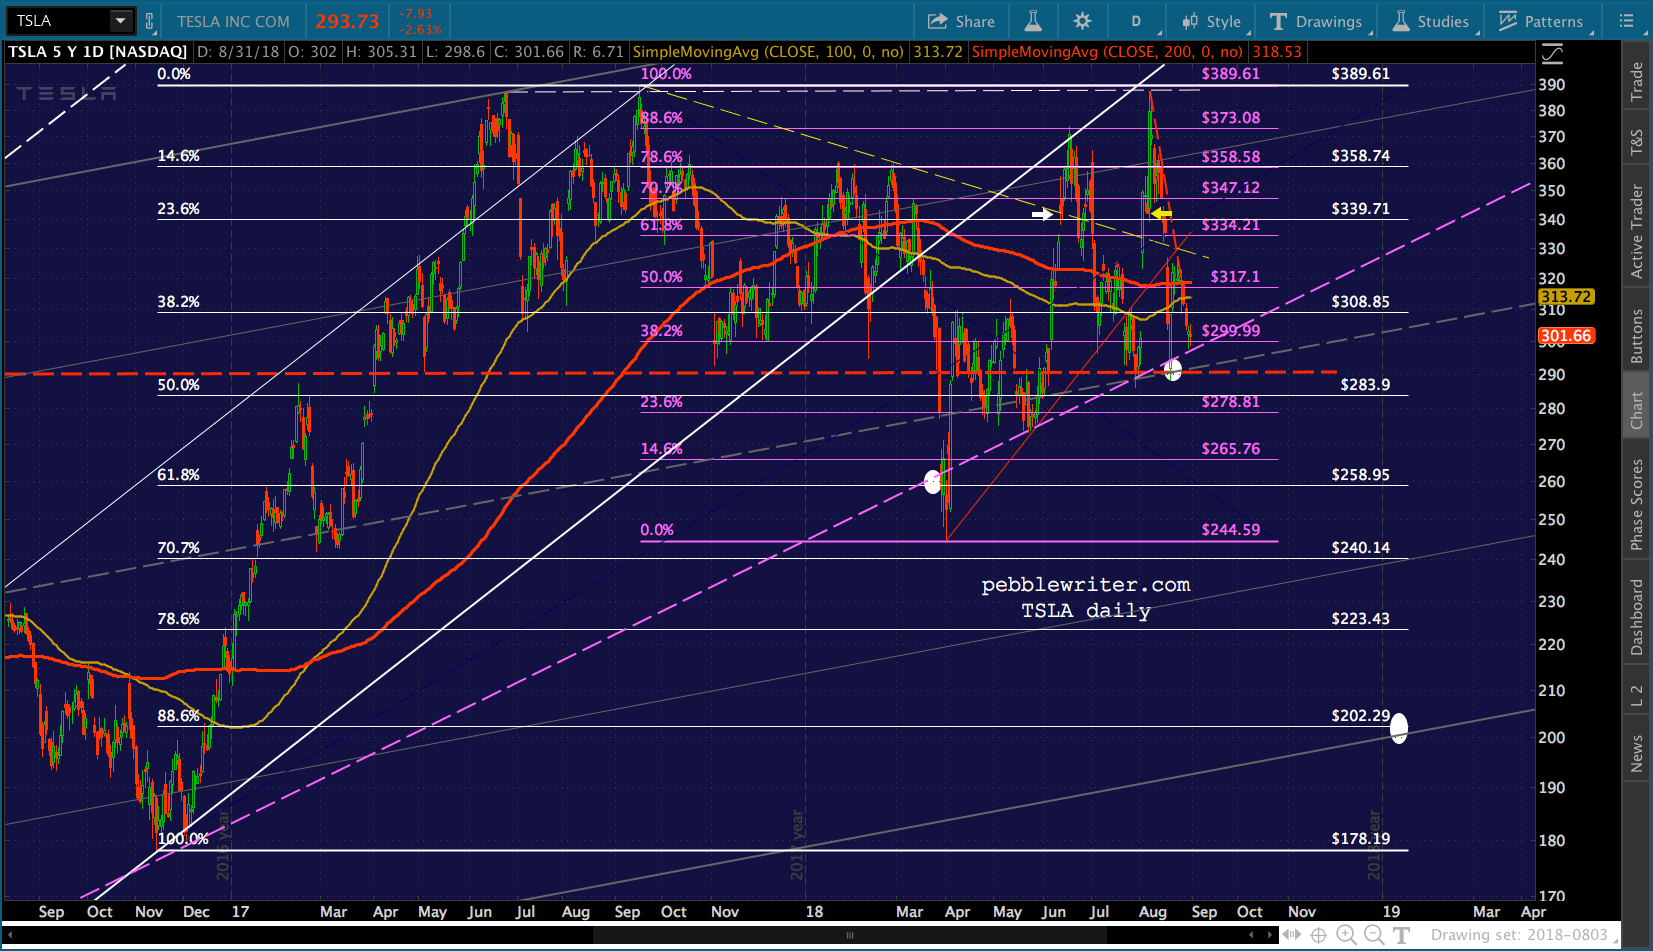
For those watching TSLA, it has come close to triggering a short signal — but, not quite there (despite Goldman reinstating coverage with a sell recommendation.) For more, see last week’s update How Not to Manipulate Stock Prices.
 Remember…one little trick we often see on days when it’s difficult to convince the machines to sell/short down to an obvious bounce point such as the SMA10 is to drive the price merely to where the SMA10 will be tomorrow. The SMA10 will likely increase by another 5 points tomorrow, so getting within 2-3 points is potentially “good enough.”