Does it seem like the market always ramps into the monthly CPI data dump? It’s not your imagination. The only exceptions in recent memory were in Sep and Oct, when CPI dipped below trend and then recovered, and in January, when investors’ worries over the Fed’s reaction to the Dec 2021 data caused a mild decline in advance of the release. Even then, SPX managed to rally for several days prior to the Jan 12 release.
 We’ve been worried about inflation since Dec 2020 [see: Don’t Ignore Inflation] when it became apparent that the rapid rebound in oil/gas prices would be problematic. Members are quite familiar with the following chart illustrating the very strong historical correlation.
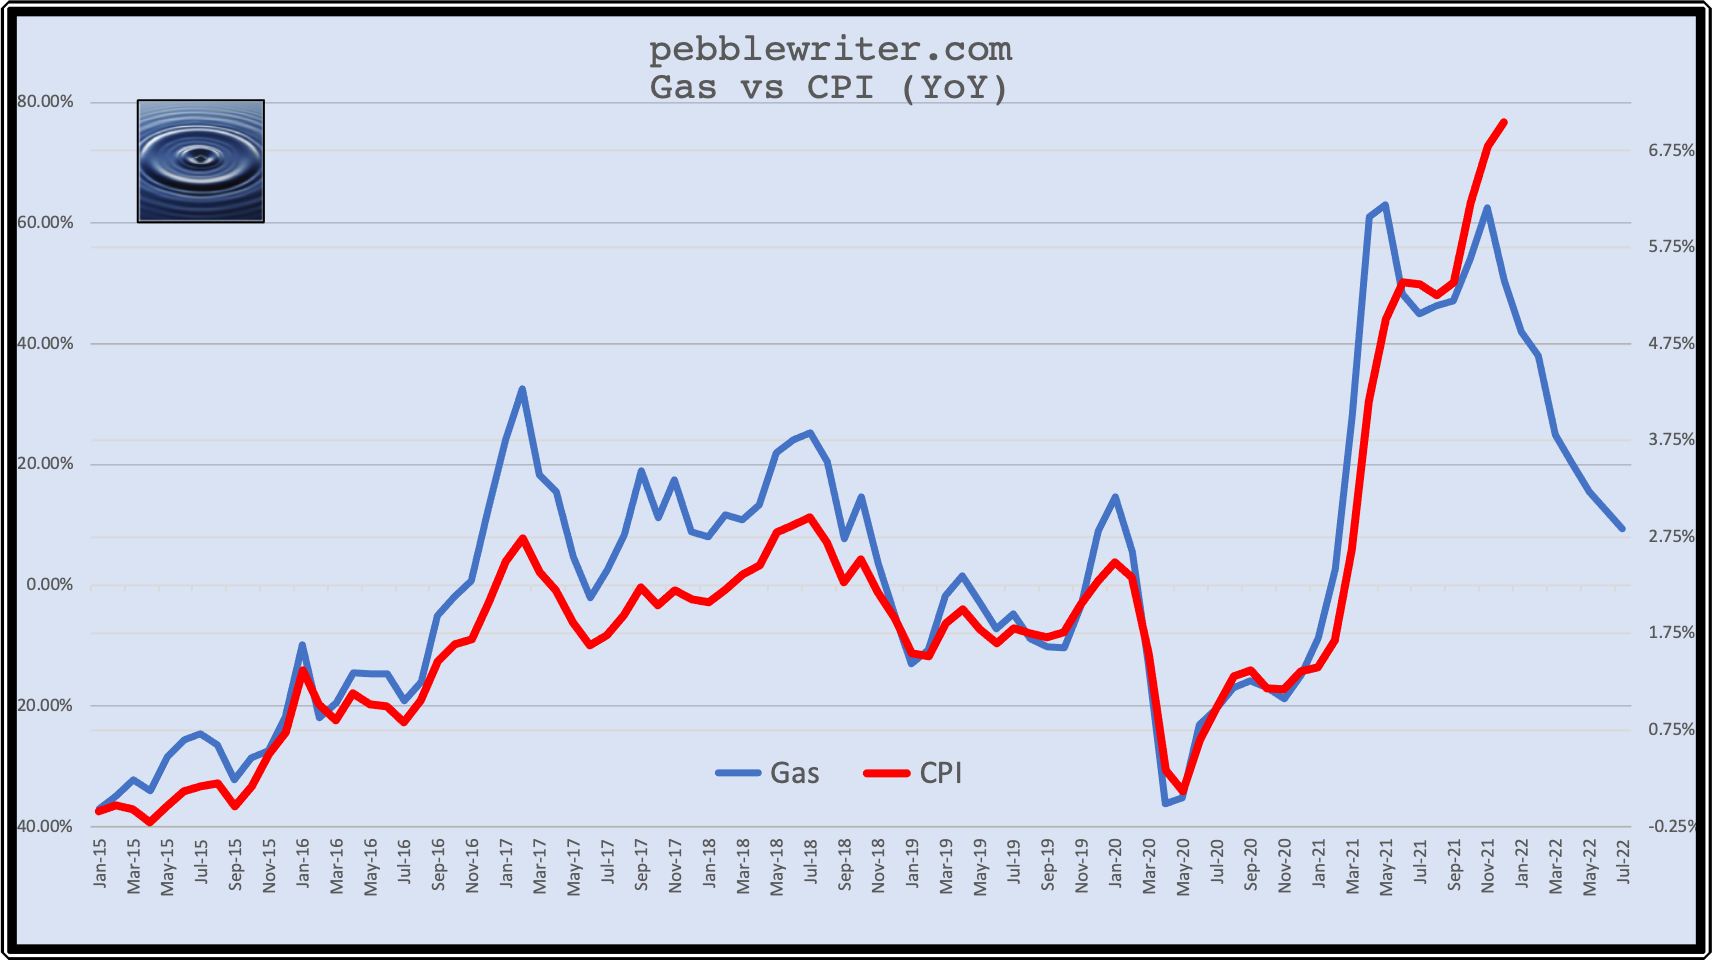
 As we pointed out in Dec 2020 [see: Inflation Highest in Nearly 40 Years] the correlation changed as inflation in non-energy categories spiked higher. Many of the stickier categories such as food and rent are beyond the Fed’s control unless impacted by an economic slowdown or the passage of time.
Since CPI is a calculation of YoY price changes, a leveling off of prices for any appreciable time will necessarily reduce their inflation input. The chart above shows the impact on the YoY change in gas prices if they were to freeze at current levels. The Fed relied on this principle whilst assuring us that high inflation would be transitory.
It obviously wasn’t as transitory as they wanted investors to believe, causing interest rates to spike higher at the same time that the Fed was being forced to pull back from supporting the bond market (AKA suppressing interest rates and forcing stocks higher.) Remember when the “reflation trade” was a good thing?
Now the Fed says they’ll raise rates, maybe even a lot. But, it’s hard to imagine them continuing to do so if equities respond as expected. It’s easier to imagine them winding down QE (yes, it’s still happening), perhaps throwing the monetary hawks and Fed critics a rate hike bone or two before giving up on the whole exercise once another equity selloff arrives.
Corrections tend to drive interest rates lower – the Fed’s primary goal. And, if driven by a decline in the YoY delta caused by stalled or falling oil and gas prices, CPI might actually be suppressed rather than exacerbated. Of course, unless we get an actual recession, consumers will likely be stuck with the higher prices we’ve got. But, at least the CPI headlines would be less alarming.
Our equity, bond, FX and commodities targets remain unchanged.


 Nevertheless, the futures heard and obeyed and continue to eye the VIX breakdown threat which works more often than not.
 continued for members… (more…)