

Though CPI came in hot yesterday (0.2% versus 0.1% consensus) it scarcely merited a mention in the financial press. In my opinion, this is a mistake. Inflation drives interest rates which, given that debt has topped $27 trillion and 136% of GDP, remains an extremely important consideration.
Though the official data is fundamentally flawed, inflation is the bedrock of my economic analysis. From it, we can forecast not only interest rates, but oil, gas, currencies and equities. The current analysis begins with the basic assumption that the Fed, for all its heroics in “saving” the economy from the pandemic this year, has backed itself into a corner.
The lion’s share of equities’ rally has been multiple expansion prompted by both a dramatic decrease in interest rates and by plugging a $3 trillion hole with $5 trillion of stimulus. The 10Y, hovering just under 1%, was nearly 2% a year ago and over 3% two years ago.
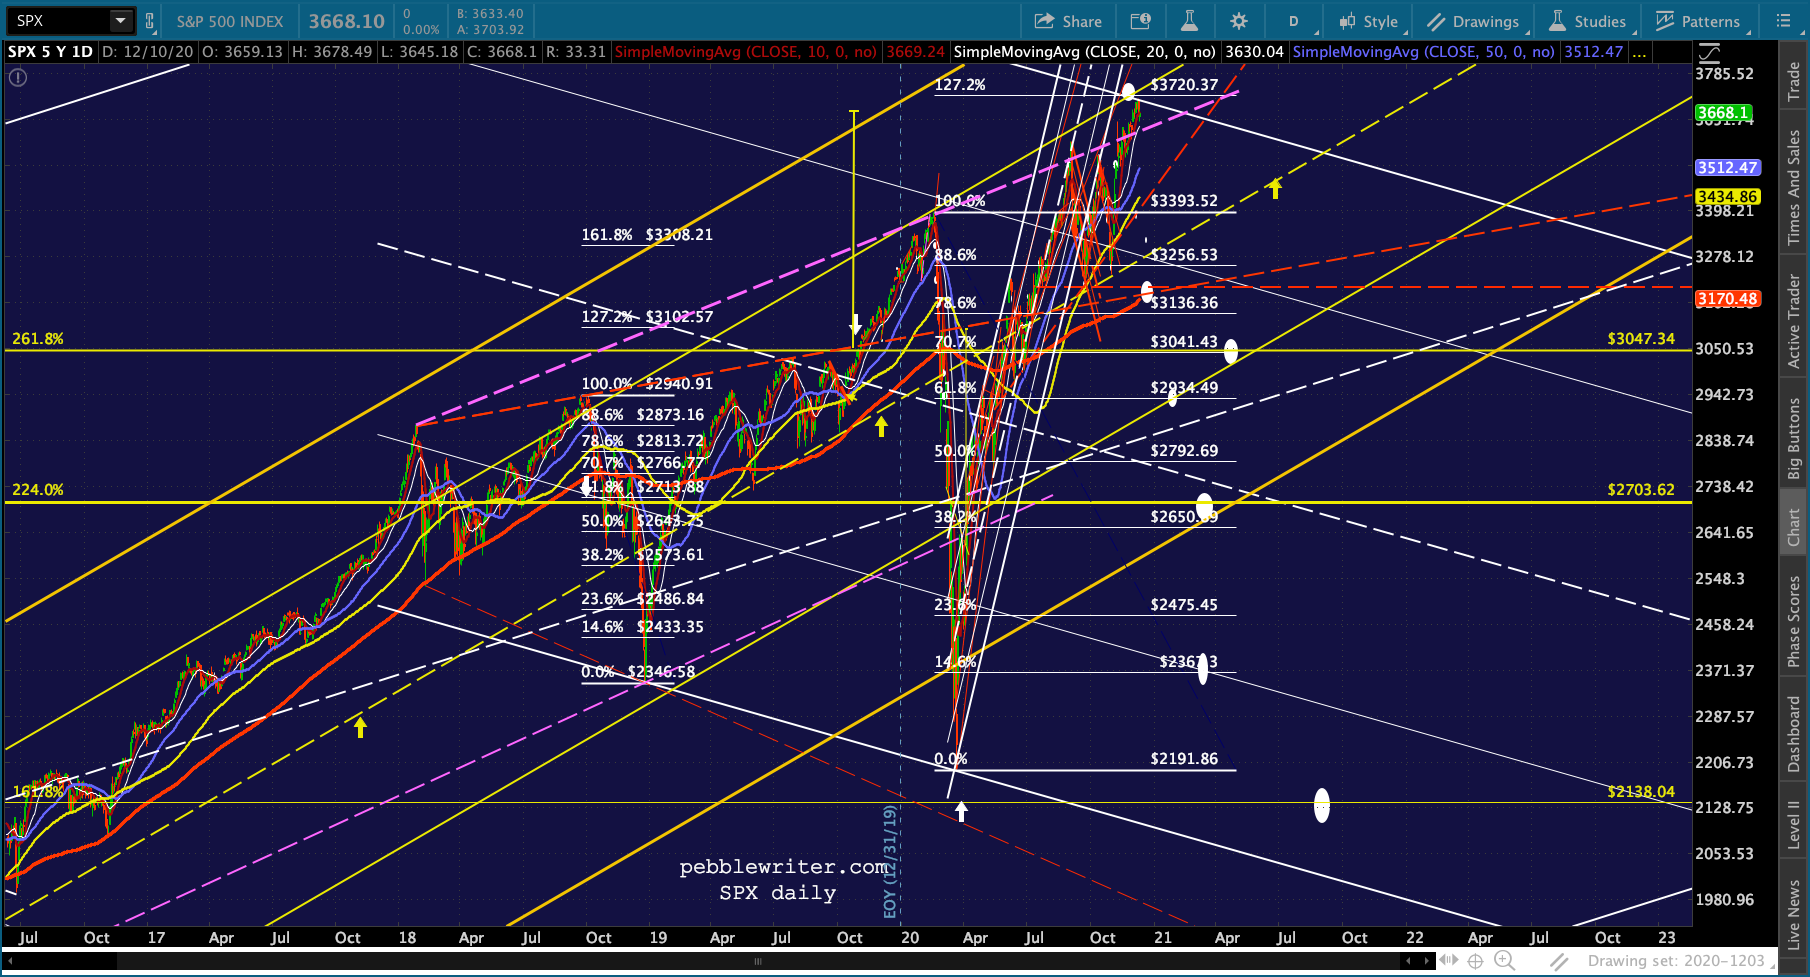
Two years ago, SPX dropped as low as 2346 on December 24. It recently tagged 3720, a 58% increase despite a deep recession and an incredible pandemic. The benefit of the decline in the 10Y is obvious to a point – February 2020. Once equities crashed, yields plummeted as bonds were panic bid.
Since equities’ bottom in March, low yields have helped justify the continuing multiple expansion. The gradual rise drives the narrative that the economy is expanding again and that reflation is bullish.
 A similar pattern can be seen with the 2Y, which fell from nearly 3% in November 2018 to 11 bps earlier this year.
 When it comes to understanding and forecasting inflation, few inputs are as important to the monthly swings as the changes in the price of oil and gas. The monthly data rarely diverge.
 Nor do the annual data – though it’s impossible to ignore the divergence of the past few months. In a vacuum, this might be a non-event. But, $27 trillion in debt in a market dependent on historically low interest rates is hardly a vacuum.
 What the markets don’t seem to appreciate is the implication of the coming spike in YoY price changes in oil and gas. In my estimation, the 3-4% CPI it implies (so far) represents a very significant risk to markets and is the chief reason behind the Fed’s duplicitous changes in posture towards inflation.
continued for members…
We’ll take a quick look at markets before resuming this discussion.
Futures’ falling wedge broke down, sending ES below its SMA10 overnight. It has since rebounded as VIX has been hammered. Several backtests await, beginning with the red TL representing the top of the falling wedge.

 VIX has topped its SMA20 and probably has immediate potential to its SMA50…
 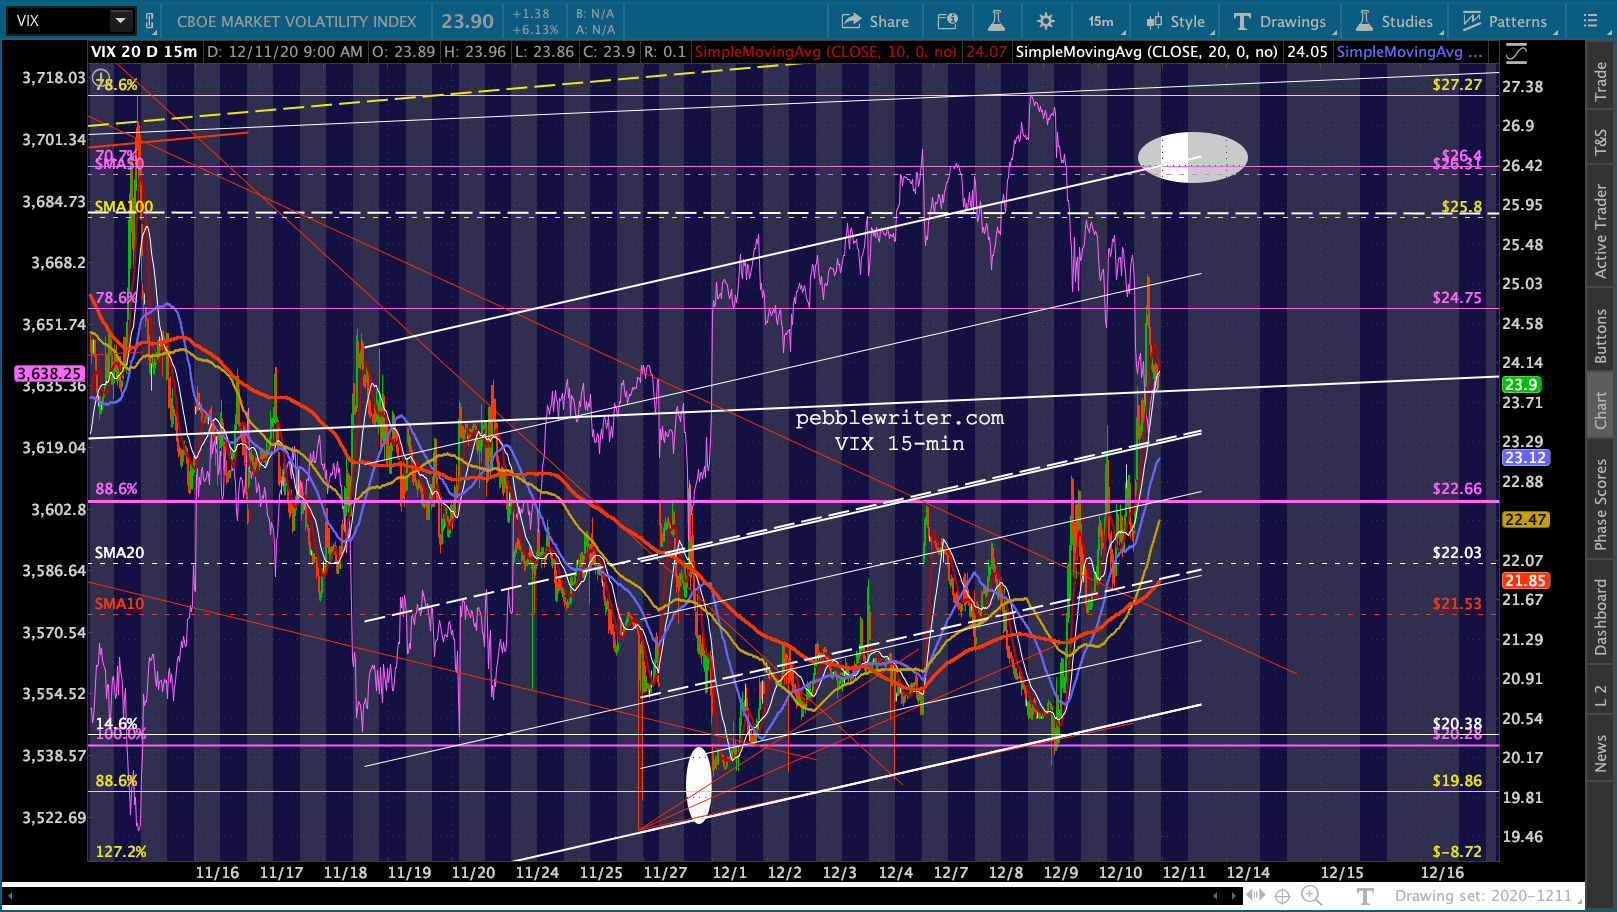 …though a backtest of the yellow TL is also interesting.
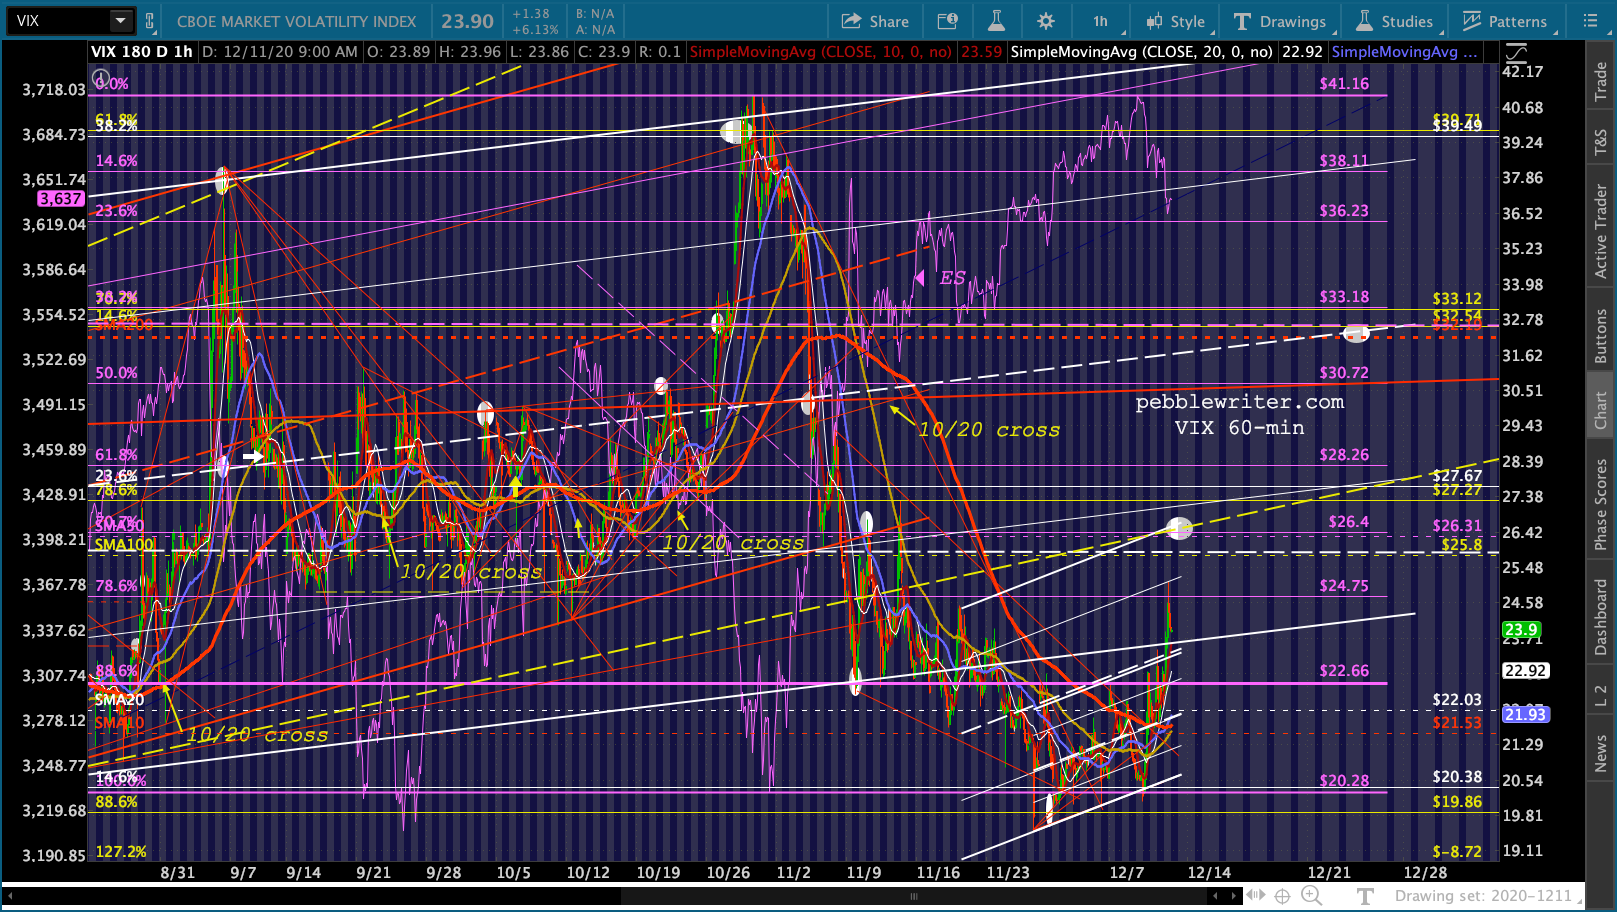
 The 10Y is slipping lower, with another test of the white channel bottom in the cards.
  USDJPY has broken down further, establishing a new, lower TL to which it might cling until it’s ready for new lows.
 And, oil and gas remain elevated. More on this later.

 I have a conference call coming up and will resume the post on inflation after 12-12:30…
Sorry folks, but I got caught up on another call and still have one more before I free up and then am booked with family stuff all afternoon.
Punch line? Oil and gas will have to fall significantly by April or we’re looking at a potential 20%+ YoY increase in gas prices – which has historically produced 2.4-2.7% annual inflation and a 2%+ 10Y.
This means that the Fed/Tsy has to decide between falling oil prices (which would ding stocks) or interest rates breaking out (which would also ding stocks.)
I’ll be able to chart this tomorrow. Stay tuned.