Month: December 2020

  • Congress to Americans: Good Luck

    Will Congress come up with an aid package? Unless they act now, millions of our neighbors are set to lose their unemployment benefits in the next two weeks. After the new year, they’ll also lose their eviction/foreclosure protection. “Merry Christmas” from our public servants. More like “good luck.”

    Meanwhile, the market continues its meltup in anticipation of stellar retail sales and a vaccine rollout which will result in only another 100-150,000 deaths.

    And the FOMC is wringing its hands, trying to figure out why historically low interest rates aren’t helping those who can’t borrow.

    continued for members(more…)

  • Collateral Damage

    Maybe Warren Buffett can get through to Congress. In a CNBC interview aired this morning:

    “It’s so important that small businesses, which have become collateral damage in a war that our country needed to fight, but we, in effect, voluntarily had an induced shut down of parts of the economy, and it hit many types of small businesses very, very hard… We made some provision for that in March in terms of the CARES Act, but then nobody really knew how long this self-inflicted recession would last with this particular effect on small businesses, so we need another injection to complete the job.”

    Congress, the Treasury and the Fed have done a terrific job of “saving” corporations that already had access to plenty of cheap capital and whose stock prices could then vouch for the strong recovery from the pandemic.  The rest of the economy?  Not so much.

    For all the independent restaurants, mom and pop stores, non-big box retailers, things are dismal. And, to all the unemployed folks barely hanging on to their house or their apartment, it will get much worse if Congress doesn’t act in the next few days to prevent them from being evicted during the depths of winter in the midst of a pandemic.

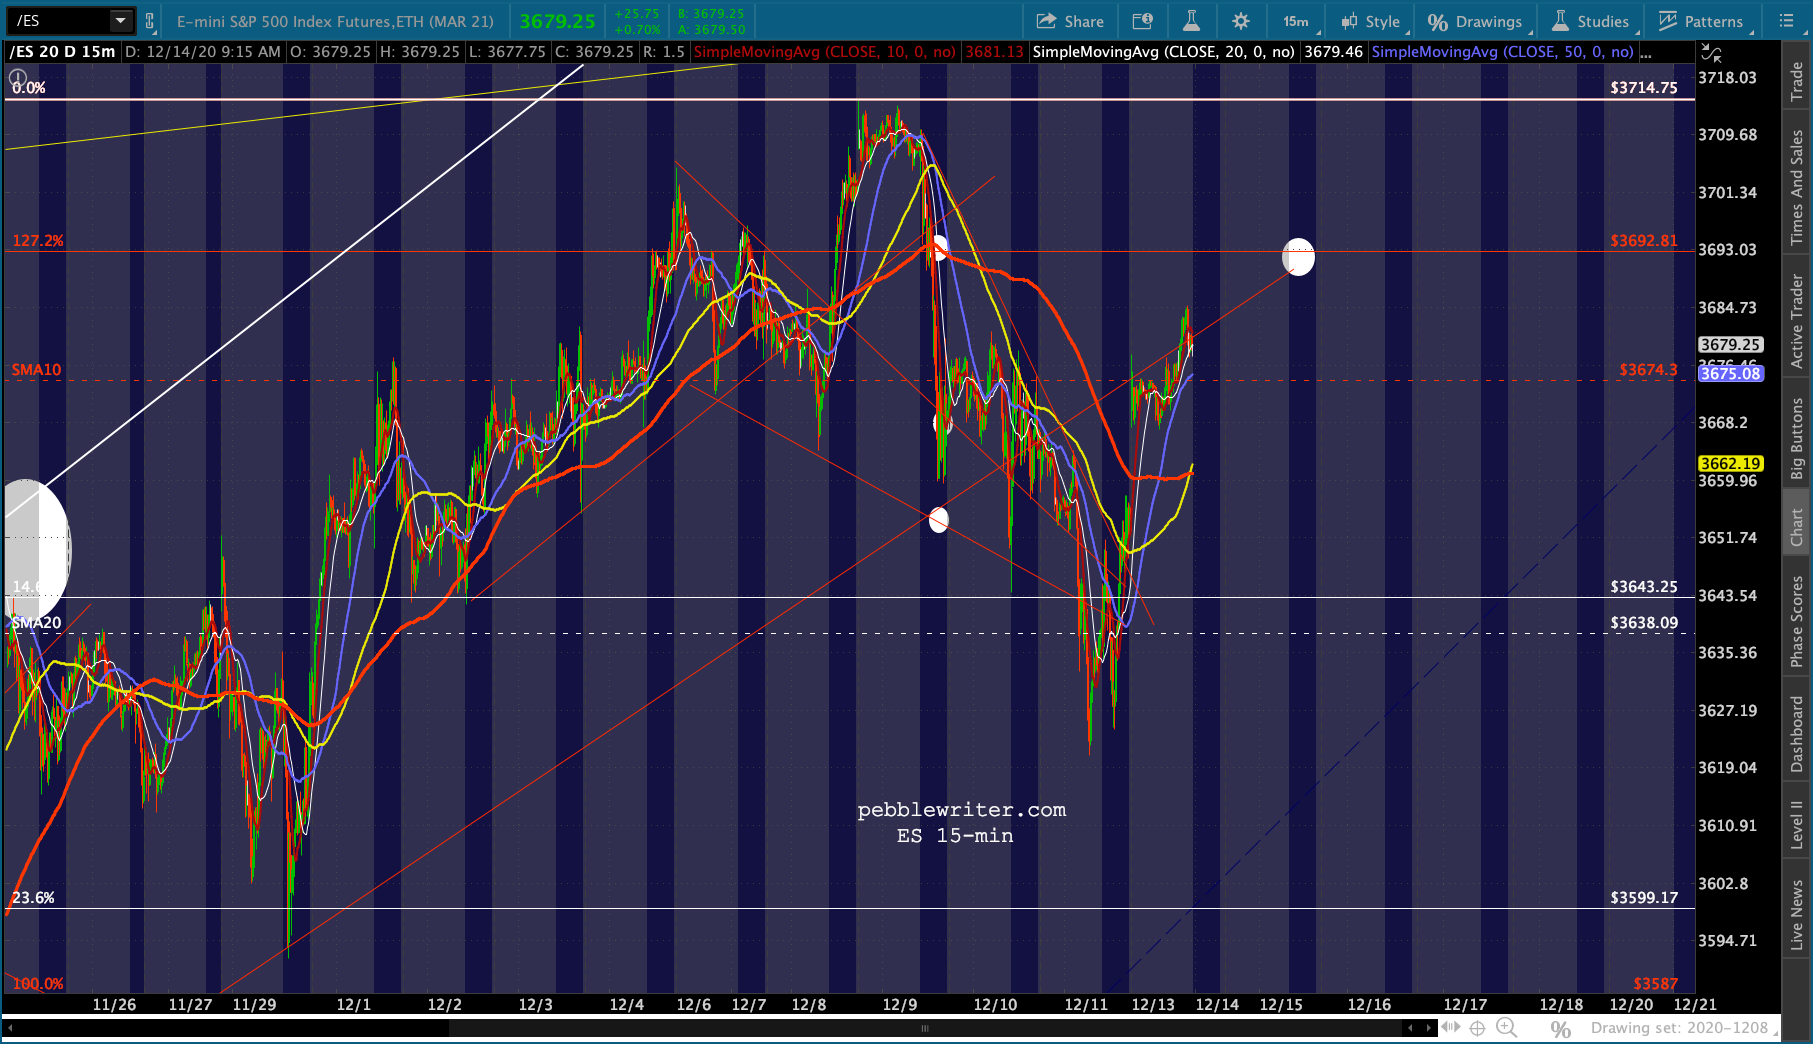
    Naturally, futures are up 25 points.According to VIX, it probably won’t last.

    continued for members(more…)

  • Charts I’m Watching: Dec 14, 2020

    Even without a new vaccine approval this morning, futures have managed to gap back above their 10-DMA.

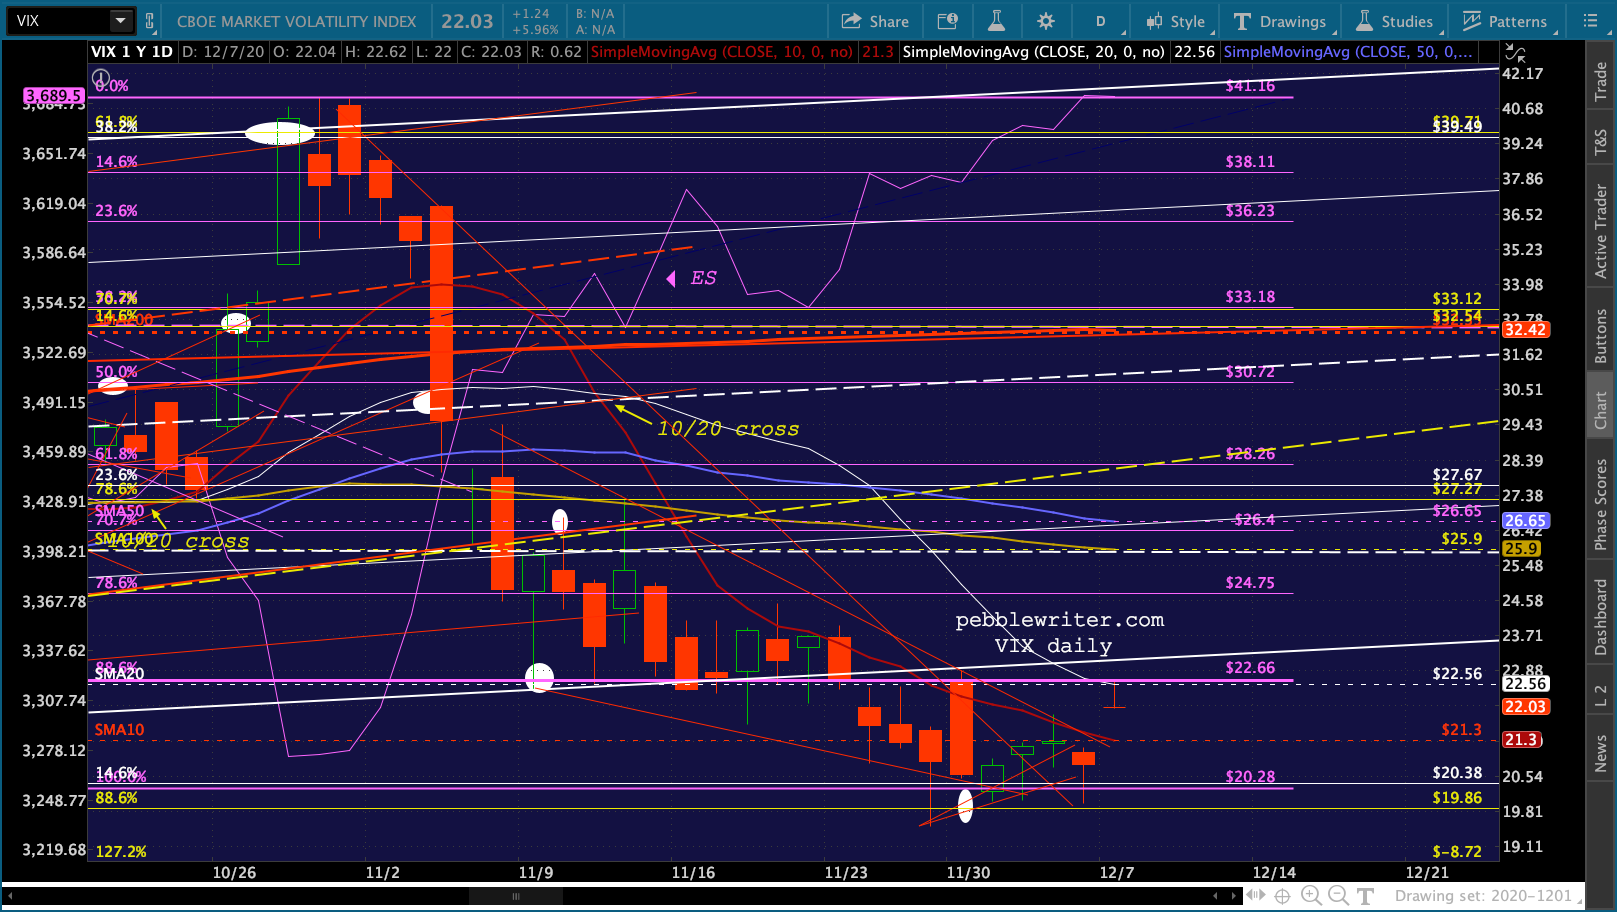
    It’s not an unusual occurrence for OPEX week. But, note that VIX also gave up 12.6% of its recent gains overnight to test important support at its 20-DMA.

    continued for members(more…)

  • Don’t Ignore Inflation

    Though CPI came in hot yesterday (0.2% versus 0.1% consensus) it scarcely merited a mention in the financial press. In my opinion, this is a mistake. Inflation drives interest rates which, given that debt has topped $27 trillion and 136% of GDP, remains an extremely important consideration.

    Though the official data is fundamentally flawed, inflation is the bedrock of my economic analysis. From it, we can forecast not only interest rates, but oil, gas, currencies and equities.  The current analysis begins with the basic assumption that the Fed, for all its heroics in “saving” the economy from the pandemic this year, has backed itself into a corner.

    The lion’s share of equities’ rally has been multiple expansion prompted by both a dramatic decrease in interest rates and by plugging a $3 trillion hole with $5 trillion of stimulus.  The 10Y, hovering just under 1%, was nearly 2% a year ago and over 3% two years ago.

    Two years ago, SPX dropped as low as 2346 on December 24. It recently tagged 3720, a 58% increase despite a deep recession and an incredible pandemic.  The benefit of the decline in the 10Y is obvious to a point – February 2020. Once equities crashed, yields plummeted as bonds were panic bid.

    Since equities’ bottom in March, low yields have helped justify the continuing multiple expansion. The gradual rise drives the narrative that the economy is expanding again and that reflation is bullish.

    A similar pattern can be seen with the 2Y, which fell from nearly 3% in November 2018 to 11 bps earlier this year.When it comes to understanding and forecasting inflation, few inputs are as important to the monthly swings as the changes in the price of oil and gas. The monthly data rarely diverge.

    Nor do the annual data – though it’s impossible to ignore the divergence of the past few months. In a vacuum, this might be a non-event. But, $27 trillion in debt in a market dependent on historically low interest rates is hardly a vacuum.What the markets don’t seem to appreciate is the implication of the coming spike in YoY price changes in oil and gas. In my estimation, the 3-4% CPI it implies (so far) represents a very significant risk to markets and is the chief reason behind the Fed’s duplicitous changes in posture towards inflation.

    continued for members…
    (more…)

  • Something Bigger?

    And, everything was going so well…

    The algos managed to bounce just before tagging the line in the sand yesterday. So far, so good. But the overnight crew wasn’t so lucky, as ES finally dropped below a trend line dating back to Nov 6. Is this the “something bigger” we’ve been waiting for, or were the machines just caught off guard?

    continued for members(more…)

  • It’s Too Crowded

    One of my favourite Yogi Berra quotes was in response to a question about a restaurant: “Nobody goes there anymore; it’s too crowded.”

    Everyone seems to agree that the market is overbought, sentiment is insanely positive, leverage is excessive and that the flow of funds has been unbridled – in short, that the long trade is too crowded. If so, who’s still buying?

    Stocks have ignored most every opportunity to correct – whether technically or fundamentally driven.  It’s the kind of behaviour we often see around OPEX and year end when the algo tractor beams typically take hold.Do the algos have markets firmly under control, or might investors come to their senses?

    continued for members(more…)

  • The Yield Curve Model: Dec 8, 2020

    One of my favorite market indicators is our yield curve model. It has warned us several times in advance of significant correctionsthis year.

    Warnings over the past few years have included:

    July 16, 2018: The Yield Curve Update – We were a little early. SPX closed at 2798 that day, rose to 2940 before crashing 20% by Dec 26.  The final 13% was signaled on Dec 5: The Yield Curve’s Warning.]

    April 25, 2019: The Yield Curve Model Warns Again – SPX gained 21 points over the next four sessions before quickly shedding 226 points.

    February 20, 2020: Buckle Up – SPX (which had topped out the day before) crashed by over 35% over the next month.

    August 25, 2020: Update on AAPL – We were about a week early, but the model signaled a correction which saw SPX fall 11%, followed by another 9% the next month.

    The recent breakout of the 2s10s is clearly a bearish signal – though it hasn’t yet paid off.  Is the model still working?  First, a little history. Among other things, the model holds that breakouts above significant resistance are bearish for equities.

    If we plot the 2Y and 10Y together, we can see that significant sell-offs in stocks were marked by more rapid declines in 2Y yields than in 10Y yields (i.e., a widening of the spread between the two.)

    The shaded areas below illustrate the period during which stocks experienced their most significant corrections between 2000-2013. Though the 2Y and 10Y both declined during these periods, the 2Y yields clearly fell faster.

    But, as we saw in 2015-2016 and again in late 2019, not all corrections involved a steepening. These selloffs occurred without the yield curve model signal being triggered. Did the model stop working?  Hardly. The decline earlier this year was a stark reminder of its predictive power.  What made these corrections different?  More importantly, what is the model signaling now, and how likely is it to play out?

    continued for members(more…)

  • Different This Time?

    VIX did something this morning it hasn’t done since mid-October: gap above its 10-DMA.  The last time it did this, SPX promptly dropped 250 points.Of course, every time VIX acts up, it’s promptly slapped back down. But, this time it happened at the 20-DMA. Could this latest move be different?

    continued for members(more…)

  • Stocks Decimated by Unemployment Woes

    In news that should surprise no one, job growth is slowing as the country enters the most dangerous phase of the pandemic.

    The news shook stocks, with S&P futures now off a stunning 2 points since prior to the announcement.

    Aghast that the index might not make another new all-time high today, investors across Wall Street had to be talked off of window ledges.  Observing the carnage, algos could be heard muttering, “VIX…VIX…VIX…”

    Hopefully stocks, after suffering through the greatest monthly gain since 1987 in November, will recover.

    continued for members(more…)

  • Update on Currencies: Part 2

    We will continue yesterday’s overview on currencies and how their recent price action affects bonds, gold, crypto and equities.

    First, note that DXY did in fact break below the midline. As we discussed yesterday, this is potentially very significant.

    continued for members(more…)