

And, everything was going so well…
The algos managed to bounce just before tagging the line in the sand yesterday. So far, so good. But the overnight crew wasn’t so lucky, as ES finally dropped below a trend line dating back to Nov 6.  Is this the “something bigger” we’ve been waiting for, or were the machines just caught off guard?
continued for members…
According to ES’ 60-min chart, it just might be. The test will come at the little falling red TL which could produce a backtest of the broken red TL and SMA10 at 3666.75. A full-fledged rescue effort would put it back above the SMA10 as though nothing ever happened.  If the top is in, ES’ daily chart needs some work – particularly the larger falling channels.
 But, SPX – having reached its IH&S target and nearly reached its 1.272, needs only a slight adjustment. Note that we’d had two potential falling channels (in red and white below) based on the failure of SPX to reach 2138 last March.
  If yesterday was the cycle high, which it appears to be, then we can switch to a single falling channel as shown below.
 Note that VIX has backtested the white channel it broke down below on Nov 23 and topped its SMA20. The bearish equity case requires that it remain above 23.
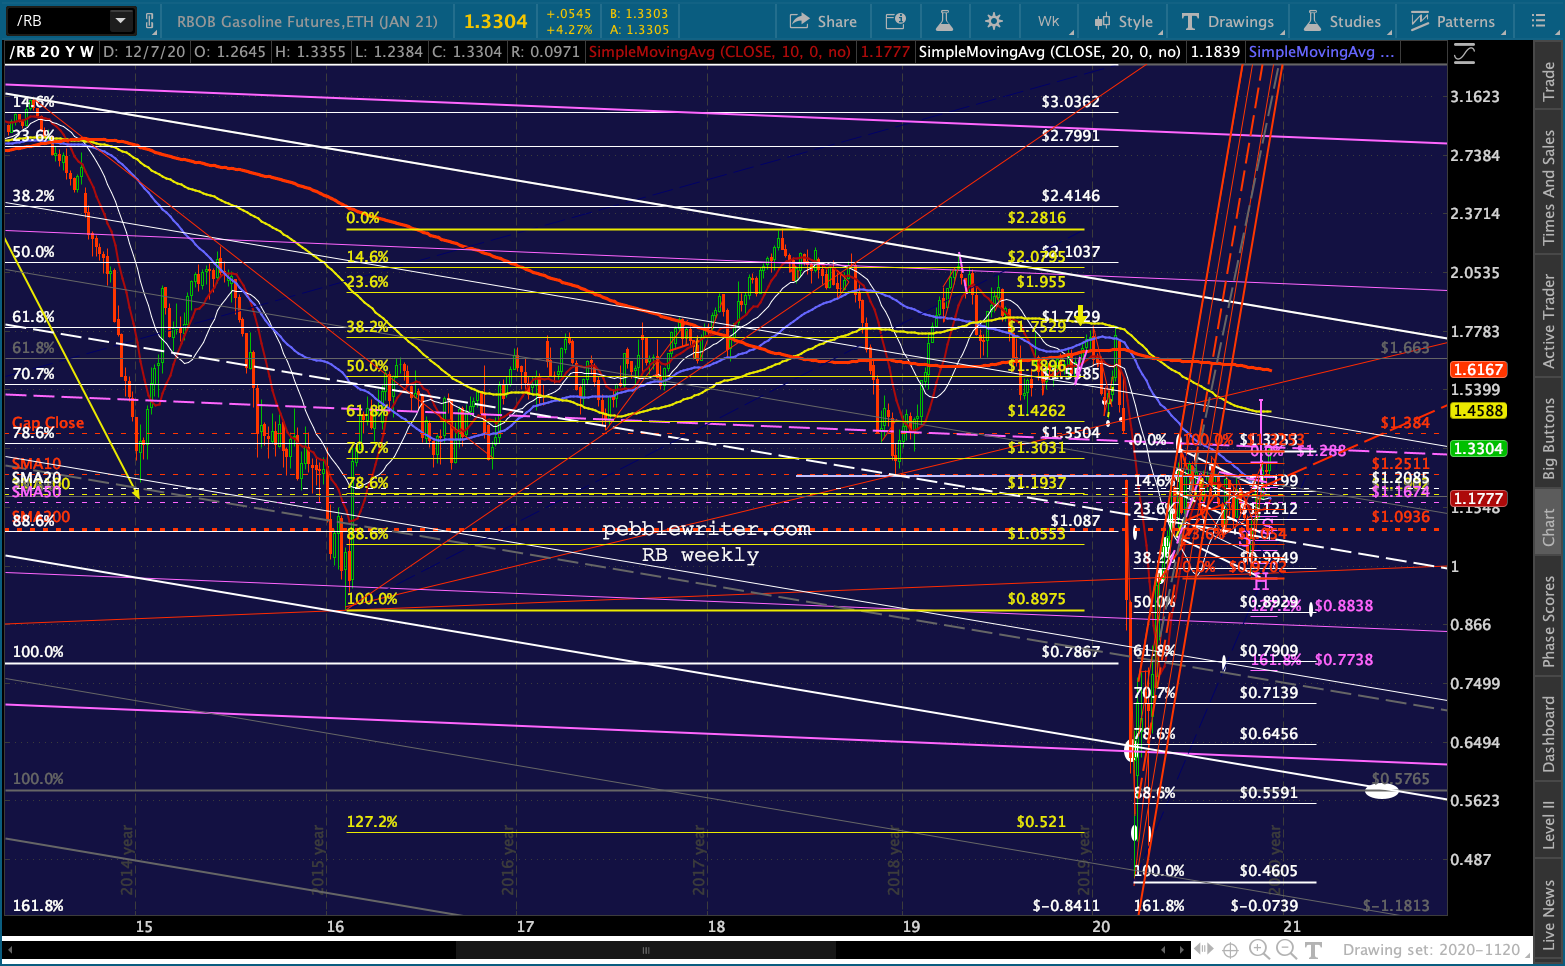
 Not surprisingly, CL and RB are swinging into action – pushing to higher highs. CL already accomplished this two weeks ago, but RB appears likely to top its Jun 23 highs and try for its gap close at 1.384 or even its IH&S target at 1.50.
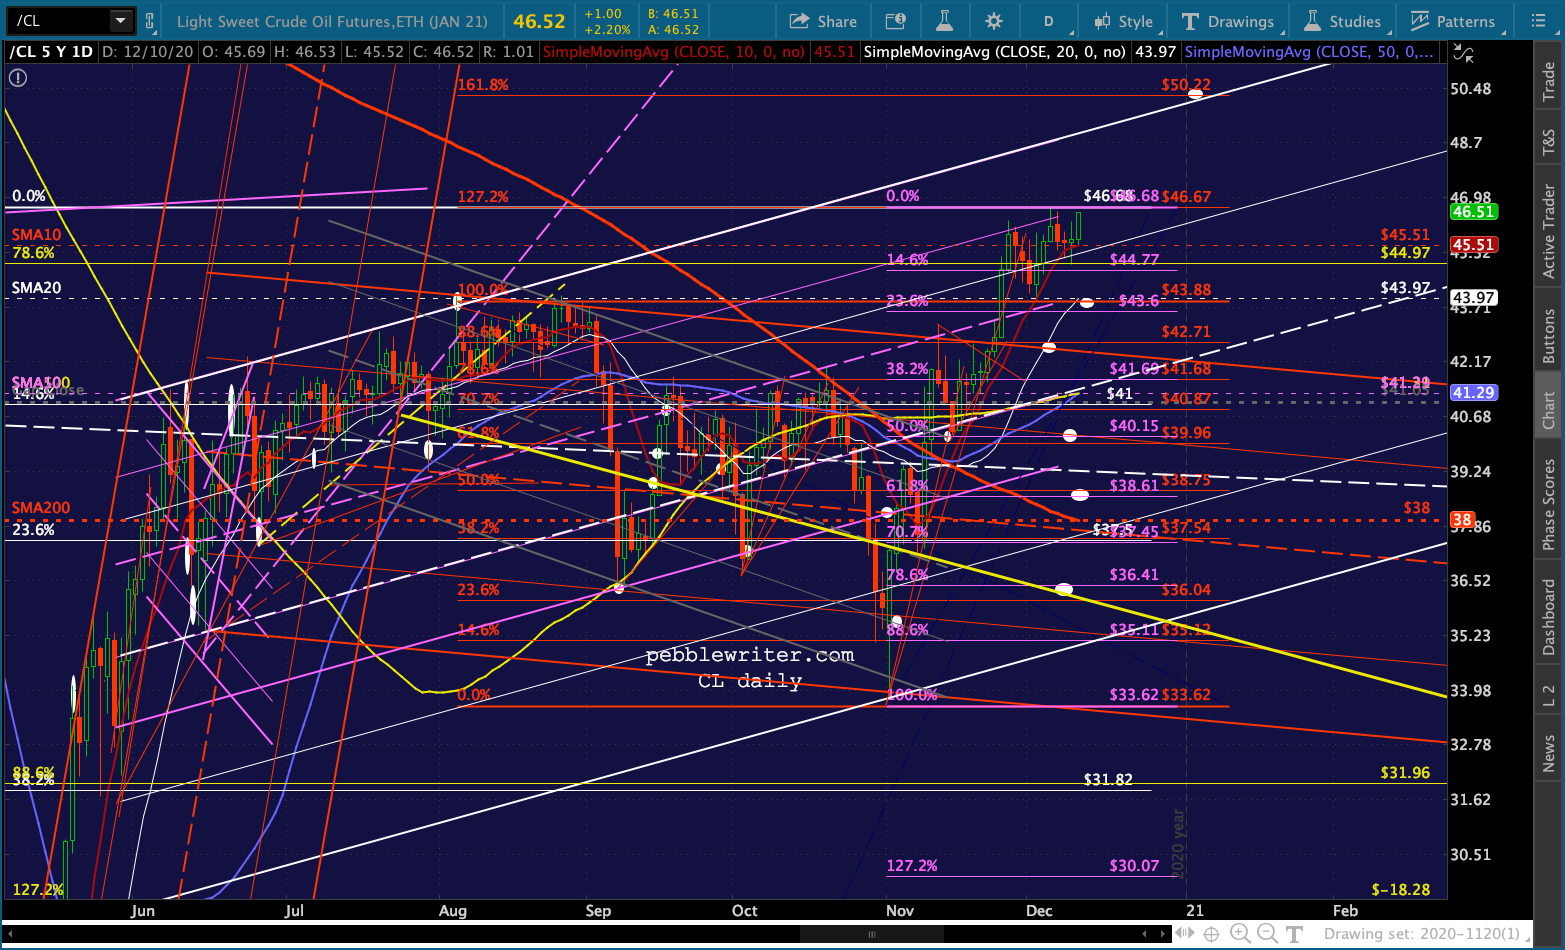
 But, as we’ve discussed before, this rally must come to an end in the not too distant future. CPI is driven by YoY changes, with the delta in gasoline being one of the more important variables. RB and CL reached some very low lows on Mar 23, and will need to temper their gains by Mar 2021 lest the YoY comps reach alarming levels.
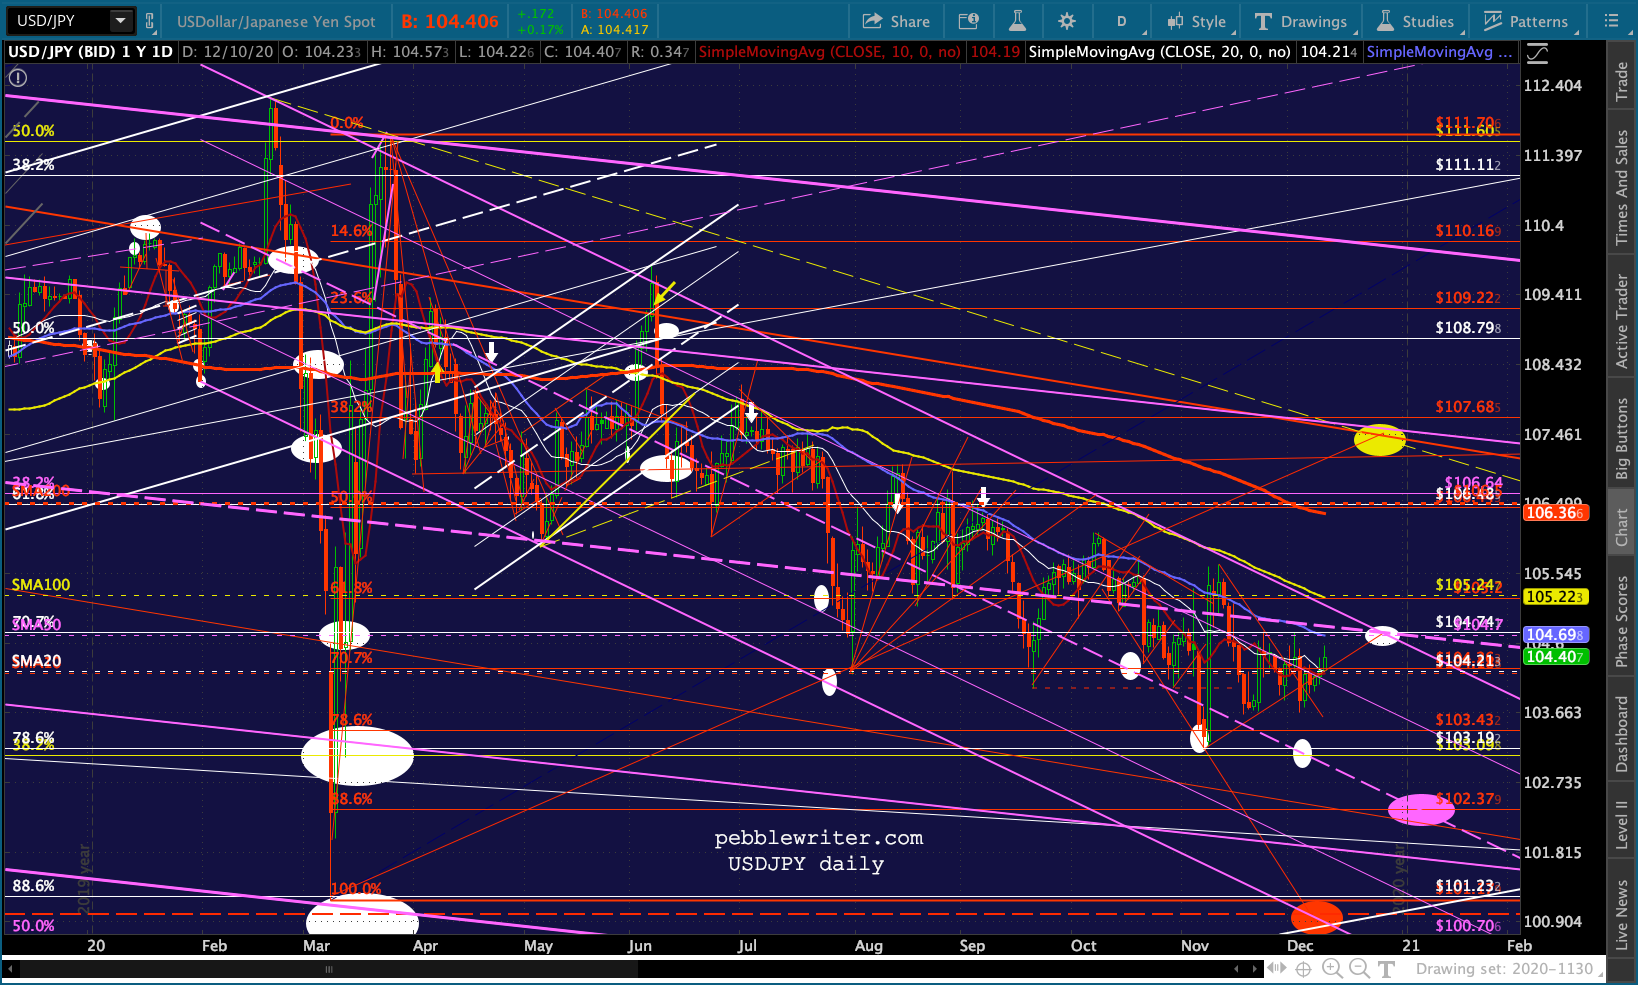
Note that USDJPY has bounced back above its SMA20. It will need to keep rising to save stocks’ rally. A failure to hold these levels would reinforce the downside case.
 I’m going to update my CPI charts, which I expect will offer some interesting insights. In the meantime, note that RB’s gap close at 1.384 will also backtest the purple channel midline shown in the weekly charts below.

more later...