Yes, pebblewriter.com is still being worked on. At least, that’s the last communication I got from Hostgator. Apparently, their level 2 techs are all working from home and are not permitted to speak on the phone with customers — meaning all communication is being done by email. It’s hardly ideal, but it’s what we have. With any luck, tomorrow’s post will be back on a properly working website.
* * *
Futures have been all over the map overnight, ramping from 2445 on yesterday’s open to as high as 2567.50 a few hours ago.
Perhaps significantly, ES failed to retake the yellow neckline at 2568ish despite the usual smackdowns in VIX and 2s10s. The 2s10s dropped back through the white TL support which has been the last line of defense for bulls…
…and, VIX is threatening another breakdown – this time marked by the SMA5 200 and a TL from last week’s lows.
We might assume that our 80.30 target — reached two weeks early — continues to be the line in the sand for another leg down.
It makes sense since: (1) the economic picture continues to worsen; and, (2) neither SPX nor ES ever quite reached important Fib support – our 1.618 targets at ES 2155 and SPX 2138.
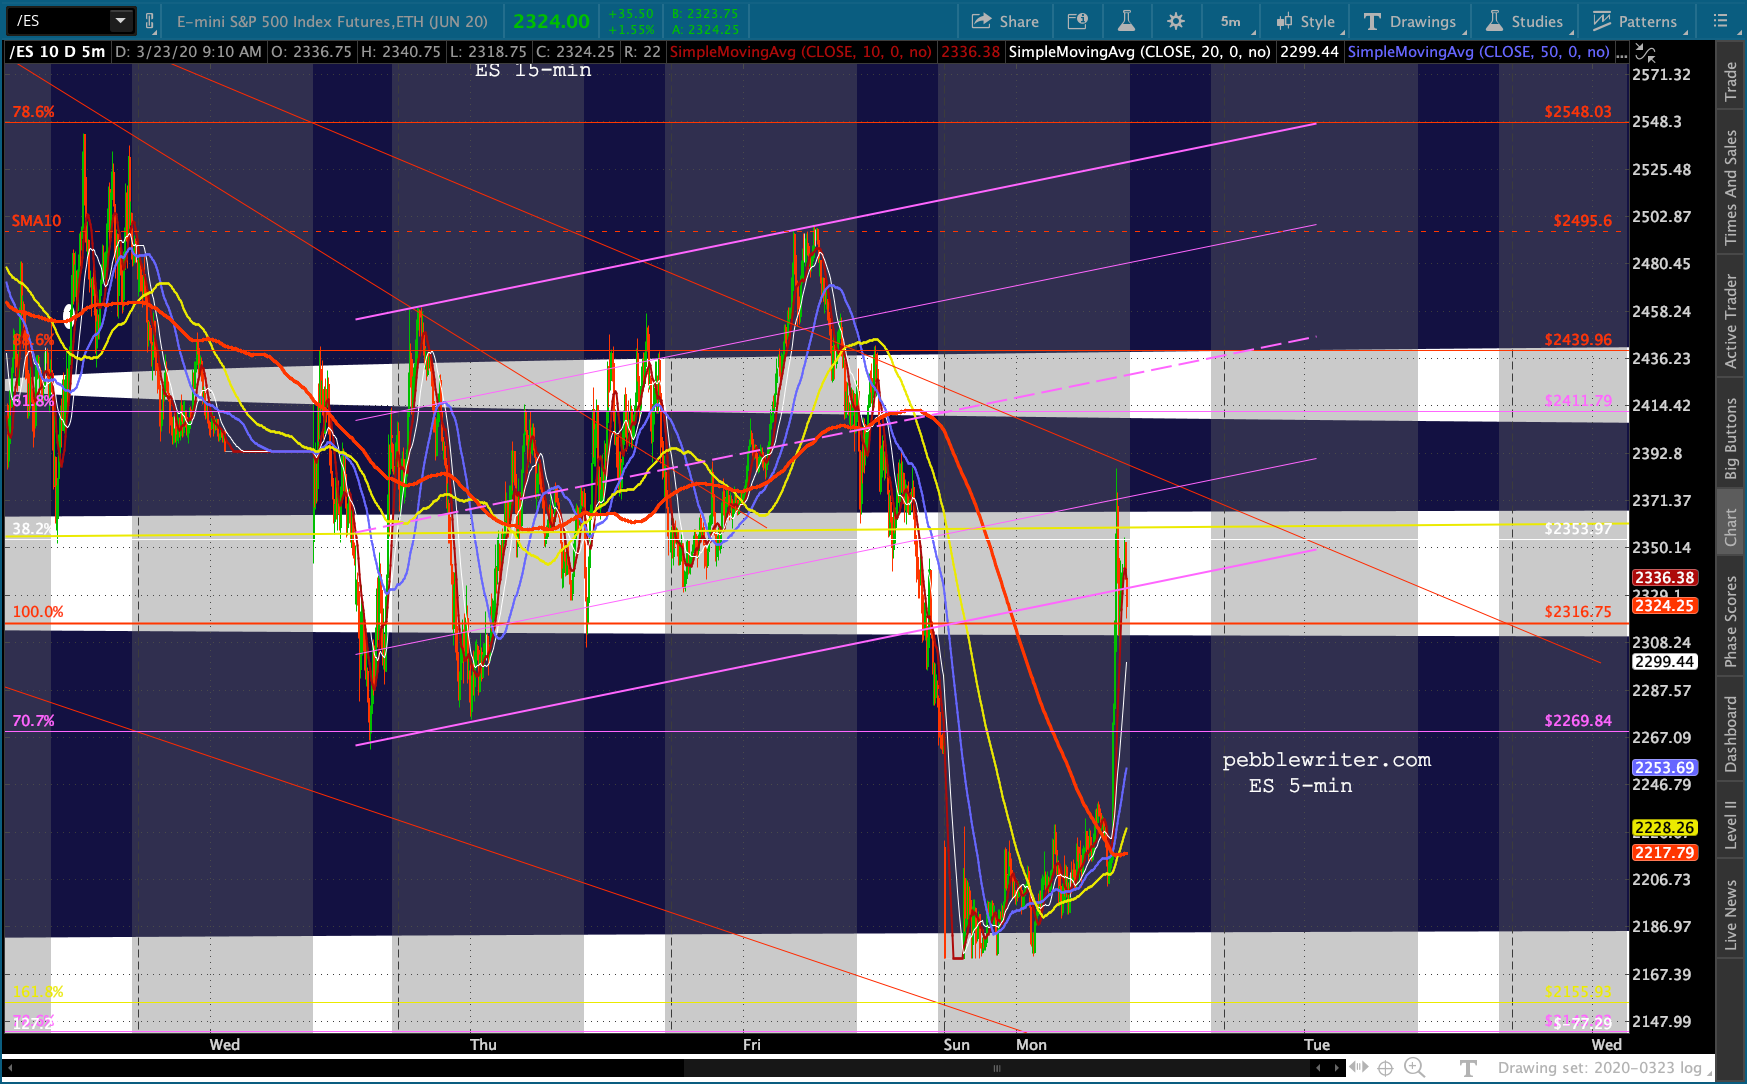
If ES’ and SPX’s white channels are yielding in favor of the slightly less aggressive purple channels (channel tilting) then we can look for a .618 or .786 retracement of last week’s lows.
Once the neckline is topped, however, both would have room to run.
For now, the algos continue to follow VIX’s lead. A drop through the SMA5 200 would point to a test of the SMA20 and red neckline at 58.60. A drop through it would unleash the bulls for another leg up.
Working against that outcome: CL continues to falter, dipping below 20 several times overnight.
Remember, the white line at the bottom of the chart is critical support — reached, in this case, several years ahead of the what our cycle model charts indicated. A slowdown shutdown of global economic activity will do that to you.
RB, which saw a nonsensical bounce last Wednesday, is coming to its senses this morning. Like CL, it is walking on eggshells in terms of support.
Getting back to the bond market… The Fed appears to have finally figured out what our yield curve model has been saying for the past year or two: a breakout above critical support in the 2s10s would decimate stocks just like it did in 2000-2003 and 2007-2009.
While the 2Y has dropped through support again…
…the 10Y is more than keeping pace…
…allowing the 2s10s to decline sharply.
Of course, a drop back below the 1.272 Fib at 8.16 should also be expected to spook algos. So, this is a move that cannot really help the bulls longer term unless the 2Y were to spike higher – unlikely in the current central bank cash-for-trash environment.
On the currency front, USDJPY found its footing overnight at its SMA20 and bottom of its formerly broken white channel and backtested its SMA200 – now at 108.306…
…which, along with EURUSD’s temporary push above its SMA200…
…enabled DXY to bounce before even reaching its SMA200.
The algos might be forgiven for being slightly confused. There have been so many supportive actions on the part of bonds, currencies and VIX – but, not yet enough to force a breakout. The implication is that they are being tasked with delaying the next leg down rather than engineering another leg up. This jibes with our belief that month- and quarter-end rebalancing is driving much of the upside.
As always, I’m open to being proven wrong. But, at this point, the bulls are behind the eight ball – with a handful of gimmicks tasked with offsetting some compellingly bearish economic reality. Trump acknowledged that things won’t be better by Easter, though he falsely maintains the virus will “peak” by then.
Unless one of the treatment protocols being experimented with proves successful in the next week or so, the virus will be much worse by then. Our model has been right on track and continues to indicate deaths (2,484 as of yesterday) will reach 10,000 by Friday or Saturday and 100,000 by Easter.
On a positive note, Italy has seen a slowdown in the daily rate of growth in cases and deaths. Over the past few days, cases have grown at 7% per day and deaths at about 10% per day. Unfortunately, deaths have topped 10,000 and the mortality rate (deaths as a percentage of total cases) now stands at 11%.
It would be nice if the US could look forward to such a slowdown. But, in the absence of widespread lock-downs and given the continuing shortage of testing kits, this is hardly likely. Studies show that up to 50% of infections are from those who have few or no symptoms. Without widespread testing, we will see the lag between Italy and the US – originally 11 days and now down to 7 – continue to quickly erode until the US takes the lead in deaths.
UPDATE: 3:00 PM
ES has pushed above the neckline and is testing the SMA20, though SPX has yet to register a new high.
VIX has broken below its SMA20 and neckline, but not yet the typical cratering that we often see in the final hour.
CL and RB are rebounding somewhat, but lower lows and lower highs for both so far.
This leaves USDJPY, which failed to retake its SMA200, and DXY, which has yet to backtest its SMA200. Bottom line, this still looks like a stall and not a breakout to new highs, especially when you take the near breakdown in 2Y and breakout in 2s10s into account.
For traders with a strong constitution and the ability to hedge overnight, this is another selling opportunity.
UPDATE: EOD
SPX studiously avoided a higher high, thanks largely to USDJPY’s last second breakdown which offset the VIX dip at the close. In other words, TPTB are working to keep the bounce contained (for a change.) This doesn’t mean it won’t ramp higher overnight, but it’s a good sign (or a great head fake.)
FWIW, ES even backed off its SMA20 and made a lower high…
…while VIX found a little TL to backtest.
GLTA.


 VIX continues to call the shots, as it has dropped through both the red neckline and the SMA20. Yet, it continues to bounce every time SPX/ES approach a breakout point, indicating that the bounce might indeed be petering out.
 continued for members…
For its part, SPX is still below the purple trend line from 2016 and, like ES, avoided making a higher high yesterday.
continued for members…
For its part, SPX is still below the purple trend line from 2016 and, like ES, avoided making a higher high yesterday. As expected, USDJPY has edged back above its SMA200, providing an extra nudge for stocks…
 …and putting a little bounce in DXY’s step.
 EURUSD is contributing by continuing its decline after failing to retake its own SMA200.
 The 10Y has remained below the 1.272 support…
 …squeezing the 2s10s back to a neutral 47 bps…
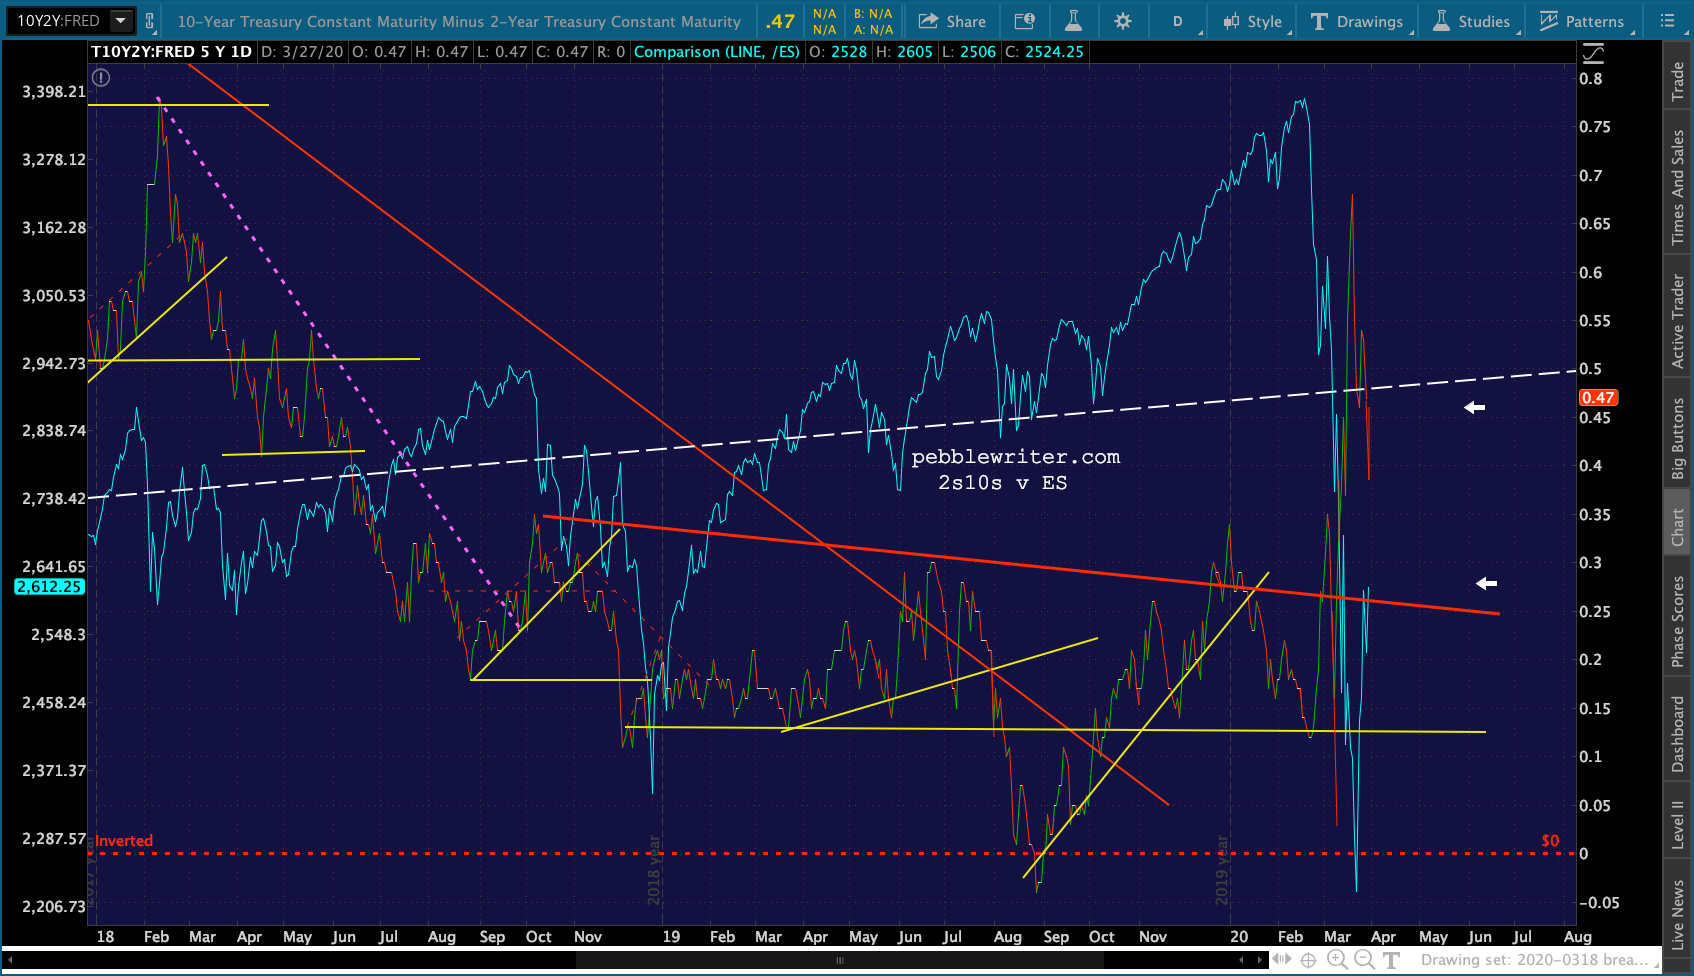 …with the 2Y still hanging on for dear life. A reminder, this is one of the last substantive support levels for the 2Y. The coming breakdown will likely widen the 2s10s, making any further equity gains difficult.
 Gold continues to be a model of restraint, backtesting its red channel again as it plans another assault on 1708-1735.
 Trump and Putin reportedly put their heads together yesterday to plan a rescue for oil prices. But, CL has yet to exhibit much of a bounce and remains mired at the lower end of our 20-26 range. Perhaps it has something to do with all that surplus oil sloshing around, searching for any storage facility with extra capacity.
 While higher oil prices would certainly help stocks – an important goal for many but none more so than Trump himself – they would be a tax on the many unemployed and beleaguered consumers who are wondering how to make ends meet while they await their government checks.
For many of those in high-priced areas such as major coastal towns, of course, those checks can’t come fast enough and likely won’t cover rent/mortgage payments – a topic for a future post.
Gas prices continue to loiter at the bottom of that falling channel, though the bounce off recent lows is looking rather tired.
While higher oil prices would certainly help stocks – an important goal for many but none more so than Trump himself – they would be a tax on the many unemployed and beleaguered consumers who are wondering how to make ends meet while they await their government checks.
For many of those in high-priced areas such as major coastal towns, of course, those checks can’t come fast enough and likely won’t cover rent/mortgage payments – a topic for a future post.
Gas prices continue to loiter at the bottom of that falling channel, though the bounce off recent lows is looking rather tired.
 In the absence of any miraculous medical breakthroughs, it still looks like yesterday’s highs will continue to hold and ES/SPX’s trajectory will be lower, perhaps to the bottom of the rising purple channels around 2350 as early as tomorrow. That should be the next line in the sand, with ES 2155 and SPX 2138 still our preferred downside targets.
While we’re in forecasting mode, I’m told that this site should be working normally sometime later today. If you’re reading this on pebblewriter.com, you’ve already figured that out. I’ll repost on pebblewriter.blogspot.com …just in case.
I’m going to take some time and update our COVID-19 forecast which, sadly, continues to be on target. More later.
UPDATE: 3:25 PM
As we wander into the final hour, things aren’t looking very bullish. Never underestimate the power of a last-minute VIX smackdown, but there are quite a few warning signs flashing red.
First and foremost, the 2Y just dipped down to .191, the lowest it’s been since the US lost its AAA in 2011.
In the absence of any miraculous medical breakthroughs, it still looks like yesterday’s highs will continue to hold and ES/SPX’s trajectory will be lower, perhaps to the bottom of the rising purple channels around 2350 as early as tomorrow. That should be the next line in the sand, with ES 2155 and SPX 2138 still our preferred downside targets.
While we’re in forecasting mode, I’m told that this site should be working normally sometime later today. If you’re reading this on pebblewriter.com, you’ve already figured that out. I’ll repost on pebblewriter.blogspot.com …just in case.
I’m going to take some time and update our COVID-19 forecast which, sadly, continues to be on target. More later.
UPDATE: 3:25 PM
As we wander into the final hour, things aren’t looking very bullish. Never underestimate the power of a last-minute VIX smackdown, but there are quite a few warning signs flashing red.
First and foremost, the 2Y just dipped down to .191, the lowest it’s been since the US lost its AAA in 2011.
 It quickly snapped back to the .22 support, but this is a pretty big deal according to our 2Y model.
 The other pretty big deal continues to be the oil market collapse. Sure, it clawed its way back to the channel bottom, but for how long? The next lowest support is the Nov 2001 lows at 17.12.
 Then there’s DXY which, thanks to USDJPY and EURUSD, is having a hard time staying aloft.
 Although the USDJPY could still go either way, the BoJ apparently hasn’t signed off on a wholesale devaluation of the yen.
 This leaves poor little VIX with a lot of lifting to do. As the month- and quarter-end rebalancing winds down, can it continue to offset a very grim economic outlook which, according to Goldman, includes a -34% Q2 GPD read.
 The worst of the economic data has yet to roll in, but in the days ahead we’ll get ISM, EIA inventories, factory orders and payrolls. It won’t be pretty.
 ES and SPX might be able to hold support at the close, but I wouldn’t trust them overnight regardless of where they close – not on a bet.
 GLTA.
GLTA.