

With oil having reached our upside target and DXY our downside, we can expect today to represent an inflection point. Will it spill over into equities?
 continued for members… (more…)
With oil having reached our upside target and DXY our downside, we can expect today to represent an inflection point. Will it spill over into equities?
continued for members… (more…)
With oil almost to our upside target from last month, and DXY having reached our next downside target, today should shed some light on the direction over the next few weeks.
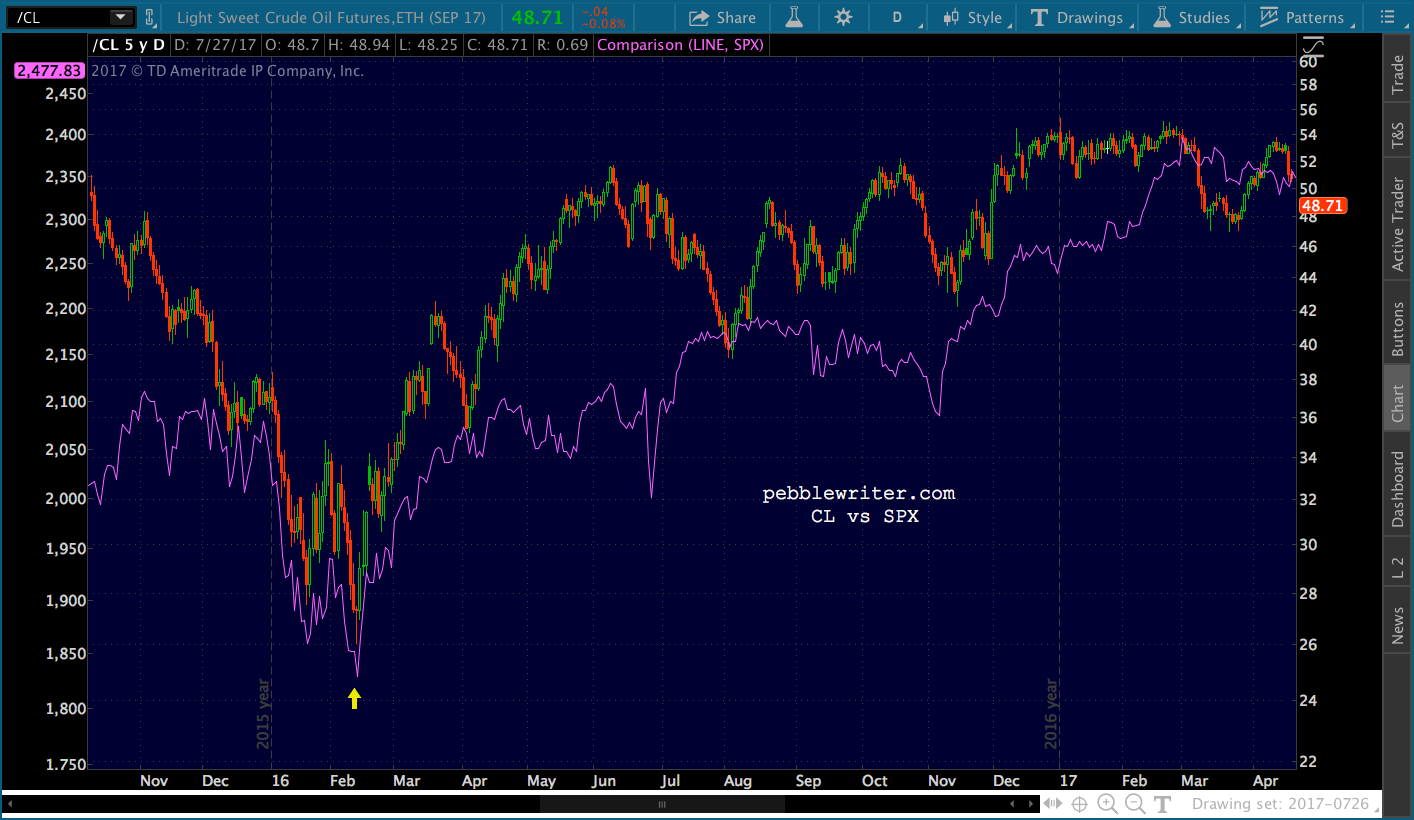
On June 20 [see: Jun 20 Update on Oil] we anticipated WTI would bounce off the bottom of the rising purple channel to the resulting .886 at 50.96.  A week later, we slightly adjusted the timing to Aug 8 and price target to 49.82. This morning, CL reached 49.39, meaning there are some important decisions to be made about oil prices, currencies and inflation. It’s a great segue to Part II of yesterday’s post on central bank options.
 continued for members… (more…)
One of the more surprising articles to surface in the mainstream financial press in the past week came from Bloomberg. In “Japan’s Central Bank is Distorting the Market, Bourse Chief Says,” Exchange Group Inc CEO Akira Kiyota claims that Kuroda’s purchase of $54 billion per year in ETFs artificially suppresses volatility.
 This will hardly come as a surprise to our readers, as we rant about market manipulation on a daily basis. But, the Exchange Group operates the Tokyo Stock Exchange. So, this isn’t some tin foil-hatted nut job blogging from his fishing cabin in Montana. It’s very public criticism from a major Japanese insider, a rarity in Japanese culture.
Kiyota’s complaint seems at least partially grounded in the fact that the lack of volatility, currently at 12-year lows, has suppressed trading volume. If the BoJ and GPIF are going to step in and buy every dip, what’s the point in speculating? Why not just set and forget?
Well, it turns out there are limits to this rainbows and unicorn strategy. Apparently, some folks are starting to do the math. The BoJ currently owns 13% of Fast Retailing, the most heavily weighted company on the Nikkei 225. At its current rate of buying, the BoJ will own 75% of the float by March 2018 and virtually all of it within three years. What then?
And, Fast Retailing isn’t an outlier. As of last June, the BoJ owned about 71% of all shares in Japan-listed ETFs. Bloomberg estimates that by the end of 2017, the BoJ will be the top shareholder in 55 of the Nikkei 225 companies.
The ECB faces similar problems with its bond buying. ABN AMRO analyst Kim Liu estimates that the ECB bought €400 million fewer German bonds, and in shorter maturities, than its guidelines allowed in April. German bonds aren’t the only ones being purchased in lesser quantities.
 Many analysts have concluded that the dwindling supply of bonds, alone, will necessitate a taper and result in falling asset prices as well as higher interest rates. While I share in their concern, I feel certain that the ECB, along with its counterparts at the FOMC and BoJ, will do “whatever it takes” (to borrow an overused phrase from Mario Draghi) to keep a lid on interest rates.
Without question, this is the most difficult challenge facing central banks. Both central bank and overall debt has skyrocketed since the Great Financial Crisis. There’s a very convincing argument to be made that debt growth has been the primary driver for the “recovery.”
On realinvestmentadvice.com, Lance Roberts argues that debt growth before 1980 was consistent with very strong GDP growth, which averaged 7.70%. Since 1980, GDP growth has steadily fallen as debt levels have soared. By Roberts’ calculations, total debt must fall by at least $35 trillion in order to reach structurally sustainable levels. A drop of that magnitude hasn’t occurred since the Great Depression.
 Of course, the economy is doing much better since the Depression, right? Not so fast. A quick comparison of GDP growth over the past 10 years shows that the average growth has been exactly the same as during the 1930s.
 The massive build in debt has been made economically possible by ZIRP and NIRP. A return to historically average interest rates (US 10YR about 6%) would put debt service at or near the top of spending categories (as a percentage of tax revenues) for the US, ECB and Japan. Simply put, no central bank can afford for rates to normalize.
What’s the end game? If I’m Mario Draghi, Janet Yellen or Hiruhiko Kuroda, I’m probably hoping to retire before the debt chickens come home to roost. Otherwise, there’s a very delicate balance to be drawn between rates that are high enough to sustain savers and investors without being so high that they choke off corporate profits and exacerbate government deficits.
Paying your Amex bill with your Visa card is okay as long as Visa charges you 0% interest (or pays you interest, as is the case with NIRP.) But, sooner or later, Visa might decide they’d like to make money, too.
In this case, Visa represents a lot of pension plans, insurance companies and retirees whose cost of living adjustments, based on fictitious CPI data, are already inadequate. And, corporations using low-interest loans to buy back their stock hand over fist might be less enthusiastic if there were a price attached.
And, of course, that’s in the aggregate. Each central bank has its own issues with respect to inflation and currency strength. The yen carry trade, which levitate stocks so well in the wake of Fukushima, left the yen so weak that oil and gas prices became problematic for Japan. Likewise, the slumping US dollar might help gin up some inflation for a net importer like the US; but, it’s bound to cause problems for eurozone exporters — many of which are already on the ropes.
So, what’s a central banker to do? Central banks which purchase stocks outright, such as the BoJ and SNB, have little choice but to continue propping up stocks. As we’ve been writing for a couple of years [see: Japan’s Equity Trap] they’ve painted themselves into a corner. But, there are other ways to achieve higher stock prices than buying them outright.
Algorithmic trading, ETFs, Smart Beta and indexing have all gained market share over the past few years, leaving active equity managers and human traders with a dwindling share of volume. The net effect is that the factors which trigger algos to buy stocks have become a very powerful force in moving overall equity prices.
We saw this in spades with the afore-mentioned yen carry trade between 2011-2015. Even though the USDJPY topped and retreated, it can still be seen influencing stocks on a regular basis when it breaks out of a decline or through a significant technical level. Likewise, oil prices have made their mark as an important algo trigger. Our Feb 11, 2016 bottom call was occasioned by the recognition that stocks were in danger of breaking down. Oil and USDJPY were supported in order to, in turn, provide critical support for stocks.
 But, as we’ve written many times before, currency and oil price movements have consequences: inflation, trade imbalances, corporate profits, GDP, etc. Central bankers needed a way to support stocks without all the nasty side effects.
Anyone designing a trading algorithm today would be foolish not to include VIX — traditionally a measure of fear (or, lack thereof) in the markets. Established in 1993 — a year in which SPX ranged from 426 to 471 — VIX hit a low of 9.31 before settling into a range of 16 – 60 over the next few years before beginning a general decline from 2003 to 2007. Of course, that didn’t last. But, the 24 years of VIX’s reliable reaction to stock market gyrations established its bona fides as an important indicator of what was happening and, more importantly, what was about to happen. For a algorithmic trading program looking for important factors, it can’t be ignored. And, it’s not.
When SPX reached it critical 1.618 Fib extension of the 2007-2009 crash in May 2015, it fell to the 1.272, which happened to be where the bottom of a long-term channel resided. It can be seen in purple in the chart below (arithmetic, not log scale.)The subsequent bounce put it right back in the hunt for higher prices.
But, by then, USDJPY was spent. It couldn’t go any higher with creating serious negative consequences for the Japanese. When it broke down, SPX did, too. The 1.272 was tested again in January and February of 2016 — this time dropping out of the channel which had guided its recovery since 2009.
This was a serious development which no doubt had trickle down wealth-effect central bankers sweating bullets. Something needed to be done, and quickly.
 Oil and USDJPY were supported, as mentioned above, which stopped the bleeding. And, thankfully, someone figured out that VIX was a very viable tool for influencing algos. The rest, as they say, is history.
Stocks were rescued, found their way back into the rising purple channel, back above the 1.618 extension, and have been on the rise ever since. The only “side effect” has been the head-scratching (not everyone reads this website!) surrounding VIX’s breakdown to all-time lows.

Were central bankers responsible for VIX’s actions? I have no proof one way or the other. But, after spending trillions of dollars buying stocks and bonds in order to prop up markets, they’d be foolish not to spend a few hundred million shorting VIX from time to time — especially when SPX reaches critical resistance or faces an intraday meltdown.
Anyone can pull up 5-min charts for SPX and VIX and see for themselves that VIX almost always leads stock prices rather than the other way around. When it doesn’t, it’s usually because USDJPY or CL is doing the heavy lifting, or SPX needs to backtest important support that it just broke through without any discernible reason.
No fuss, no muss. New all-time highs for SPX as VIX makes new all-time lows. What could go wrong?
We’ll delve into that question, and central bankers’ likely response, in the days ahead.
VIX and CL are giving the algos plenty to love this morning. VIX is plumbing new, all-time lows and CL continues yesterday’s rebound on its way to our upside target.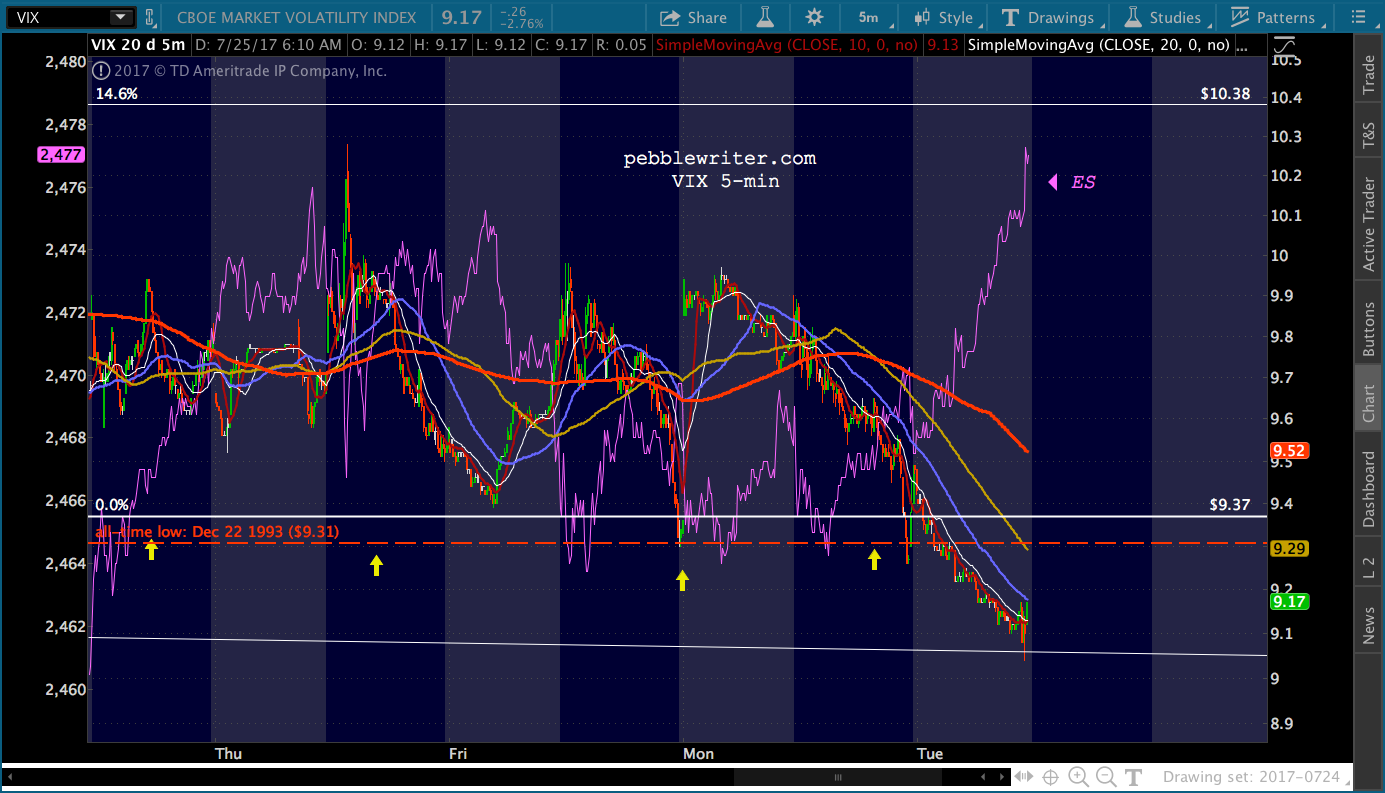 Yesterday, VIX’s actions were enough to break SPX out of its falling purple channel and close a minor gap. This morning, there’s a good chance of higher highs — depending on what the Fed has in store.
continued for members… (more…)
What a difference a week makes. I was hoping that taking a week off would see some semblance of sanity return to the markets. Apparently, that was too much to expect.
A week ago, the US dollar pairs had reached long-term objectives, SPX was running out of steam and VIX’s all-time low was set way back in 1993.
Today, the dollar is running for cover, SPX has broken out yet again, and VIX set new all-time lows — having spent all but 4 sessions of the past three months below the bottom of our long-term rising yellow channel. We’ll look at the repercussions of all the above, and what to expect next.
continued for members… (more…)
In our last update on the Nikkei [see: Mar 23 Update] with NKD at 19190, we called for a 3% drop to support at 18631 and a subsequent 9% rise to 20286.
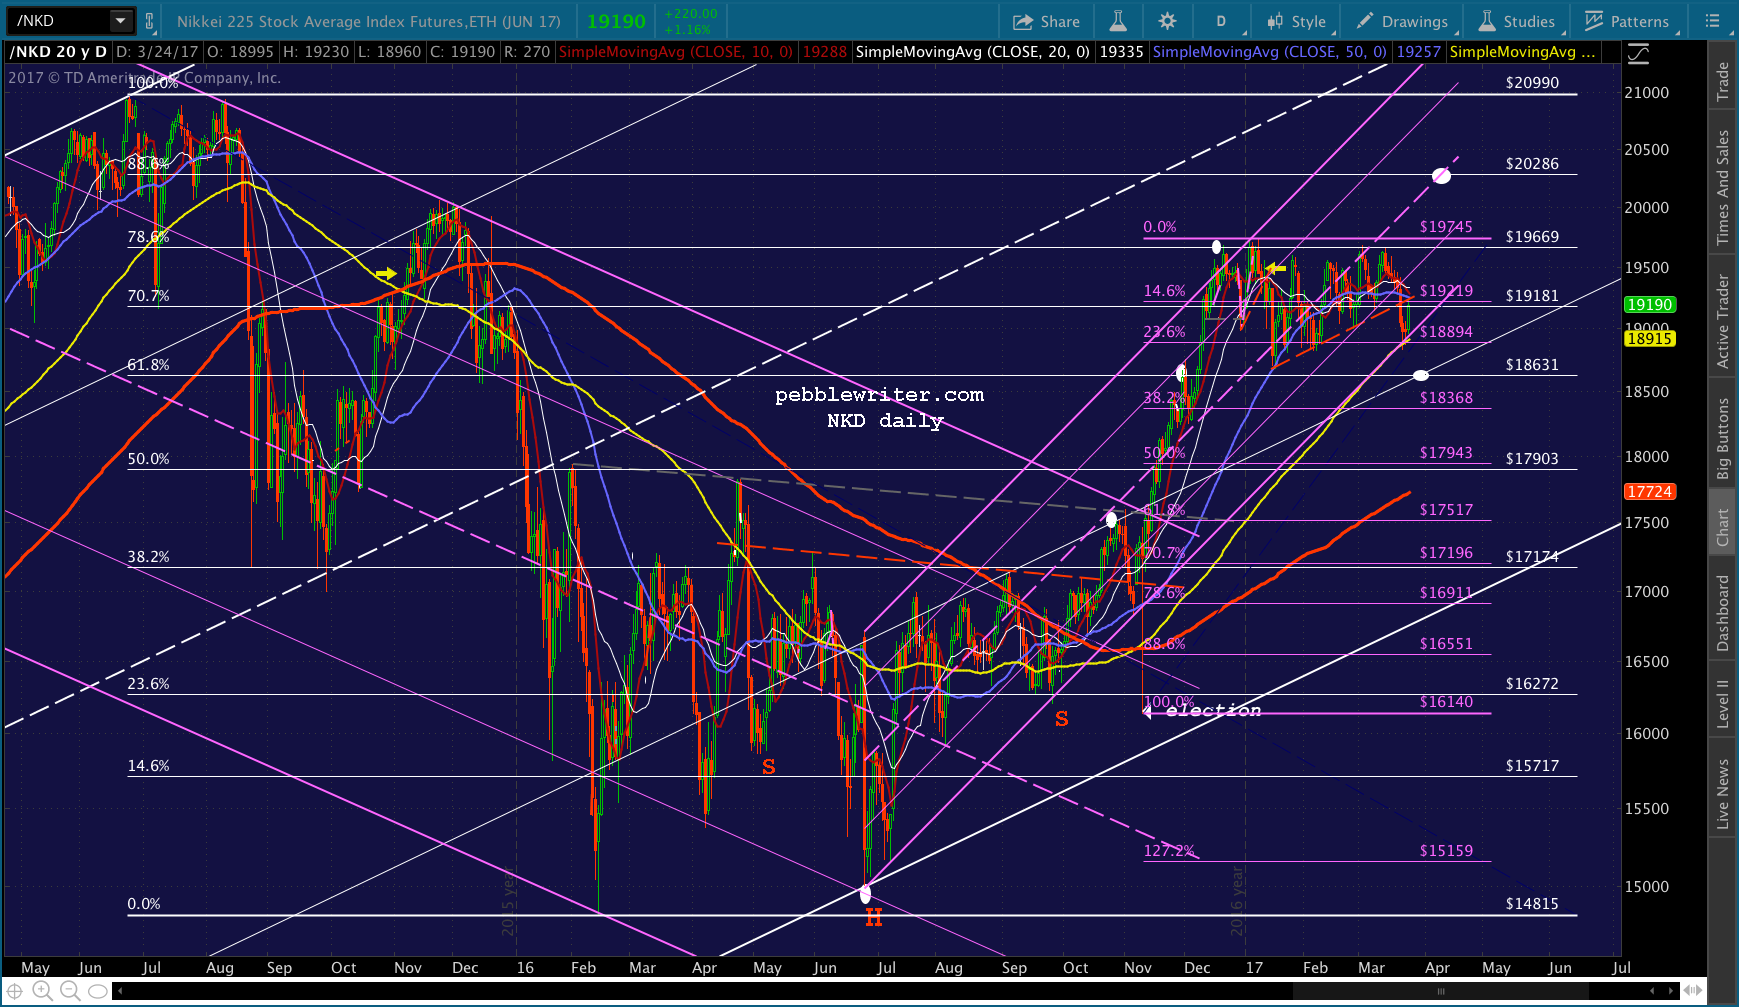 As it turned out, the drop was a little deeper than expected. But, the subsequent rebound nailed our upside target, reaching 20320 on Jun 20 and making a series of lower highs and lower lows since then.
 For years, I have found the Nikkei to be a great indicator of the extent to which central banks (in this case, the BoJ) will go to manage stock prices. It continues to offer very strong signals about what to expect, next, from equities in general.
continued for members… (more…)
If the algos had their way, the economic data might not even be reported.
As expected, inflation is still nowhere to be found. The USD, which was doing its best to hold its ground on the back of recent hawkish Fed comments, has plunged below key support. Yet, futures are still in the green. Is this a turning point, or are we really going to see new highs on lousy economic data yet again?
As long as VIX has room to maneuver lower — which it does — there’s a very good chance. continued for members... (more…)
If you enjoyed watching Janet Yellen spend several hours avoiding saying anything remotely interesting yesterday, you should love today’s Senate Banking Committee testimony.
In the meantime, EURUSD has reversed at our upside target and broken trend to the downside… …even as USDJPY makes a feeble attempt at stabilizing.
 The net result is a dollar index which seems utterly confused.
 There are two clues, however, that should not be missed. One is that PPI came in at +2.0% YoY, a very questionable number given the actual sharp decline in oil and gas prices. But, not surprising, given that the Fed is trying to defend the USD here…
 continued for members… (more…)
On May 16, we adopted the position that weak inflation – driven primarily by oil prices that we expected to plunge after a brief rally – would lead the EURUSD to rally sharply [see: May 16 Update on EURUSD.]
Our forecast, shown below, also required DXY to make new lows — which most analysts derided as unlikely in a rising interest rate environment.

Sure enough, WTI spiked for about a week, then plunged right to our downside target over the following month. This took the wind out of inflation’s sails, leaving the Fed’s rate hike argument looking more than a little iffy.
 The net effect? Yesterday, EURUSD nailed our upside target.
 With Yellen’s testimony coming up, it’s an opportune time to review the overall currency picture and its likely effect on equity prices – and, by that, I’m not talking about the latest VIX-driven ramp job.
 I’ve been promising a turning point for the past several weeks, and it’s finally here.
continued for members… (more…)
