

The last time we focused on the Nikkei [see: The Nikkei, Yen and Oil: Joined at the Hip] it had bounced sharply following the US election. Given the fundamental headwinds Japan faced at the time, the bounce seemed fairly preposterous.
…the Nikkei 225…has soared 2,600 points in the face of: (1) the election of a protectionist US president, (2) higher oil prices, and (3) higher interest rates.
But, it had landed NKD at our upside target: the .618 Fibonacci level at 18631.

Ordinarily, we would expect a substantial pullback at a key Fib level like this — especially when the circumstances were a little sketchy. Instead, NKD settled a measly 500 points (2.7%) and was swept up, like practically everything else, in the year-end stampede to all-time highs. It spurted up to the .786 Fib at 19669 by mid-December.
If there had been more of a pullback at the .618 Fib, we might have expected the .786 Fib to matter (i.e. a Gartley Pattern.) But, with such a brief stay at the .618, it wasn’t at all clear. Coincident algo drivers such as oil had also topped out. Would NKD be affected?
Unfortunately for the bulls, the race to year-end new highs was exhaustive. NKD spent a full three months treading water and even breaking down — but, never by much. Finally, on Tuesday, it did — shedding 2% in a single day. But, it won’t surprise anyone to learn that this uber-manipulated index landed at strong support.
continued for members…
Like SPX, NKD has managed to construct a rising channel within a rising channel. Topping SPX, it managed to stay within this steeper (purple) channel during its latest tumble, and tagged a key SMA100 at the same time.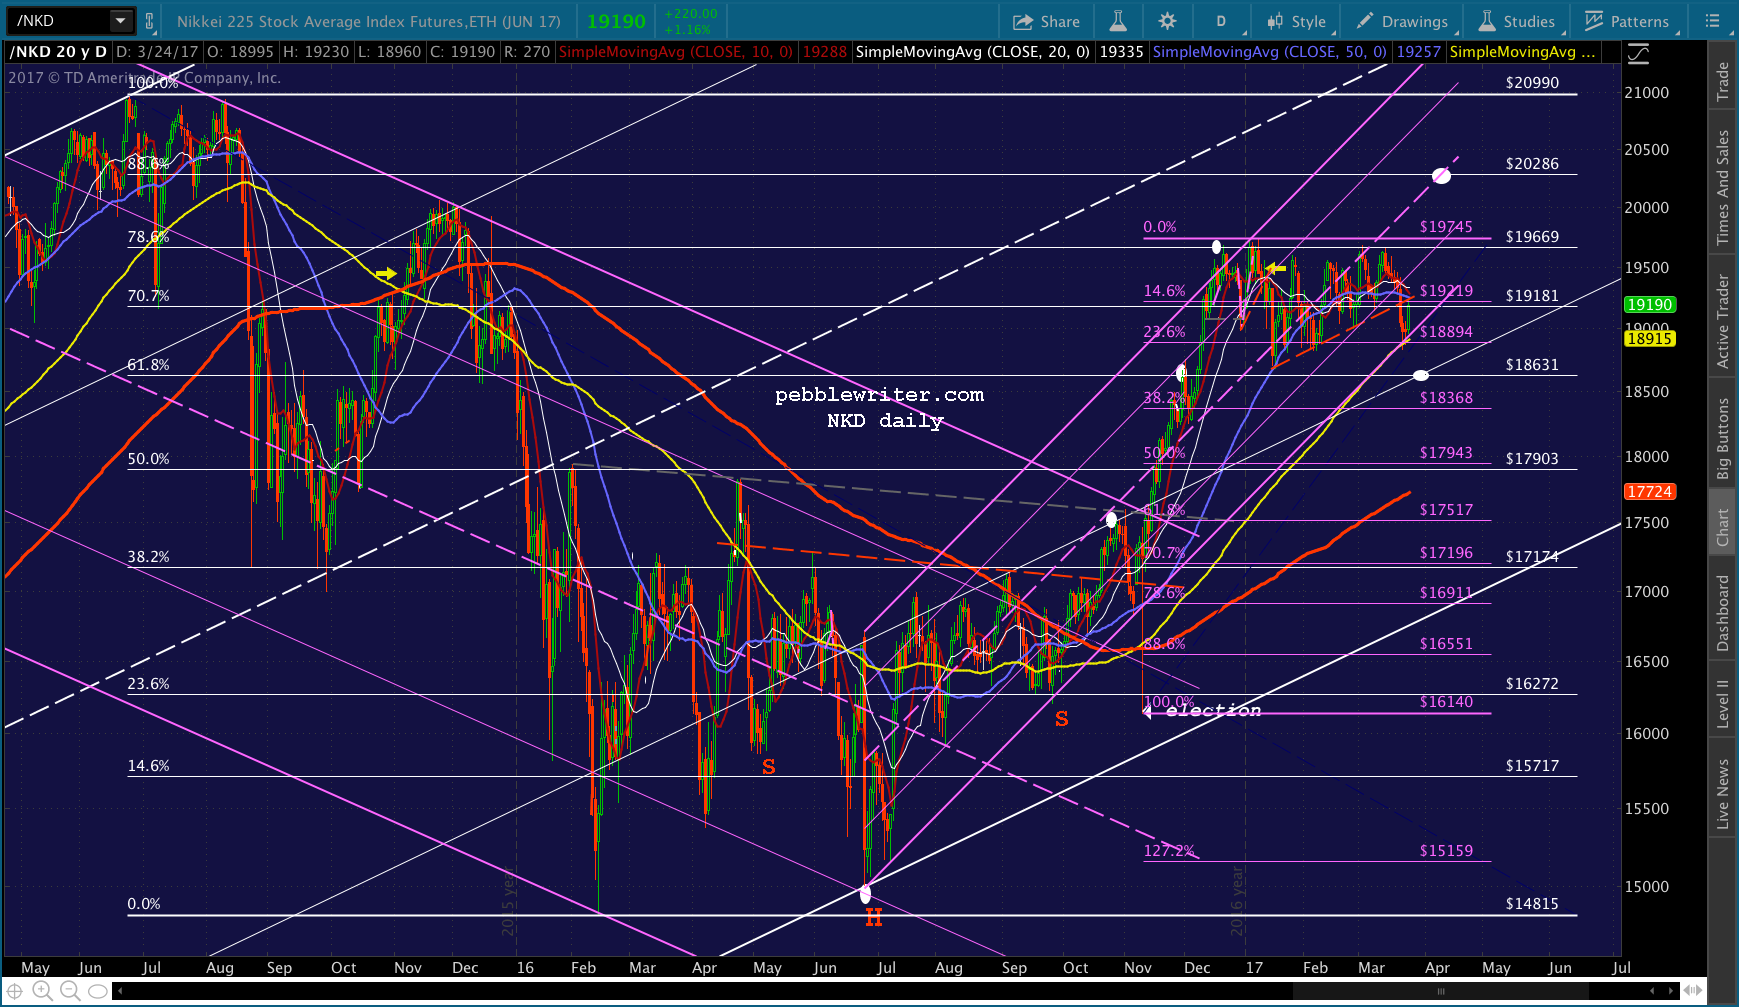
It works only if we ignore the huge tail on the Nov 9 candle — the twenty minutes of sanity in between when investors realized that Trump’s election could be disastrous for Japan and when central bankers rushed in and “fixed” things.
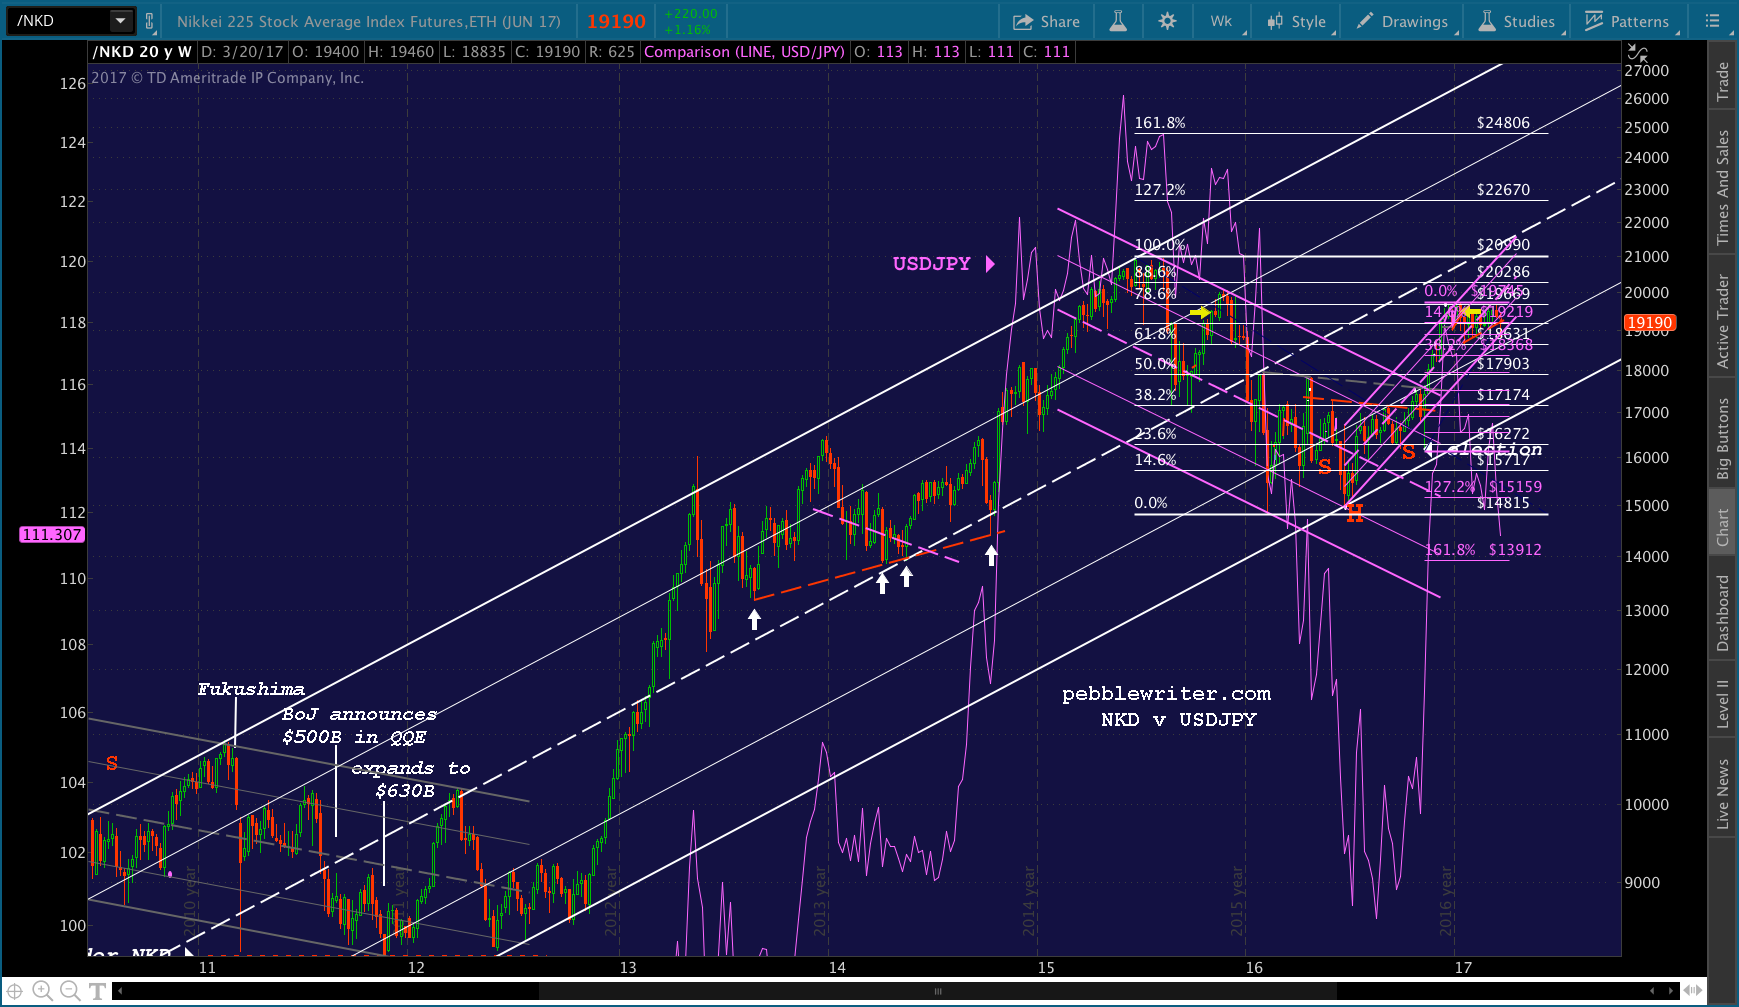
The effect of a suddenly spiking USDJPy can be seen on the daily chart below… …and, the weekly chart showing the effects dating back to Fukushima.
As we’ve discussed, the yen can’t weaken forever — especially as oil (priced in USD) is getting more expensive. So, the weakening USDJPY (rising yen) finally caught up with NKD this week. The fact that NKD caught a bid at the SMA100 might indicate the USDJPY is ready to reverse higher.
Another possibility is that USDJPY, which might have its eye on the SMA200 at 108.16, will compel NKD to properly backtest the rising white channel’s .236 line at the .618 (18631.) We should know in the next few days, as just today NKD backtested the red TL below which it fell Tuesday.
If the bulls get their way, this past week was just a pause on the way to greater glory, starting with the .886 at 20286. But, if the SMA100 breaks down, we’ll be looking for a quick — perhaps even intraday — plunge to 18631.
Stay tuned.