

In our last major update on the EURUSD [see: Nov 25 Update] I attempted to tie together currencies, oil and equities in one nice, neat package. My basic premise from that post:
- DX would top at our 102.098 target despite an imminent rate hike
- USDJPY would rally strongly into year end, despite the fact that DX was topping
- SPX would rally strongly into year end
- EURUSD, having shed 5.9% since our top call in September, would rally to 107-108
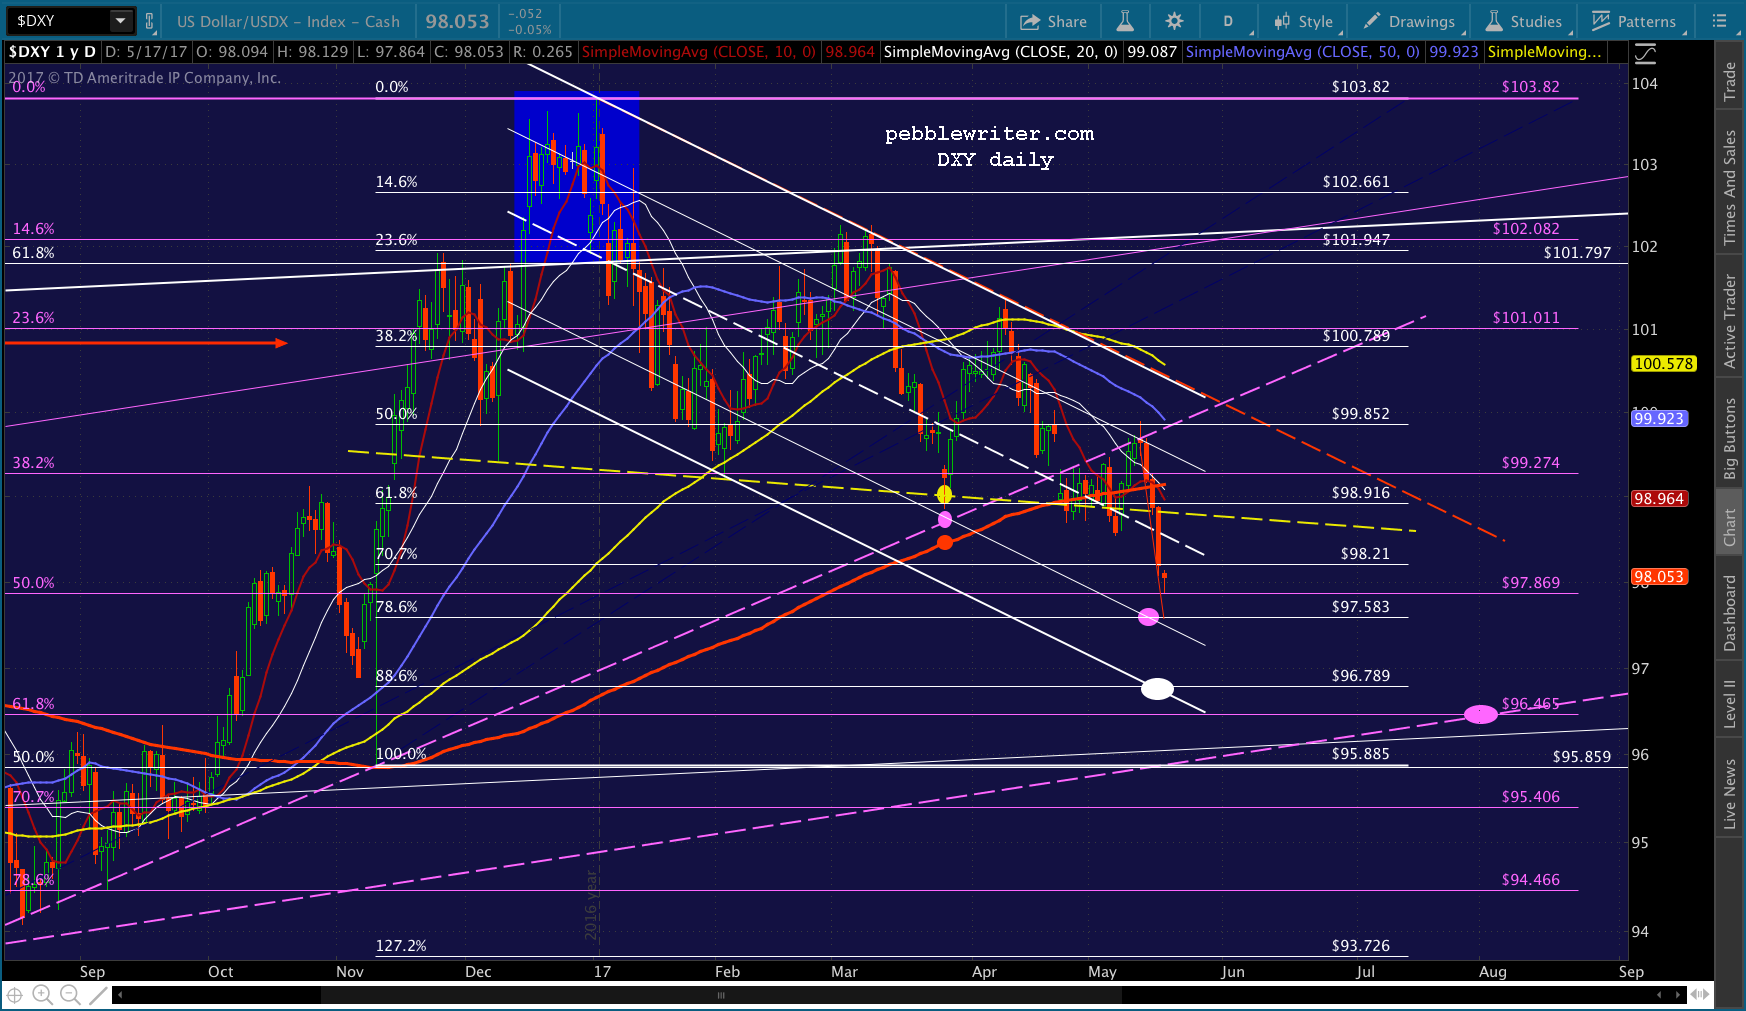
Things worked out pretty much as forecast. DX reached our target (103.82), making no appreciable gains after the rate hike and well on its way to our downside target of 96.789. USDJPY rallied 5.4% through the year end before topping out and beginning a 3.6% slide. SPX gained 9% to new, all-time highs.
EURUSD was the one outlier. It reached our target area in only two weeks’ time and promptly reversed below support. This was not entirely unexpected, as there was some question as to when oil would top out. I expected it to have an impact.
Suppose OPEC pulls it together and CL starts another leg higher now? Stocks will soar, allowing USDJPY and DX to come back to earth. EURUSD will rebound very strongly — not merely enough to prop stocks up for a month or two. We’d likely be looking at a rally of several months. Targets would start at 1.0756-1.0815 and go higher.
After hitting its upside target, EURUSD slumped below its Nov 25 lows, shedding 4.9% over the next several weeks.
 It came within .0114 of our primary downside target (102.225, established in early 2015) before beginning a steady recovery that has seen it climb 7.5% from its lows. We’ll look at why it couldn’t hold the December highs, why it fell short of our 102.225 target, and where it goes next.
continued for members…
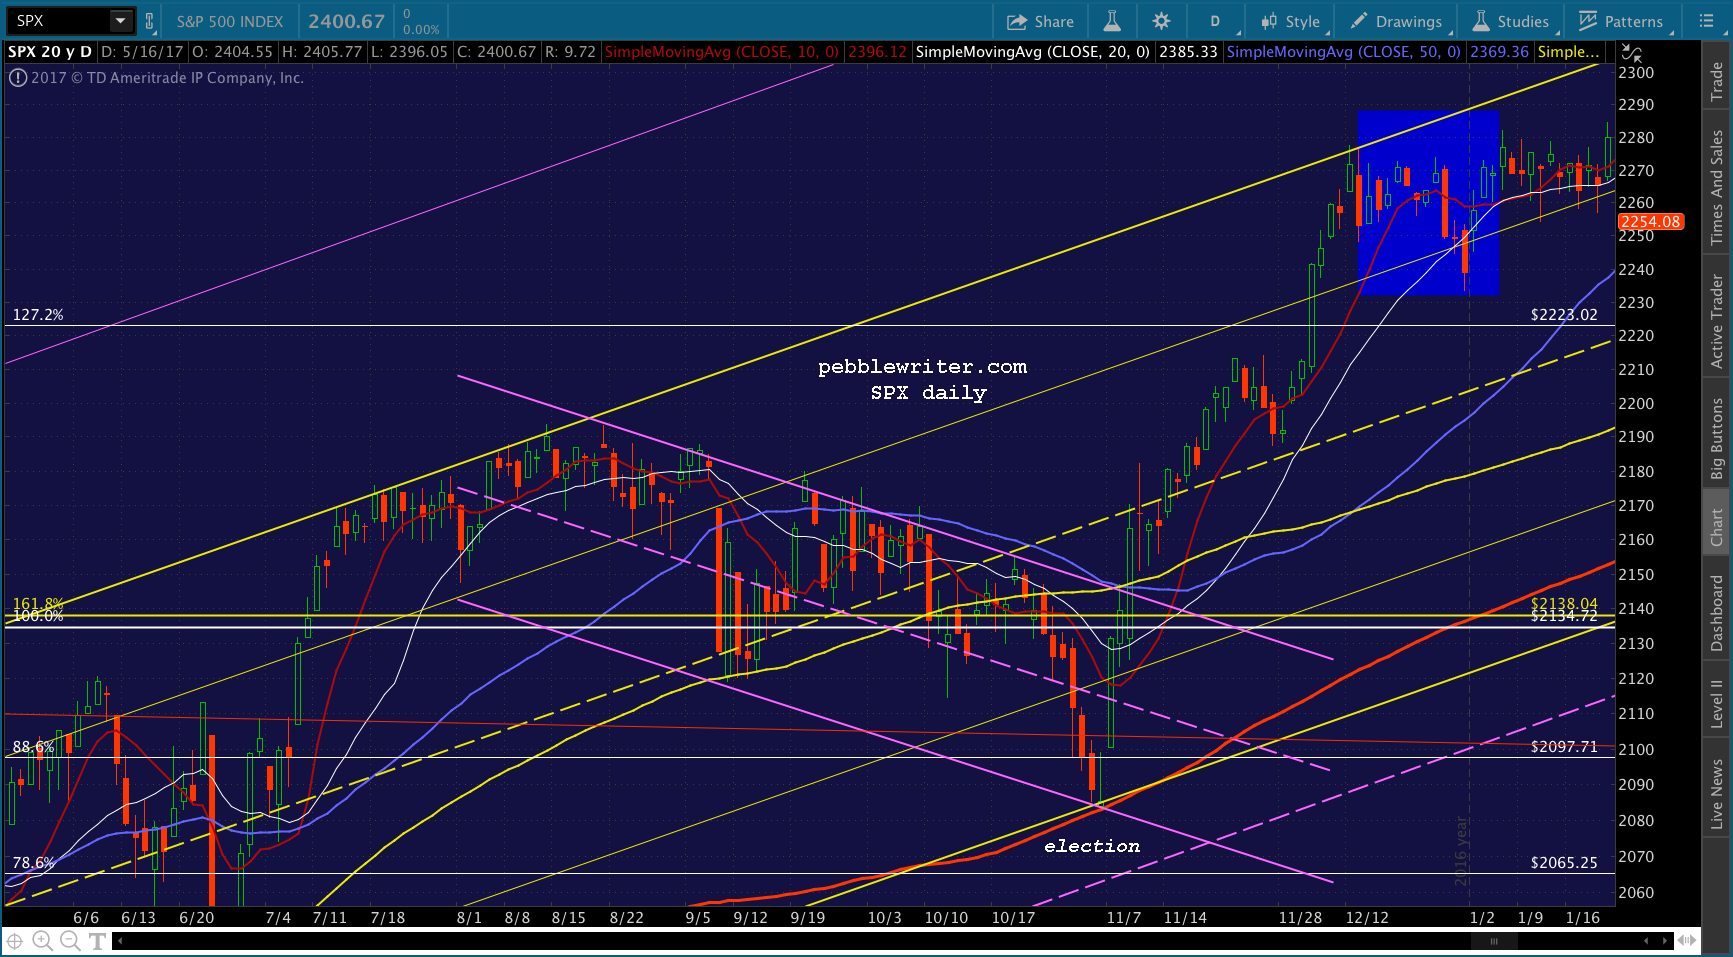
As I posted earlier today (technically, yesterday now) EURUSD has broken out. But, it’s how it got here that I find most interesting.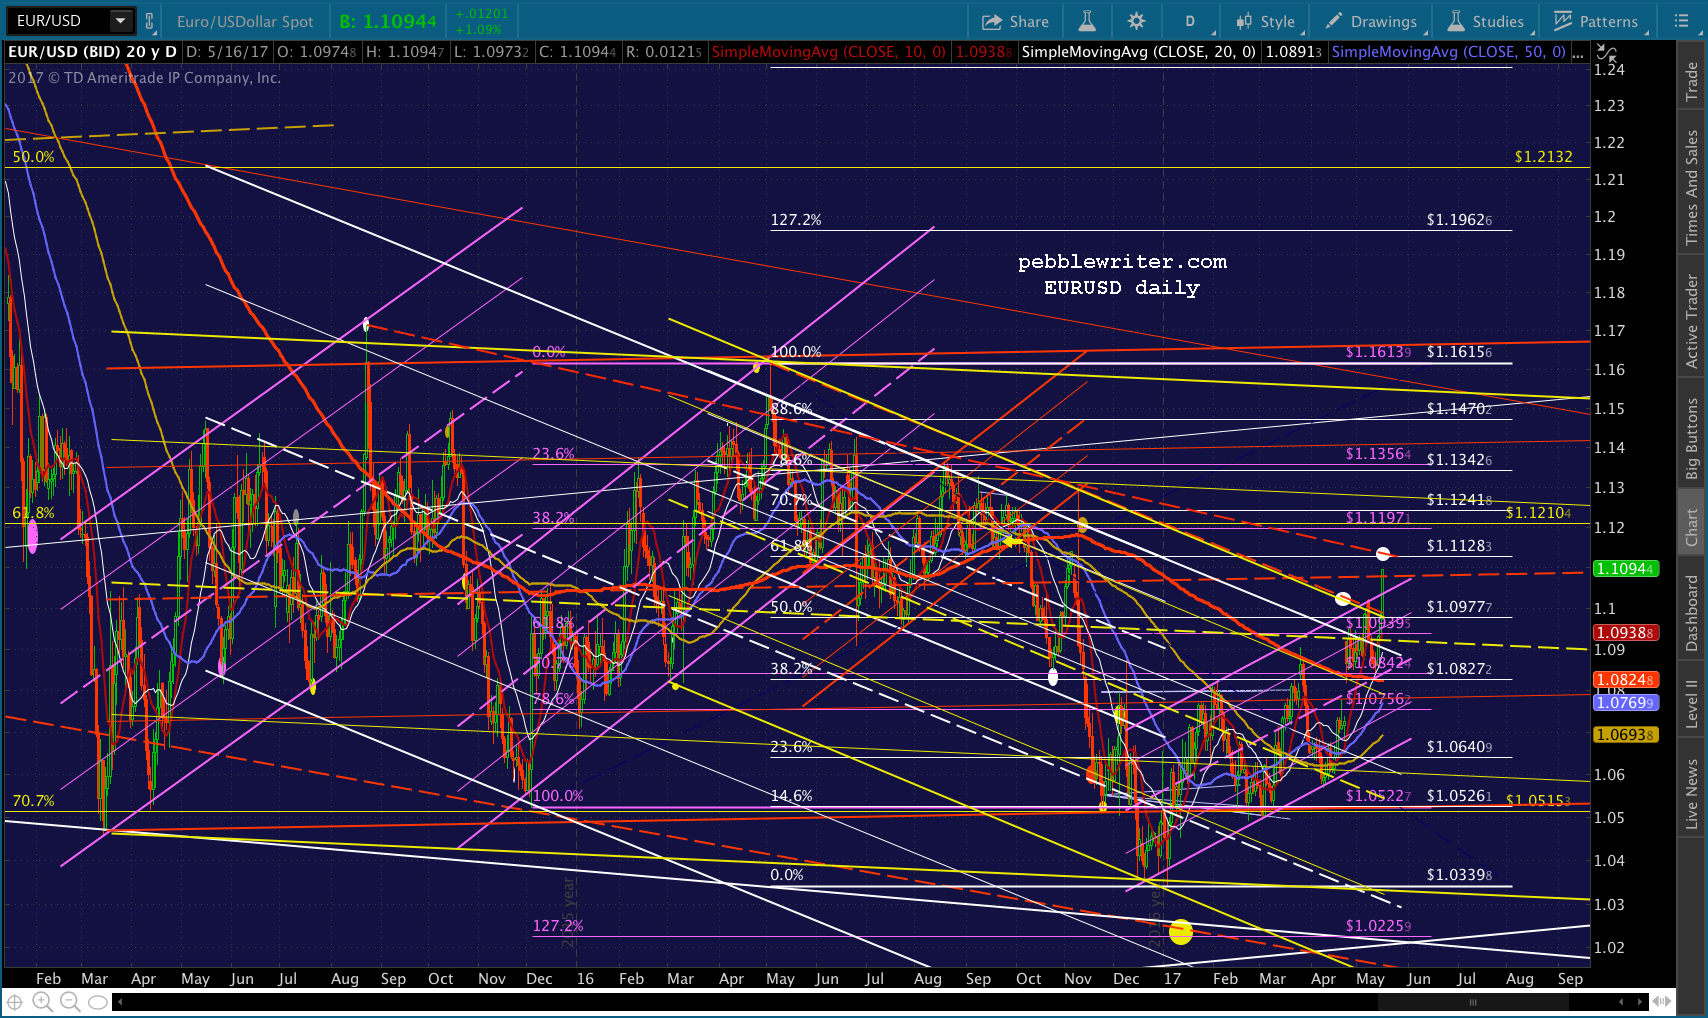 As it turned out, SPX required rallies in USDJPY and CL and a breakdown in VIX in order to maintain its post-election rally. Remember, oil had been largely responsible for SPX’s rally since our Feb 2016 bottom call.
I had expected CL to level off or drop in late 2016 in order to avoid troublesome YoY inflation data in early 2017. After reaching our 52-53 target on schedule, however, CL went sideways for several months (delivering troublesome inflation numbers after all) before breaking down.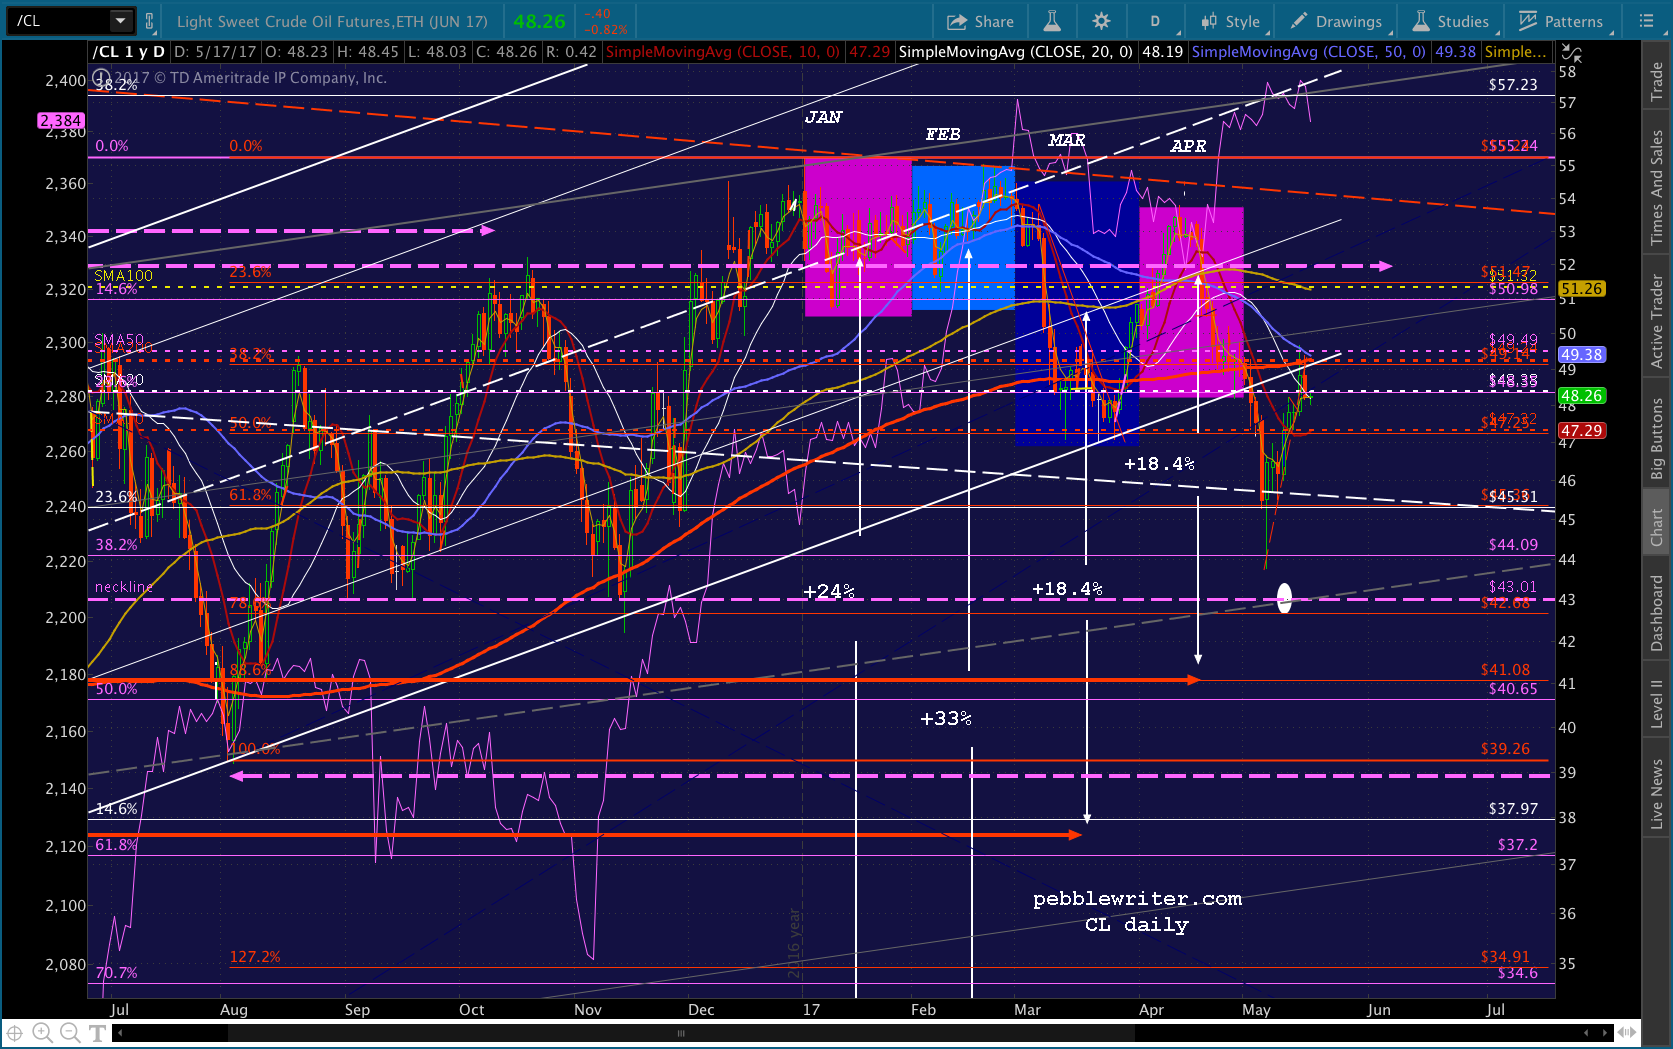 At the same time, DX and USDJPY slightly overshot our targets (the areas highlighted in blue, below.)
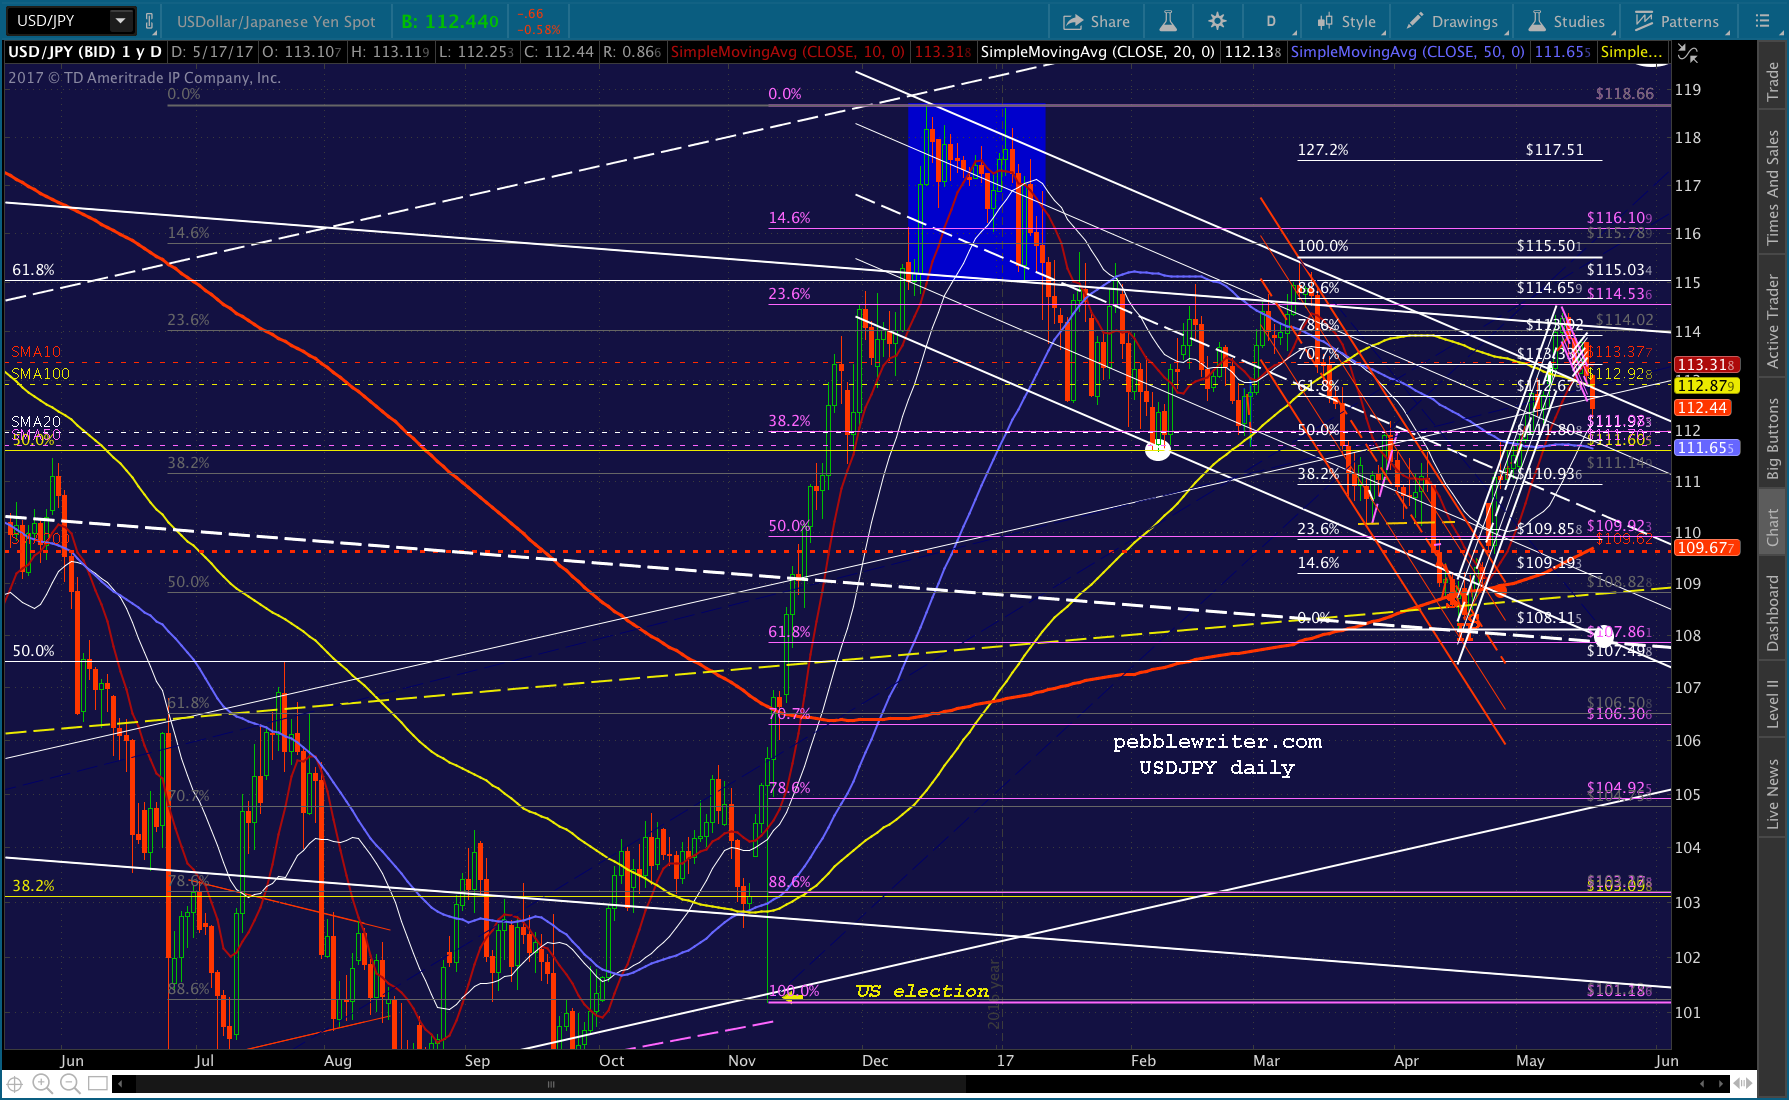
 In retrospect, this price action was necessary, as SPX was beginning to break down after rallying over 9% in the wake of the US election.
 The sudden dollar strength evidenced in both DX and USDJPY was enough to terminate EURUSD’s December pop. This was problematic, however. As we had discussed in November:
[EURUSD’s] white channel bottom has technically broken down and is, today, being backtested. I’ve had a target at 1.0225 around the end of the year for what seems like ages — ever since it became apparent that the .786 at .9898 was going to be averted with what turned out to be a long and large flag pattern…A drop [by EURUSD] through 1.05 could underscore the notion that the eurozone is failing — a notion that’s gathering momentum with each additional membership referendum.
EURUSD’s dip below 1.05 [highlighted in blue, below] was short-lived. It came very close to 1.0225 on Jan 3, but a big drop in oil had spooked equities. SPX had closed below its SMA10 and 20 the previous session. The last thing stocks needed was the euro melting down, too.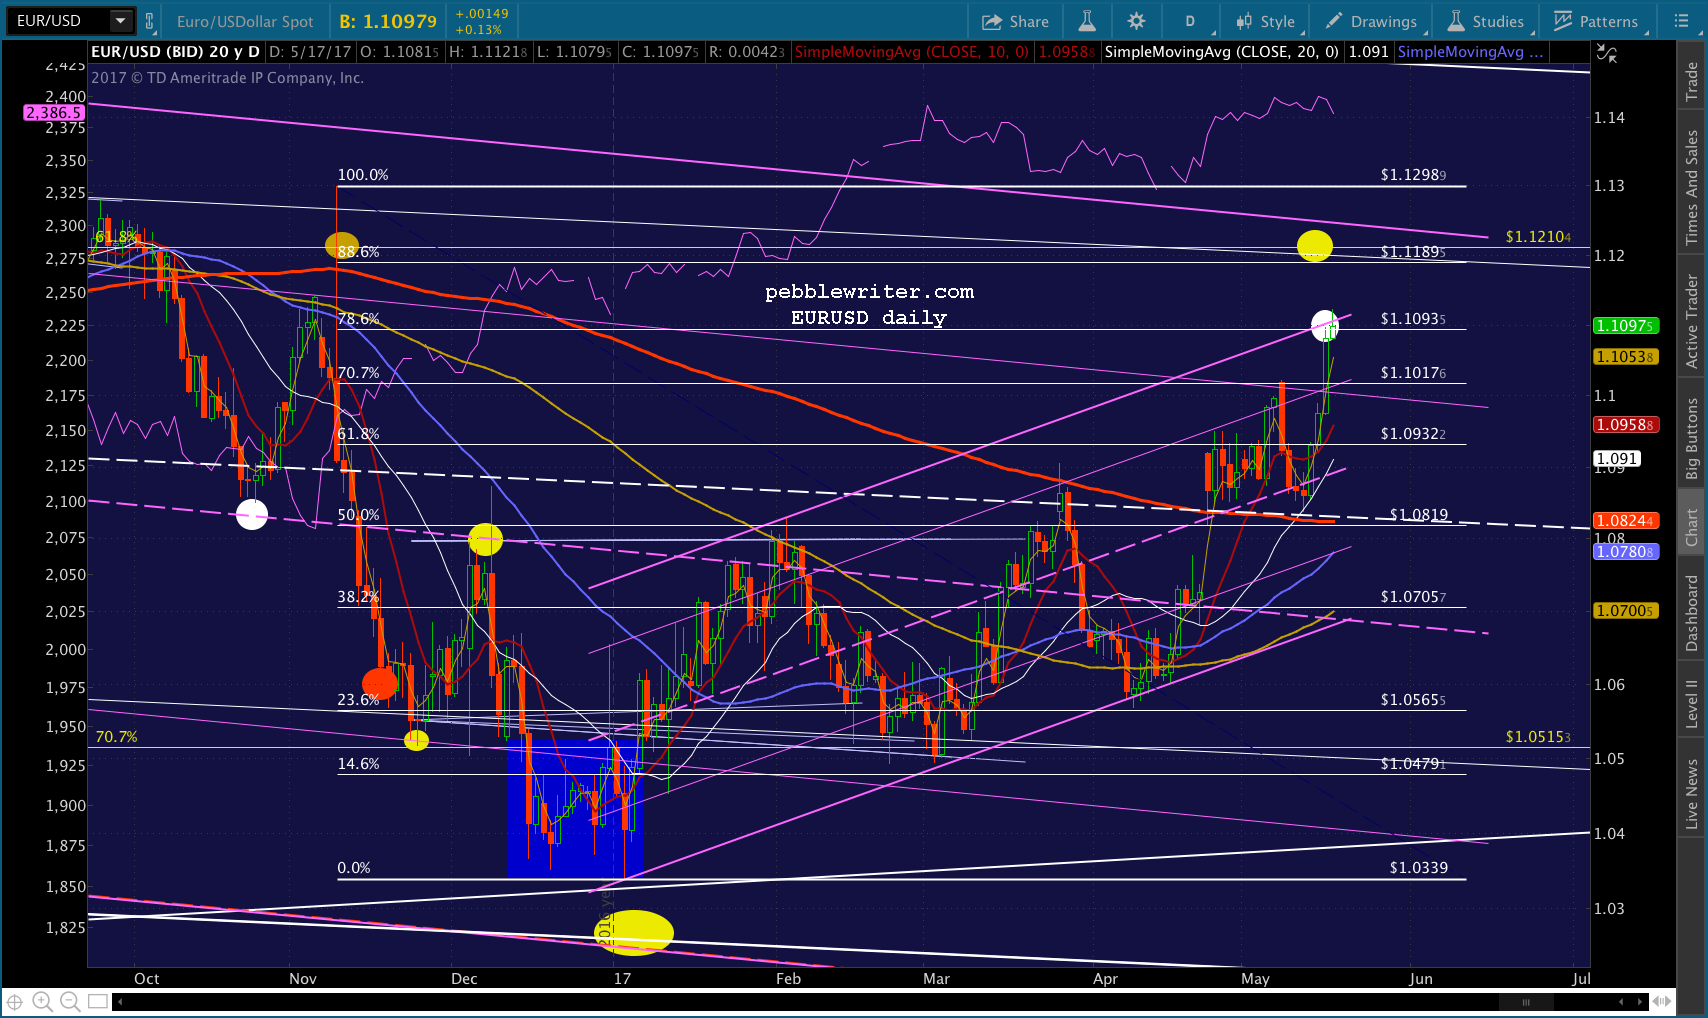 Since then, EURUSD has followed a nicely formed channel higher, reaching the .786 retracement of its decline from last November.
DX could fall further, however, with 97.583 and 96.789 being legitimate downside targets. If these come to pass, EURUSD is likely to pop up to the .886 at 1.1189 (yellow target), fleshing out a rising channel shown below in white.
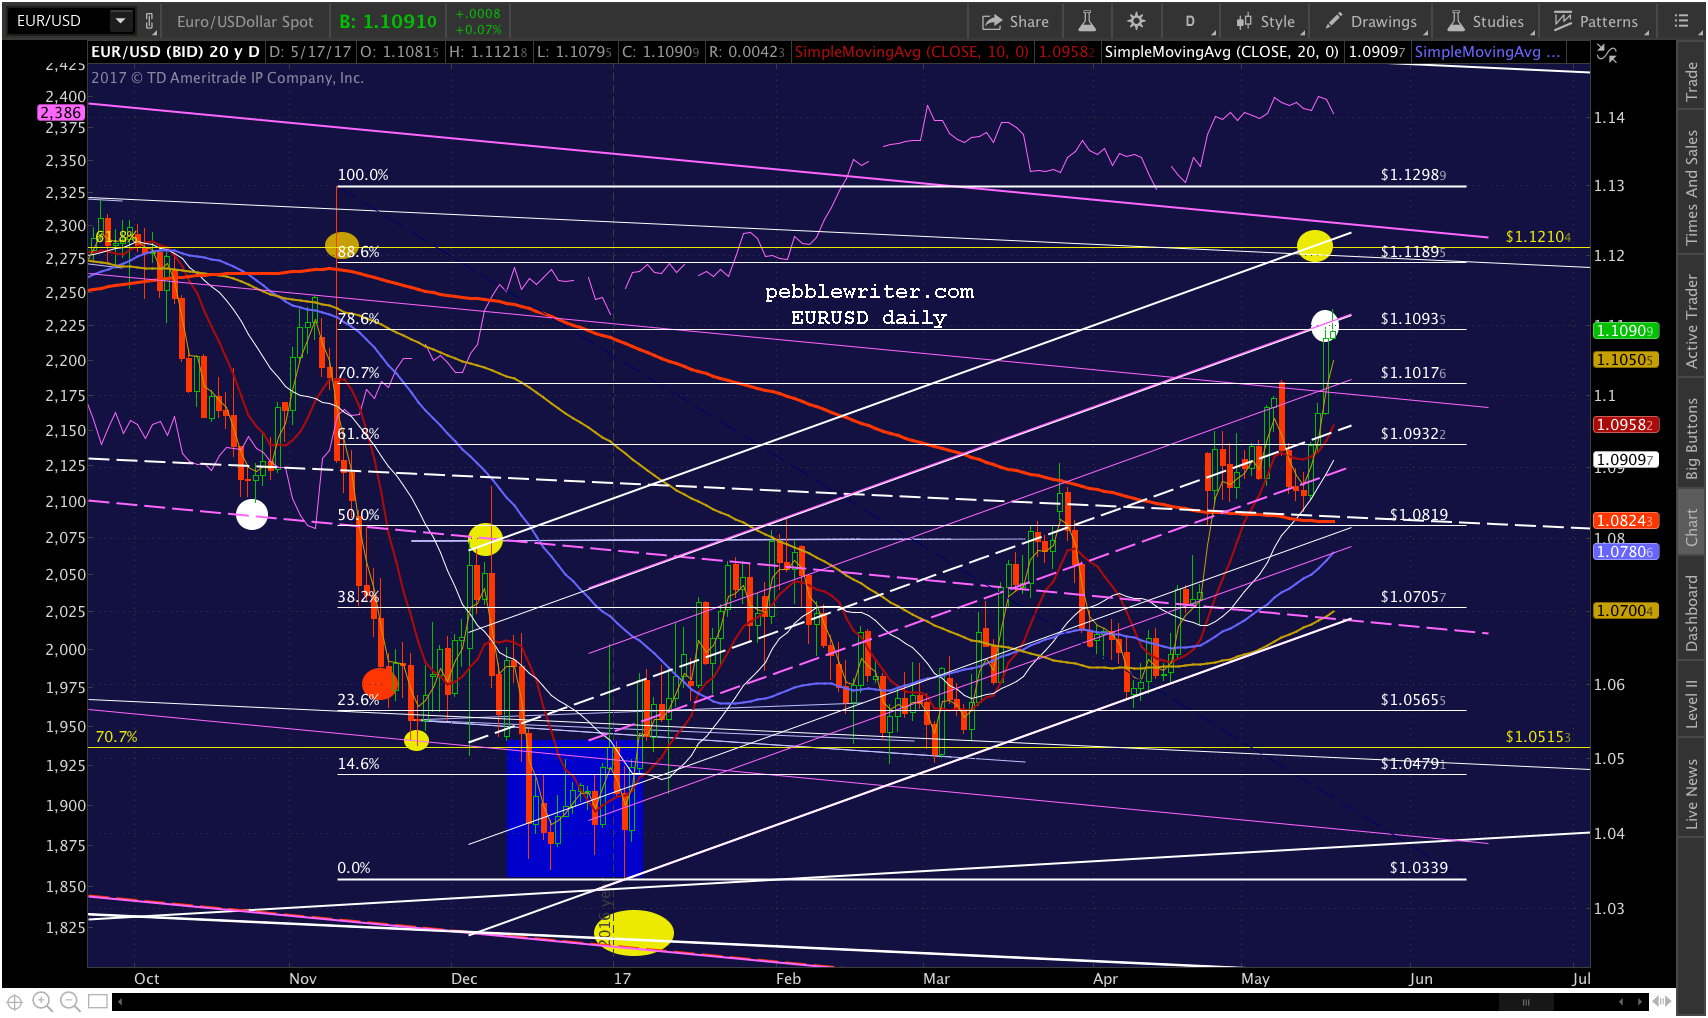 If, as I suspect, the FOMC punts on the next rate hike or two, we could even see EURUSD finally flesh out the top of the falling white channel shown below at 1.1470 or so.
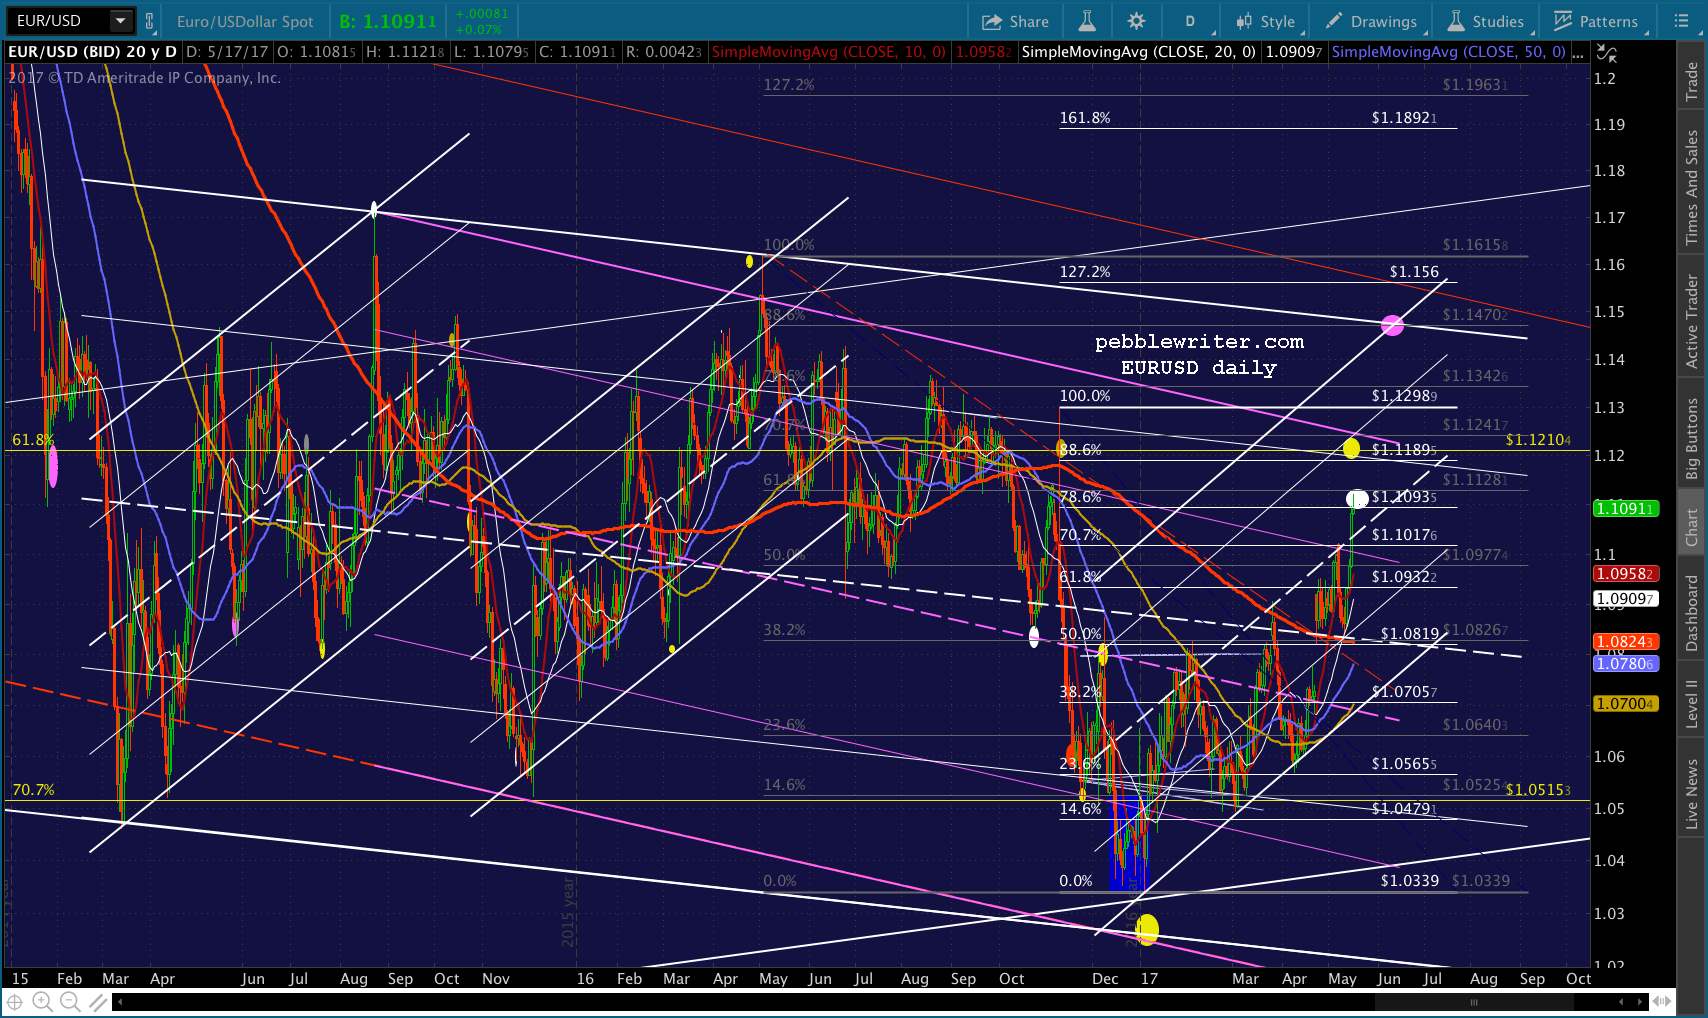 Using the gray Fib grid instead of the white, we can see that EURUSD is nearly to the .618 of its drop from 1.1615 to 1.0339. While this seems like a big move, it’s not — especially in light of DXY’s significant break down.
I don’t worry too much about the rising purple channel fleshing out. But, we could easily backtest the purple midline again after breaking below the purple TL for the first time since it was established in May 2014.
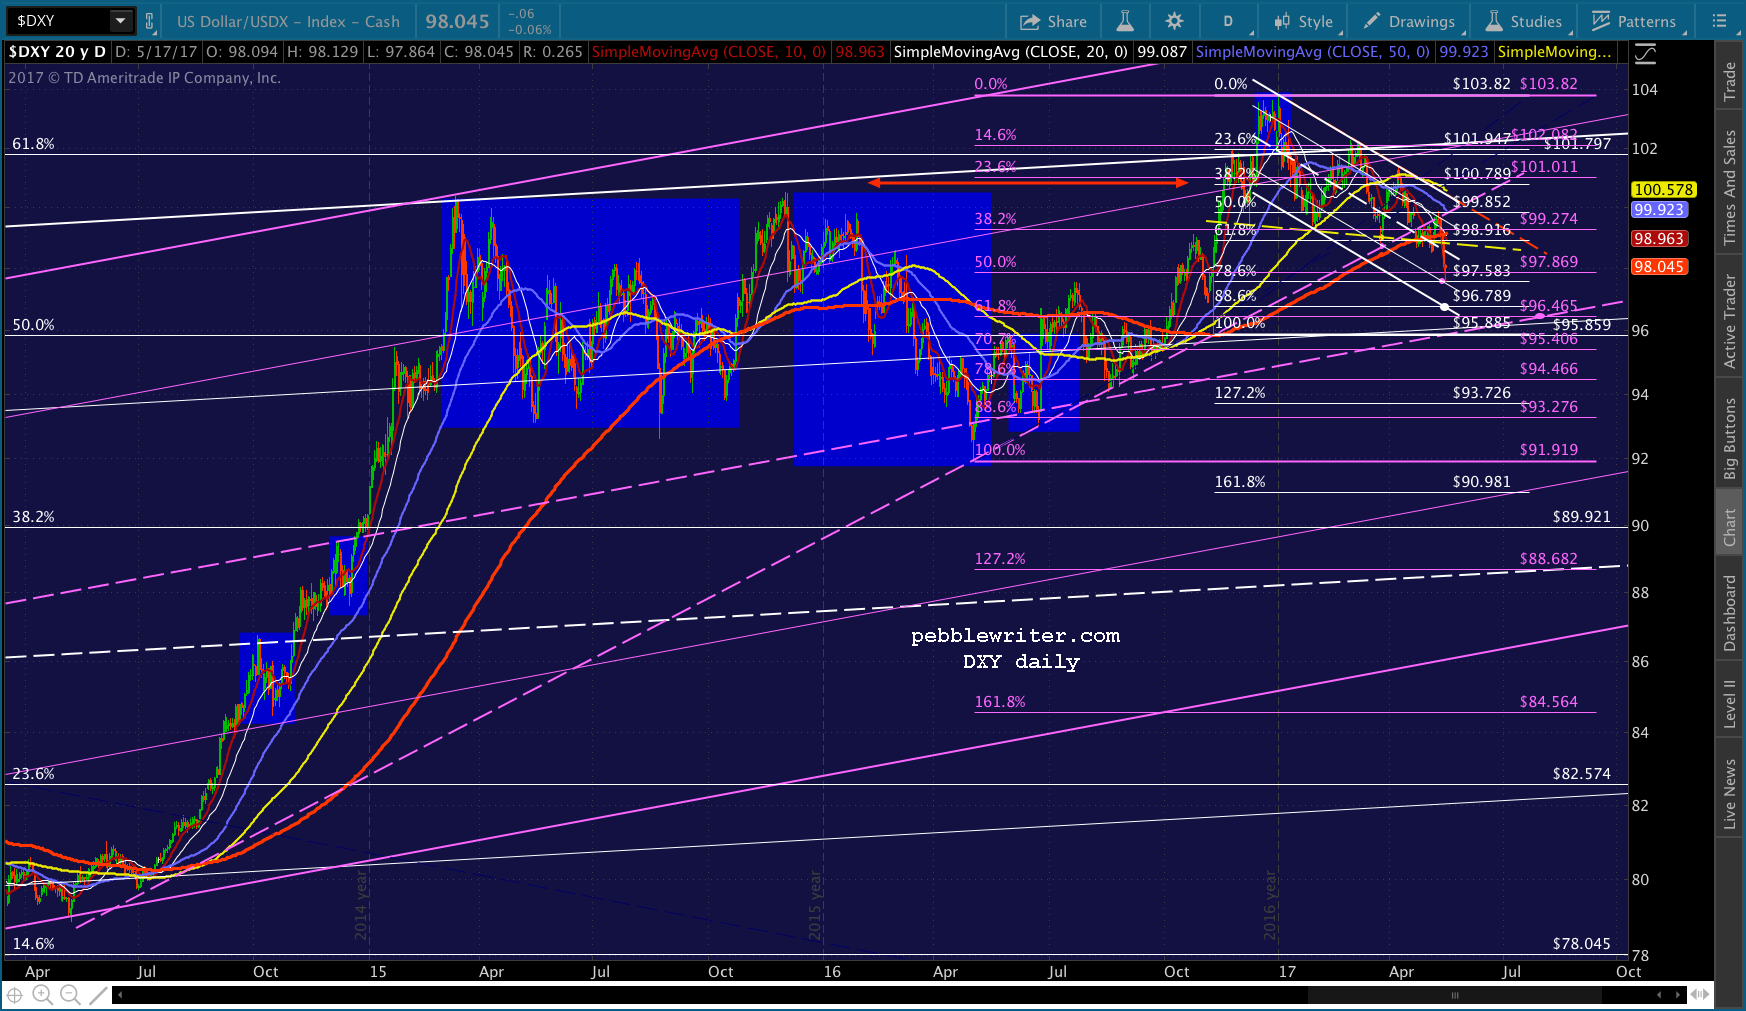 And, if the purple midline ever breaks down, maybe DXY could find its way back to the white channel midline. Of course, that would mean the eurozone is exhibiting much more strength than the US — which seems quite far-fetched at the moment.
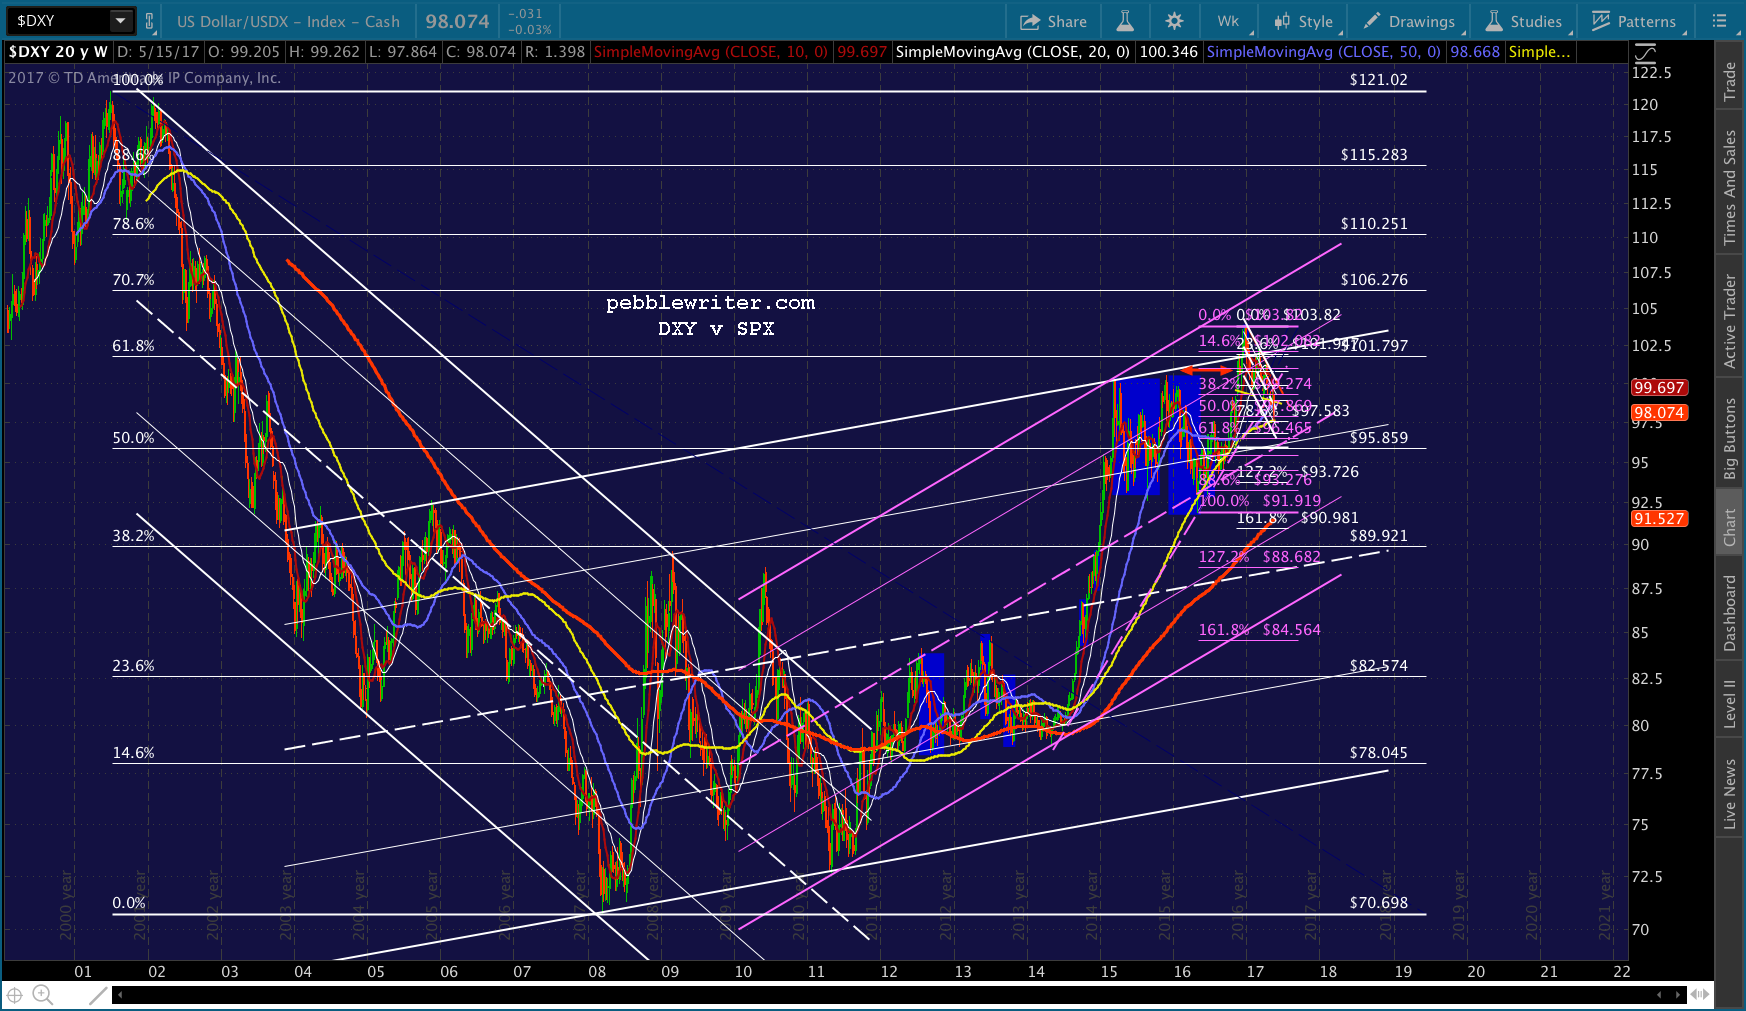 As is the case with so many charts I watch, EURUSD will soon be at an important inflection point: reverse sharply at 1.12 or break out to 1.1473. If it breaks down, the DXY chart suggests it could be temporary, with another push higher to 1.1473 only being delayed.
I find I like this scenario best. A drop to the .786 at 1.1093 around Jun 5 could provide a base for a thrust to 1.1473 by June 14 – the same day the next FOMC rate decision will be announced. If, as I suspect, there is no rate hike in June, the USD could easily give up that much ground.
If I’m wrong, EURUSD will test the white channel midline at 1.1093 and just keep going. By June 6, it could easily tag the SMA200 around 1.0824 or even the white channel bottom and SMA100 around 1.0740.
Will we see enough inflation to justify a rate hike? April CPI was 0.2% (0.1% core.) If WTI reverses sharply as expected around, PCE could easily turn in another negative print — taking all the wind out of the rate hike sails.
Stay tuned.
Comments
4 responses to “Update on EURUSD: May 16, 2017”
I did a silly thing and bought VXX yesterday morning. Closed it at 15.14 today. I’m so hopeful for a return to reality and VIX going much higher. But sanity prevails.
I will think about buying XIV tomorrow.
Thanks.
It happens to the best of us. I think the key for VIX will be whether or not it can hold the SMA200 it topped earlier this morning.
Are you still recommending holding XIV today?
This would be an interesting place to consider a new long, position. But, I posted yesterday that it had topped out at 82.55. The actual high ended up being 82.84 and it is now trading just below our initial entry at 77.28.