

In our last update on the Nikkei [see: Mar 23 Update] with NKD at 19190, we called for a 3% drop to support at 18631 and a subsequent 9% rise to 20286.
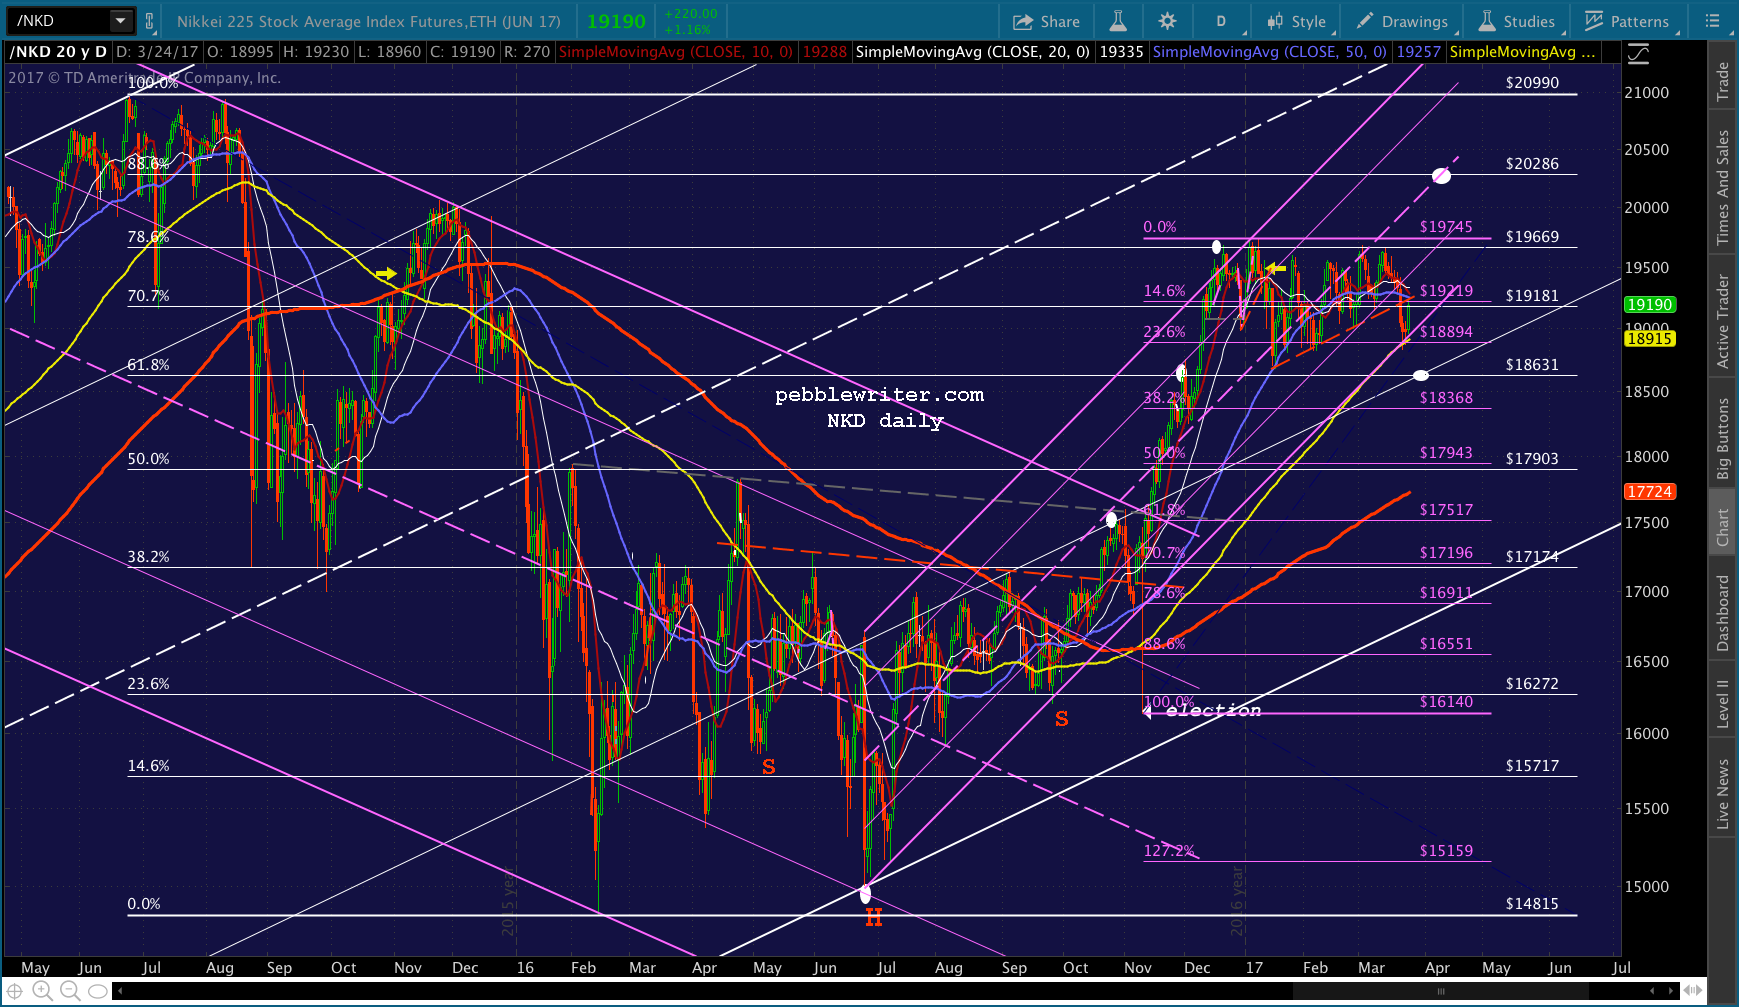 As it turned out, the drop was a little deeper than expected. But, the subsequent rebound nailed our upside target, reaching 20320 on Jun 20 and making a series of lower highs and lower lows since then.
 For years, I have found the Nikkei to be a great indicator of the extent to which central banks (in this case, the BoJ) will go to manage stock prices. It continues to offer very strong signals about what to expect, next, from equities in general.
continued for members…
First, an observation. Note that the correlation between NKD and SPX continues to be very strong. As one goes, so goes the other. NKD’s breakdown below TL support in March matched the first time since the US election that SPX experienced a 10/20 cross in SMAs.  This was a clear negative shift in trend that resulted in SPX dropping 40 points in a day. At the time, it was the biggest negative day since the election (the backtest on May 17 topped it.)
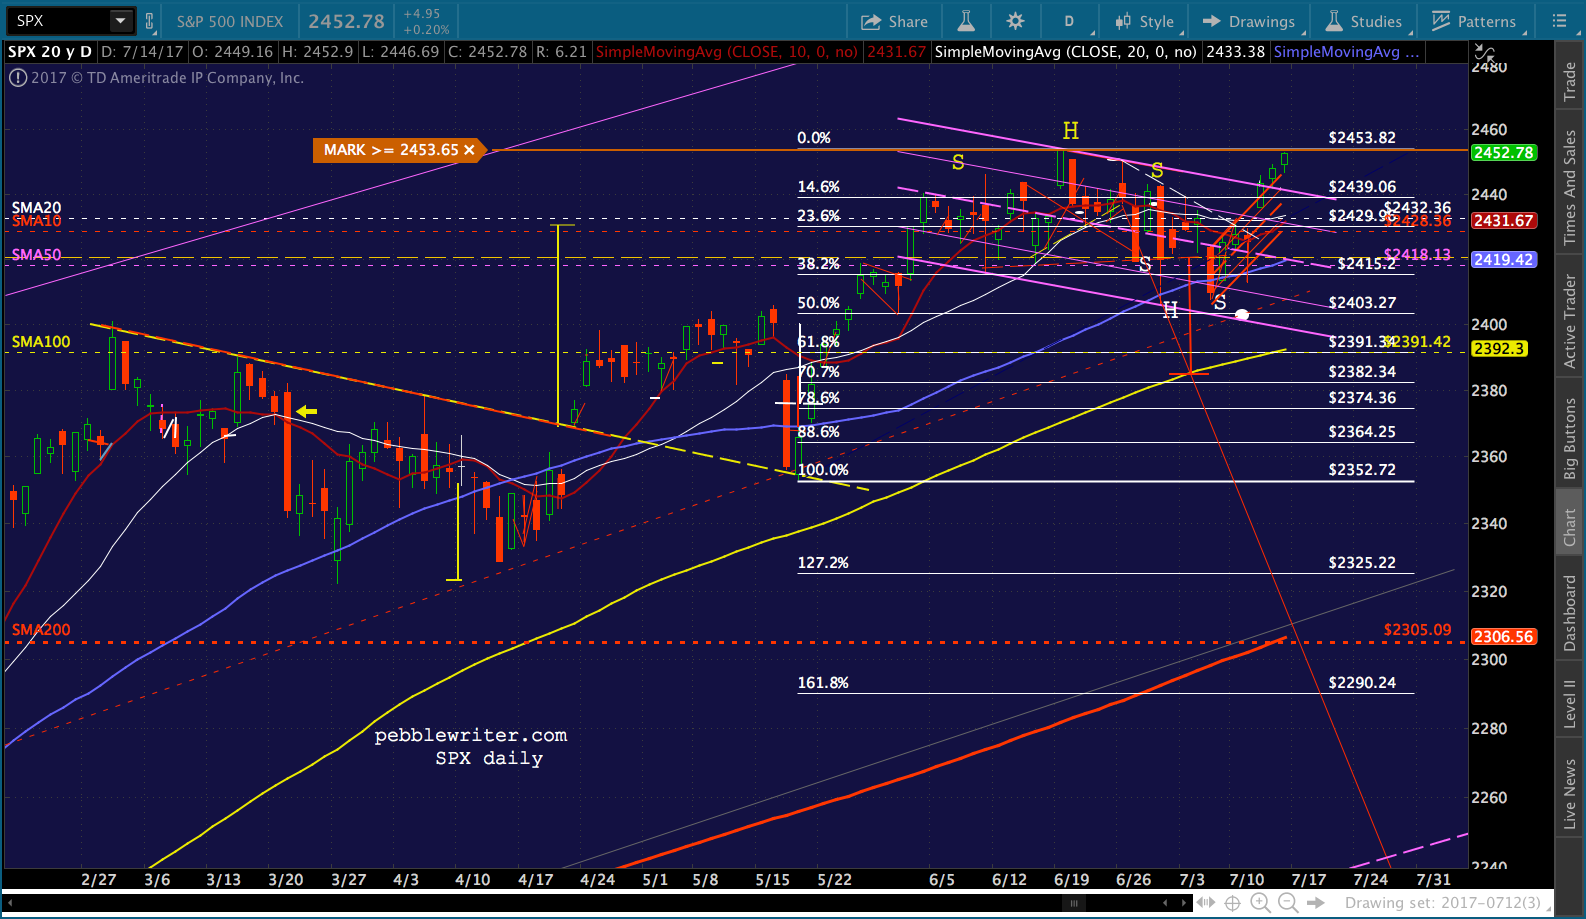 At SPX prepares to make a new all-time high, we have to take note that NKD has not yet pushed through its .886. Does this matter? Well, yes and no.
According to the harmonics gods, we should be looking at a Bat Pattern reversal which takes NKD down to at least the .618 Fib at 18698. The daily chart, in close-up:
There’s certainly been enough of a falter since the 20306 tag, and a clear enough falling channel, that we could make an argument for a pullback to the .786. The .618, however, woudl require that several channel lines be broken, not to mention the SMA200.
If there’s one thing the BoJ hates, it’s a drop through the SMA200. They wouldn’t even a allow a tag of it back in March when they decided that holding the 2007 highs was more important.
 So, I tend to think that the lurking around the .886 is motivated strictly by a desire to stay within striking distance of the Jun 2015 20990 highs. The yellow .886 was completely disregarded in Nov 2014, even though the .382 reversal should have set it up. Instead, we got a decent-sized reversal at the .786, which presumably sets up a Butterfly Pattern at the 1.272 or 1.618 extension.
Note that there’s a yellow 1.272 at 21459, just a stone’s throw above 20990. So, we’ll put a pin in it and see how determined they are to make new highs.
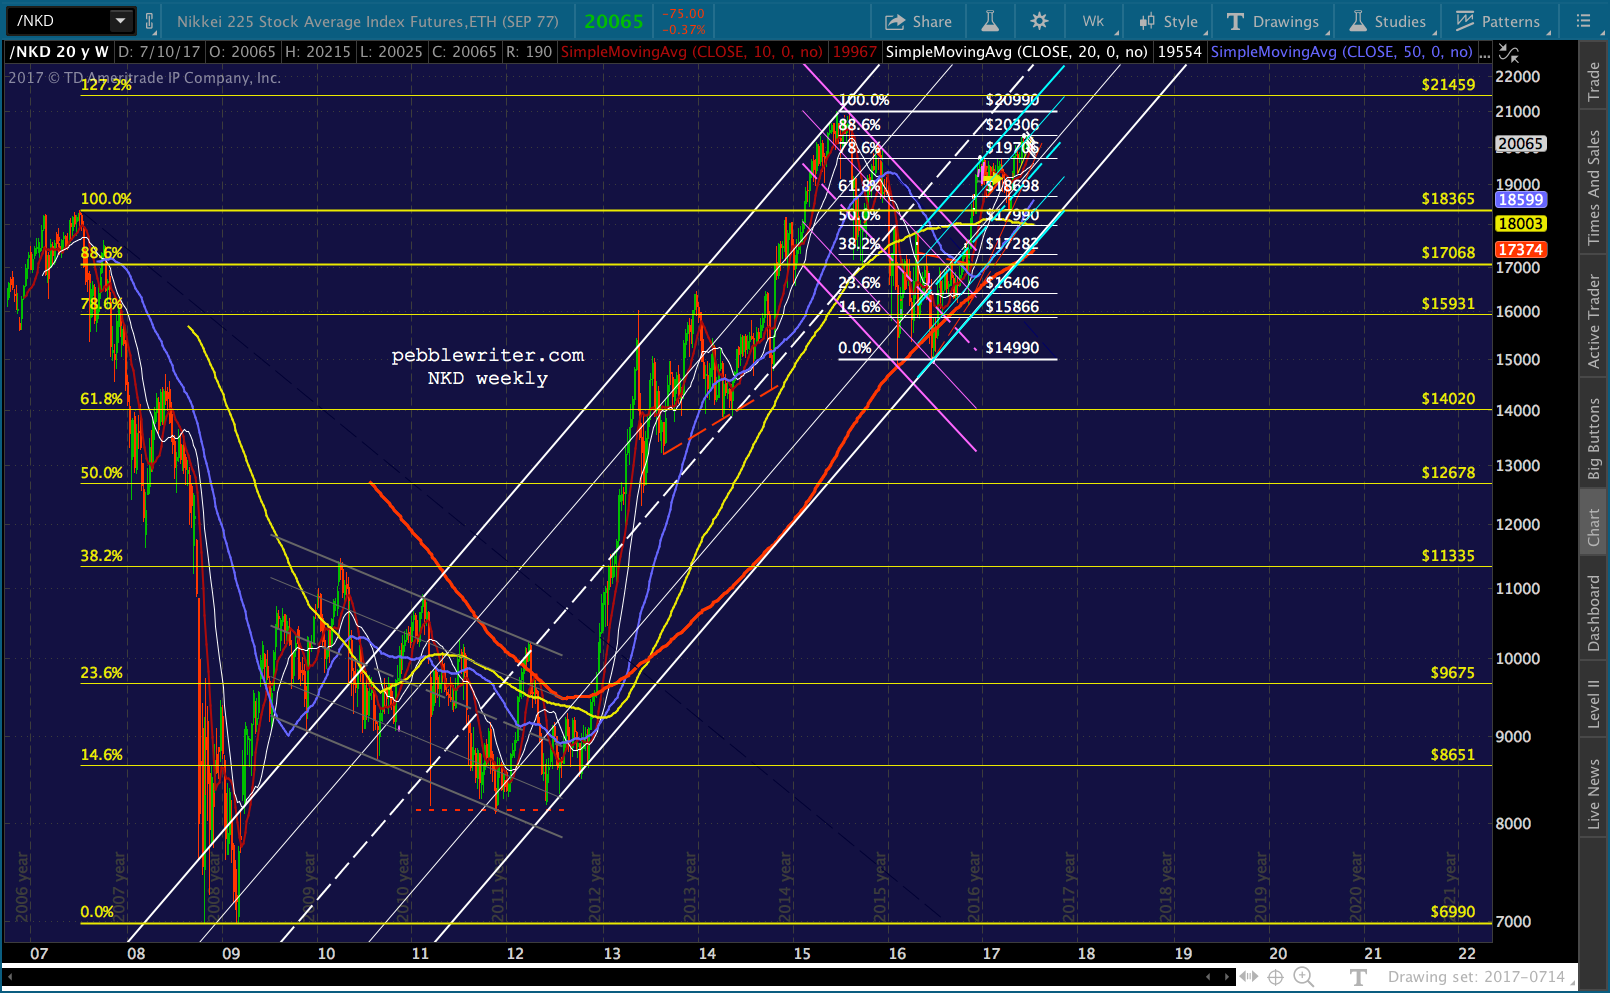 To sum up: 20306 is the critical line in the sand. If NKD can push above it, then 20990 and 21459 look pretty good. If not, the next support is at the SMA100 at 19539 and then the SMA200 at 18959. If that should fail, by some miracle, then the .618 at 18698 would finally be in play.
GLTA.