In our last update on the US dollar [see: Mar 27 Update] I noted that it had reached our previous target at an important Fib level and two important trend lines. The only thing it hadn’t tagged was the 200-day moving average, which would have meant dropping through all that other important support.
DX reached the yellow TL and the .618 Fib lines — arguably our most important downside targets. The one mystery is the SMA200, currently at 98.447. Note that DX reached it back on Nov 9 (aftermath of election day) and got a very sharp bounce.  I wouldn’t be surprised to see another such sharp plunge and recovery sometime in the next few days. Though, the bulls would probably rather it wait until the SMA200 has reached 98.901 so there aren’t any Fib-related mishaps. If so, that might not be for another few weeks.
It will come as no surprise to regular readers that the bulls got their way. DX bottomed that day, then bounced for several weeks until the SMA200 had finished climbing to that key Fib at 98.901. It tagged it on Apr 24 and has been going sideways ever since.  We’ve talked in the past about how the Fed has a love-hate relationship with the dollar. As a net importer, the US needs a strong dollar in order to avoid inflation. And, a strong dollar usually supports strong stock prices.
By offering yields that are much higher than Japan and the eurozone, it hasn’t been all that difficult to attract capital. And, that’s where the “hate” side of the equation comes in. The US needs higher interest rates like a fish needs a bicycle. If it can’t balance its budget with the 10-yr at 2%, how in the world will it manage at 3-6%?
 It must have unnerved the FOMC when the dollar slipped lower following the Mar 15 rate increase. Plenty of jawboning later, they got their bounce on Mar 27. But, we’re right back at those lows — meaning investors don’t especially believe the FOMC’s narrative regarding additional hikes this year.
We’ll take a look at what the charts say. For the past several years, they’ve been much more accurate than all those Fed press conferences put together.
continued for members…
Remember, when it comes to the dollar (and, just about everything else) it’s all about keeping stocks on the rise.  Since the yen carry trade took off in 2011, a rising dollar has been instrumental to higher stocks prices. The only exception was when rising oil prices took over from Feb-Jul 2016.
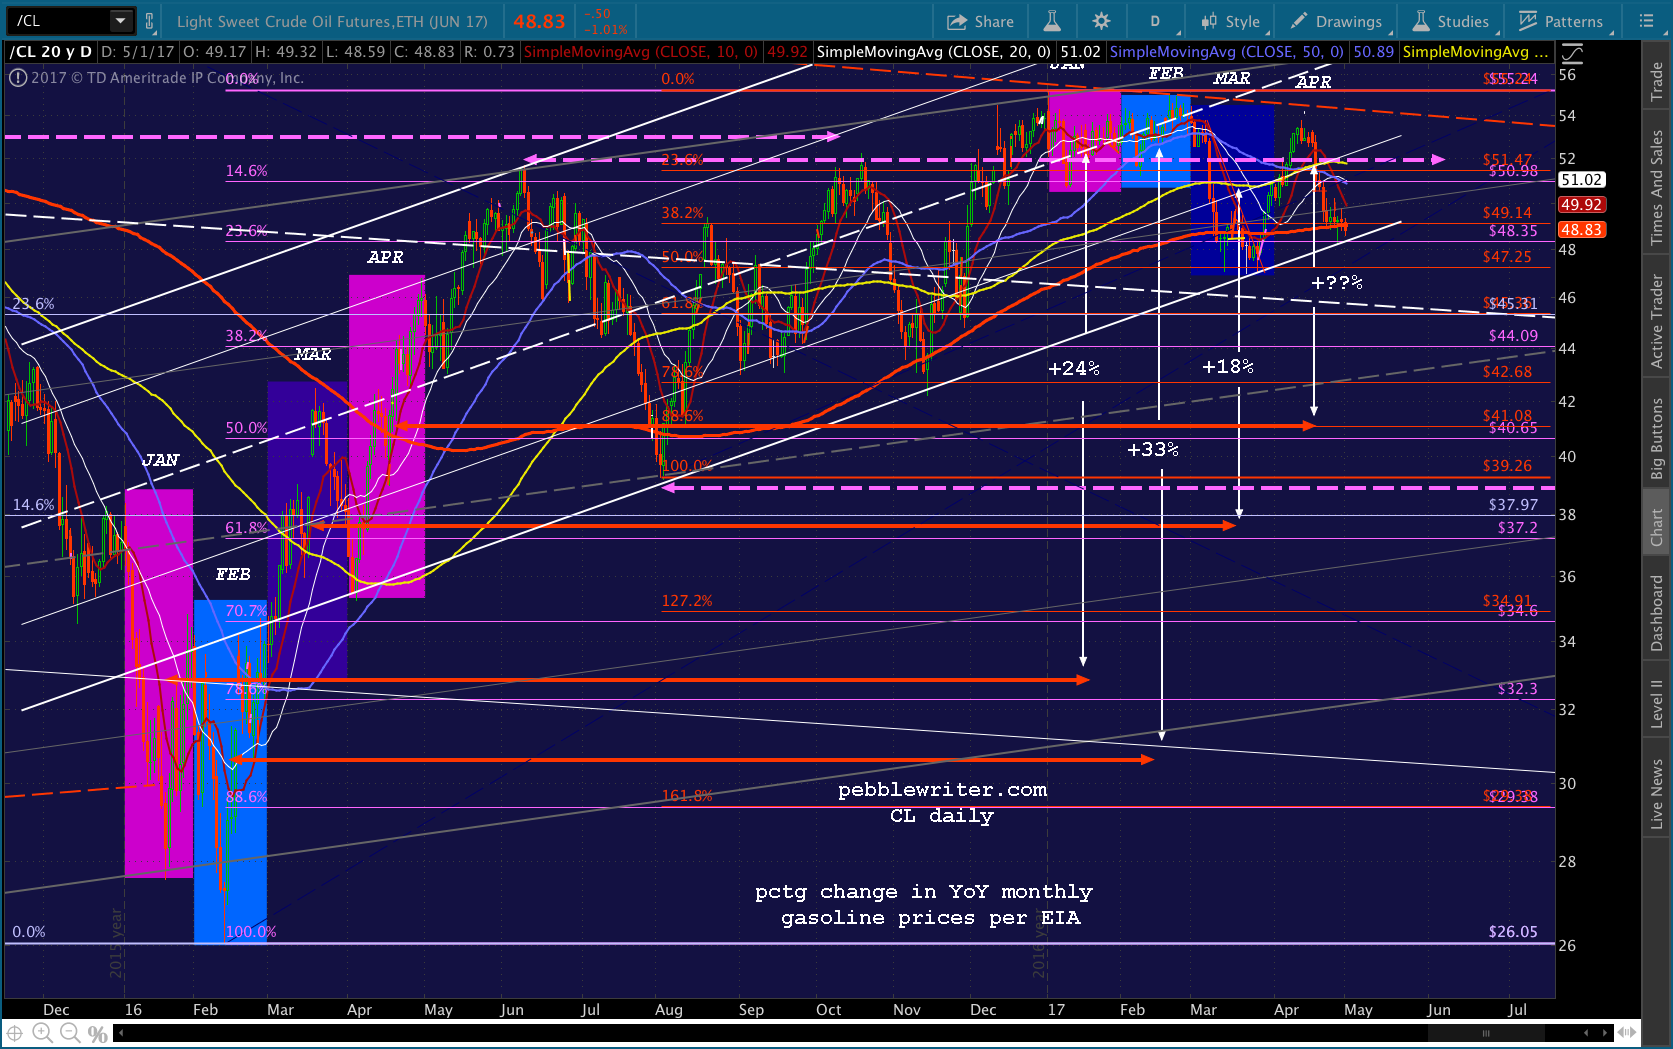
Looking at the daily chart, we can see several periods where DX floundered, and stocks suffered as a result. Here’s a closeup, with the bulk of CL’s rally (from 26 to 52) marked with the red arrow.
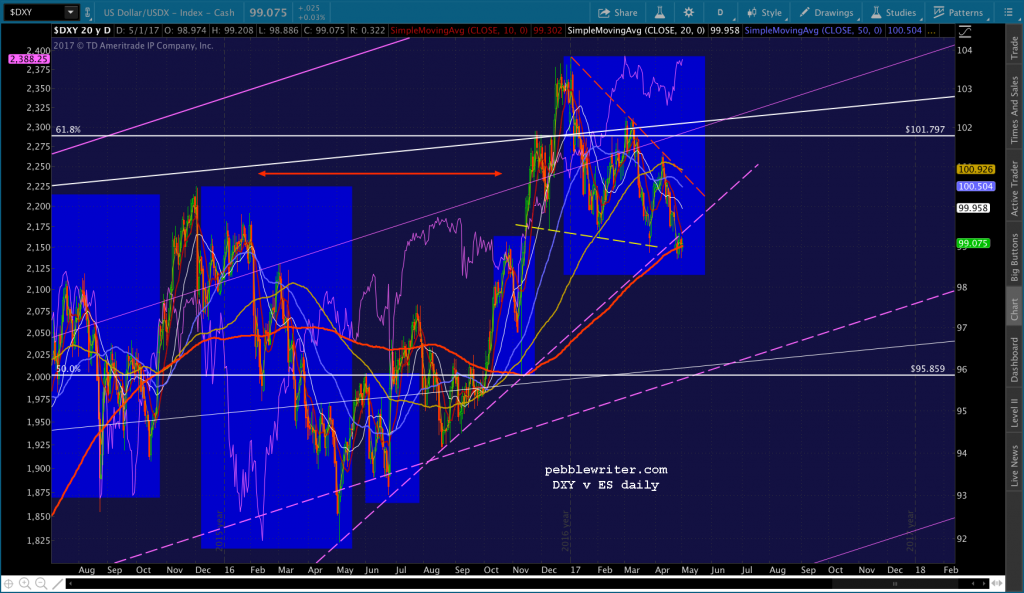 Note that DXY has clearly broken the purple TL — though it has been able to hold the SMA200 (more or less.) With CL having reached TL support on Apr 27, it seemed like it might be taking over for DX and USDJPY again — especially since it rebounded above its SMA200 over the next two days.
But, CL is currently trading below its SMA200, which casts considerable doubt on DXY’s plans. As we’ve discussed many times, higher oil prices have real consequences: higher inflation, which leads to rate increases (or, at least expectations of them) and thus an even more unbalanced budget.
For the past few months, CL has bounced back and forth in an effort to prop up stocks without generating too-high inflation. Then, there’s the corollary: too low inflation, which would knock DXY back. When DXY broke below the rising purple TL, stocks were propped up by VIX — which just today dipped into single digits at 9.9. It hasn’t been lower since 2007 when it reached 9.39. The all-time low is 9.31 from 1993.
So, it would seem that VIX is running out of room to the downside, unless TPTB are going to try to convince investors that risks have never been lower — perhaps a tough sell with valuations near all-time highs.
 This brings us back to DXY. It should continue sideways for quite a while, bouncing just enough to keep stocks level while CL deflates as necessary, and dropping back down to the yellow TL whenever CL is bouncing. VIX would be the equalizer and fill in the gaps when the algos are too confused to buy — just like today.
 Of course, if DXY drops through the SMA200 and the yellow TL, then we have some very obvious Fib targets including the .786 at 97.583, the .886 at 96.789 and the purple .618 where it intersects the purple channel midline at 96.465 in July or August.
If the purple midline breaks down, the next major support isn’t until 91 in early September and 87-88 as early as the end of the year.
Regardless of which way it goes, the upcoming Fed presidents’ speeches, in the wake of this week’s meeting, should make for very interesting exercises in obfuscation.
Stay tuned.