

Just last week, we reiterated how VIX has evolved from a reliable indicator of market risk to a tool with which stock prices are being supported [see: How Broken is the Market?] Since December, tags on the bottom of the long-term yellow channel above have increased in frequency from once a year to about once every four sessions.
As if on cue, VIX’s actions yesterday should put any lingering doubts to rest. It was hammered to single digits, lower than it has been since Feb 2007 and a scant 0.59 from its all-time lows set on Dec 22, 1993. To be clear, VIX did not fall to 9.9 because investors looked at the investing landscape and decided that downside protection was unnecessary. It was driven to new lows specifically to support stocks when they were in danger of losing momentum.
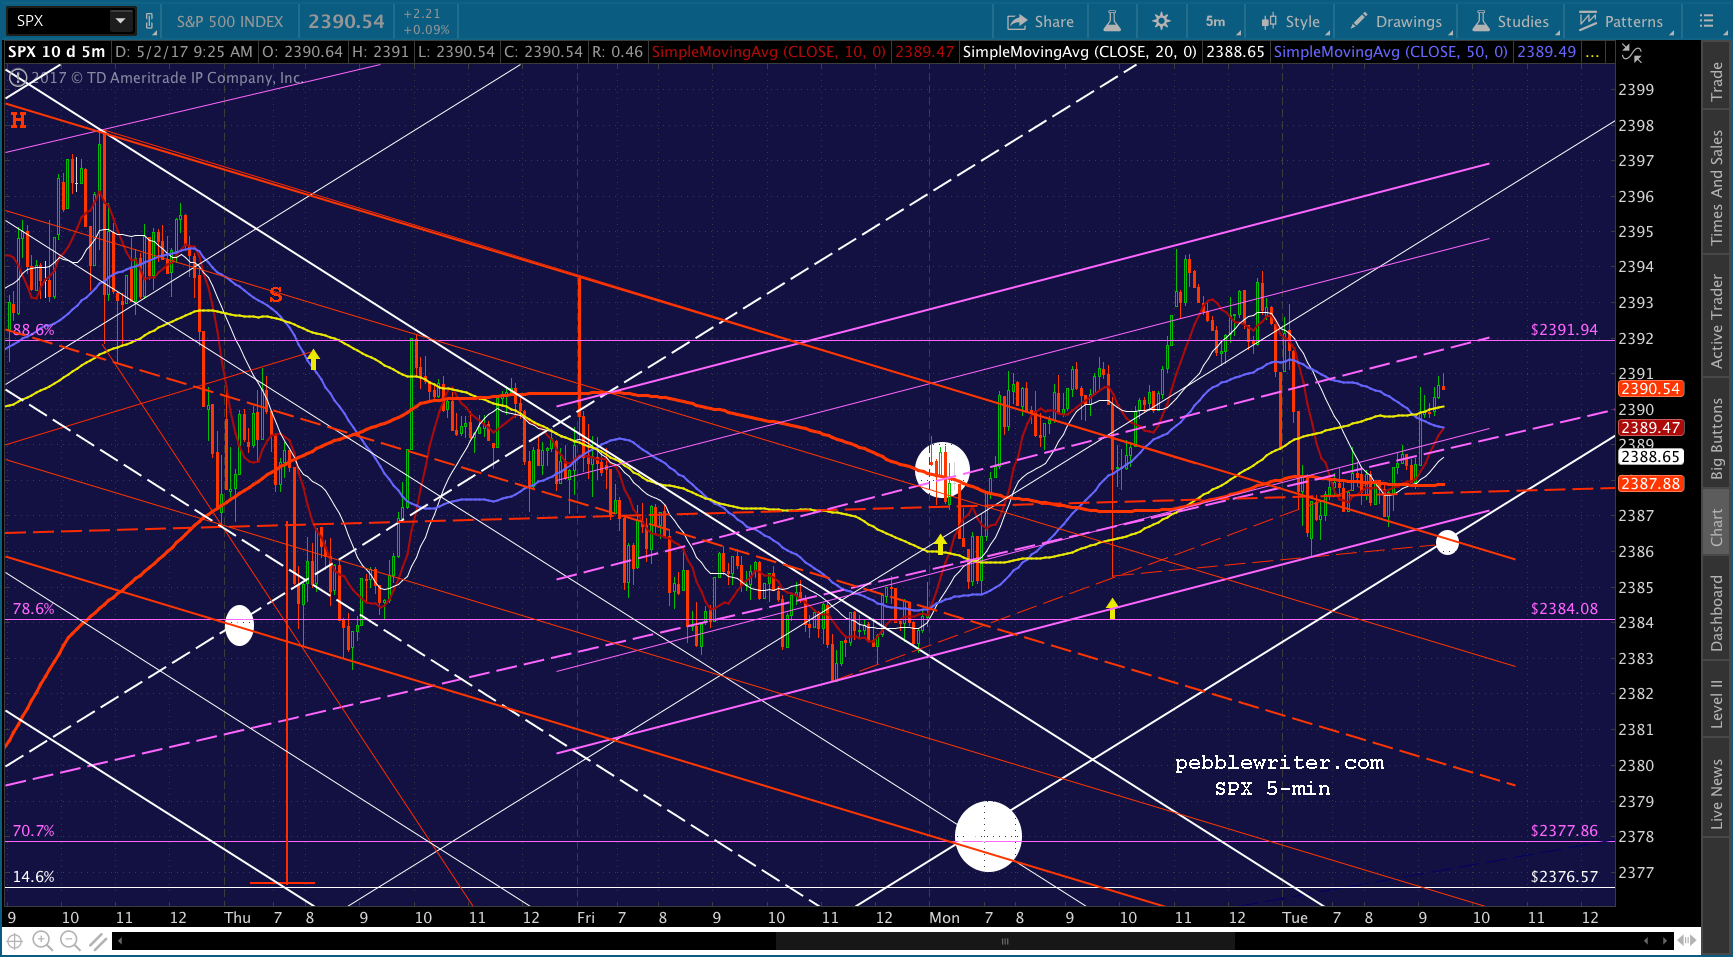
The two critical moments were at the open, when SPX was in danger of repeating its pop and drop from last Friday — and, around 1pm — when SPX was losing momentum and had dropped back into a falling channel.
They are marked with yellow arrows on the 5-min SPX chart below.
 Note that VIX had already dropped 37% in the past week in order to help SPX break out. It sat near its Feb lows five sessions in a row, dancing about the .886 retracement of its rise from those lows.
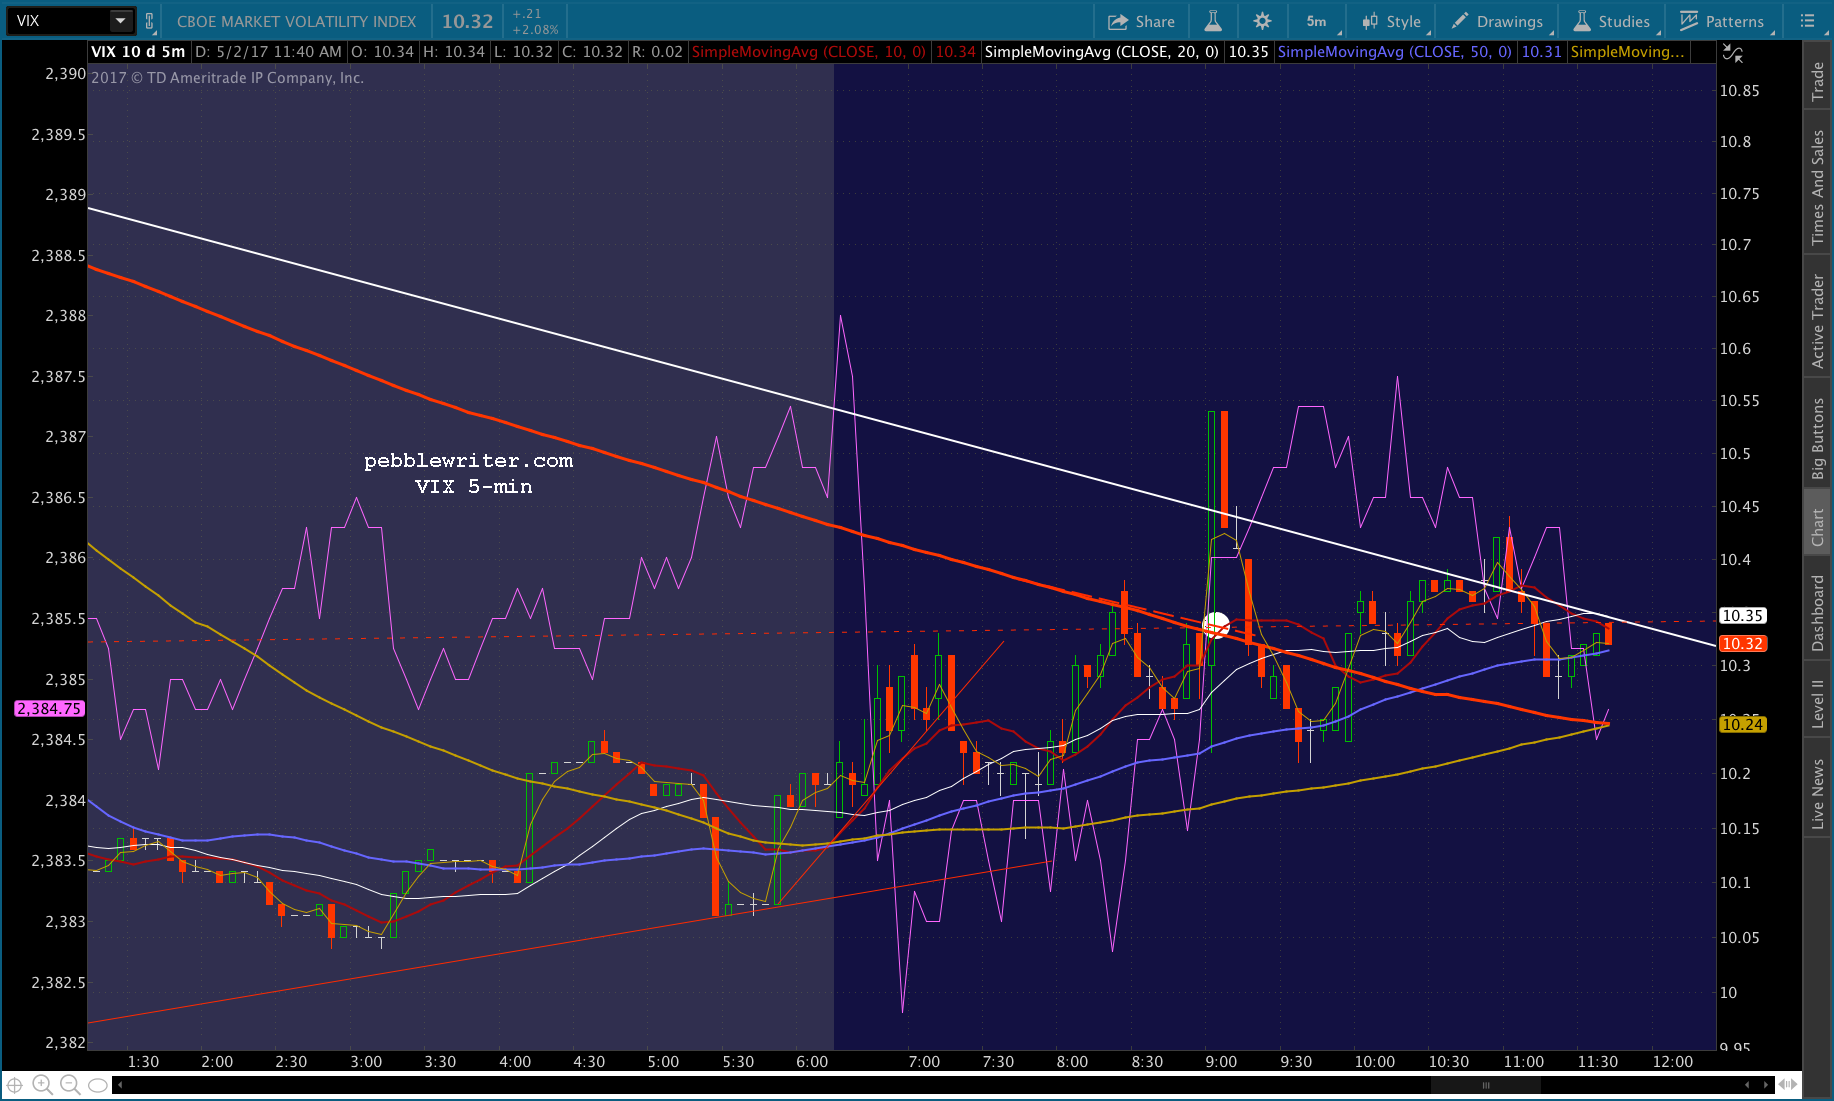
 Yesterday, as ES began to break down from its overnight momentum (purple arrow), VIX suddenly plunged .45 within seconds. I call this a “shot across the bow.” It’s designed to scare off bears, and it usually works.
SPX was in danger of dropping back through the neckline of a nice little H&S Pattern that targeted 2376. And, VIX’s action held it above the neckline for about 30 minutes.
At 10AM, however, SPX began to fall below the neckline again. So, VIX began dropping again, eventually falling below the dotted red TL (which connected last week’s lows) when SPX suddenly plunged all of 5-points at 12:50PM.
Instead of falling to flesh out the white, or even red channels, SPX broke out again and even topped its .886 Fib for two hours before closing unchanged on the day.
 Is it a problem that central banks and their allies can manipulate stocks lower at will by shorting VIX? Should it bother us that rallies can be ordered up like a burger and fries at a fast food joint?
I could make a pretty good argument for the importance of market integrity. But, that ship has already sailed, as detailed last week in How Broken is the Market? Instead, I’ll remind investors and traders alike that every previous effort to prop up stocks long after the underlying economic reality argued for a correction has failed. Every. Single. One.
I see no reason why this one should be any different.
continued for members…
I expect SPX to finish backtesting the red channel it spent 4 days in, probably just a tad below the SMA5 200 at 2387.76. The red neckline is at about 2387.50. There’s not really any value in shorting it unless it drops through this support. So, consider me officially short until then — just in case. UPDATE: 9:47 AM
There’s the neckline and SMA5 200. If it’s going to reverse, we should see VIX pull back here. I don’t see it just yet, and USDJPY and CL are still falling — though approaching support. But, I’d be surprised if SPX is allowed to drop through this support it worked so hard to get back above. Back to long with relatively tight stops. We’ll see what happens when 10AM rolls around. It’s often when the initial support fades…


 UPDATE: 9:58 AM
I just saw Trump’s tweet from earlier this morning about the country needing a “good shutdown to fix [this] mess.” In any case, SPX is slipping again, and USDJPY and CL and VIX haven’t found their reversal points just yet.
Although I doubt it’ll go anywhere, I’m inclined to revert to short here as 10AM is coming up. The white channel bottom is around 2384, also the purple .786. It would probably be very short-lived, as USDJPY is about to reach its SMA5 200 at 112.02 and VIX the red TL. CL doesn’t need support to start bouncing.  UPDATE: 7:06 AM
 UPDATE: 10:21 AM
SPX is about to backtest its SMA5 200. But, VIX just broke down below a little TL it has built this morning — signalling it’s had enough of this floundering. The problem is CL, which continues to slide even after completing a Gartley Pattern earlier at the .786. If SPX pushes back above the SMA5 200 at 2388, it’s time to revert to long.


 UPDATE: 11:06 AM
Guess having a 4 point loss on the day was too traumatizing. If the white channel bottom gets tagged, it’ll probably be around 12:20PM when VIX actually backtests the red TL and the SMA5 200. Again, the litmus test is the SMA5 200 at 2387.88. Back above it means long — though the head fakes probably aren’t done.

 UPDATE: 12:28 PM
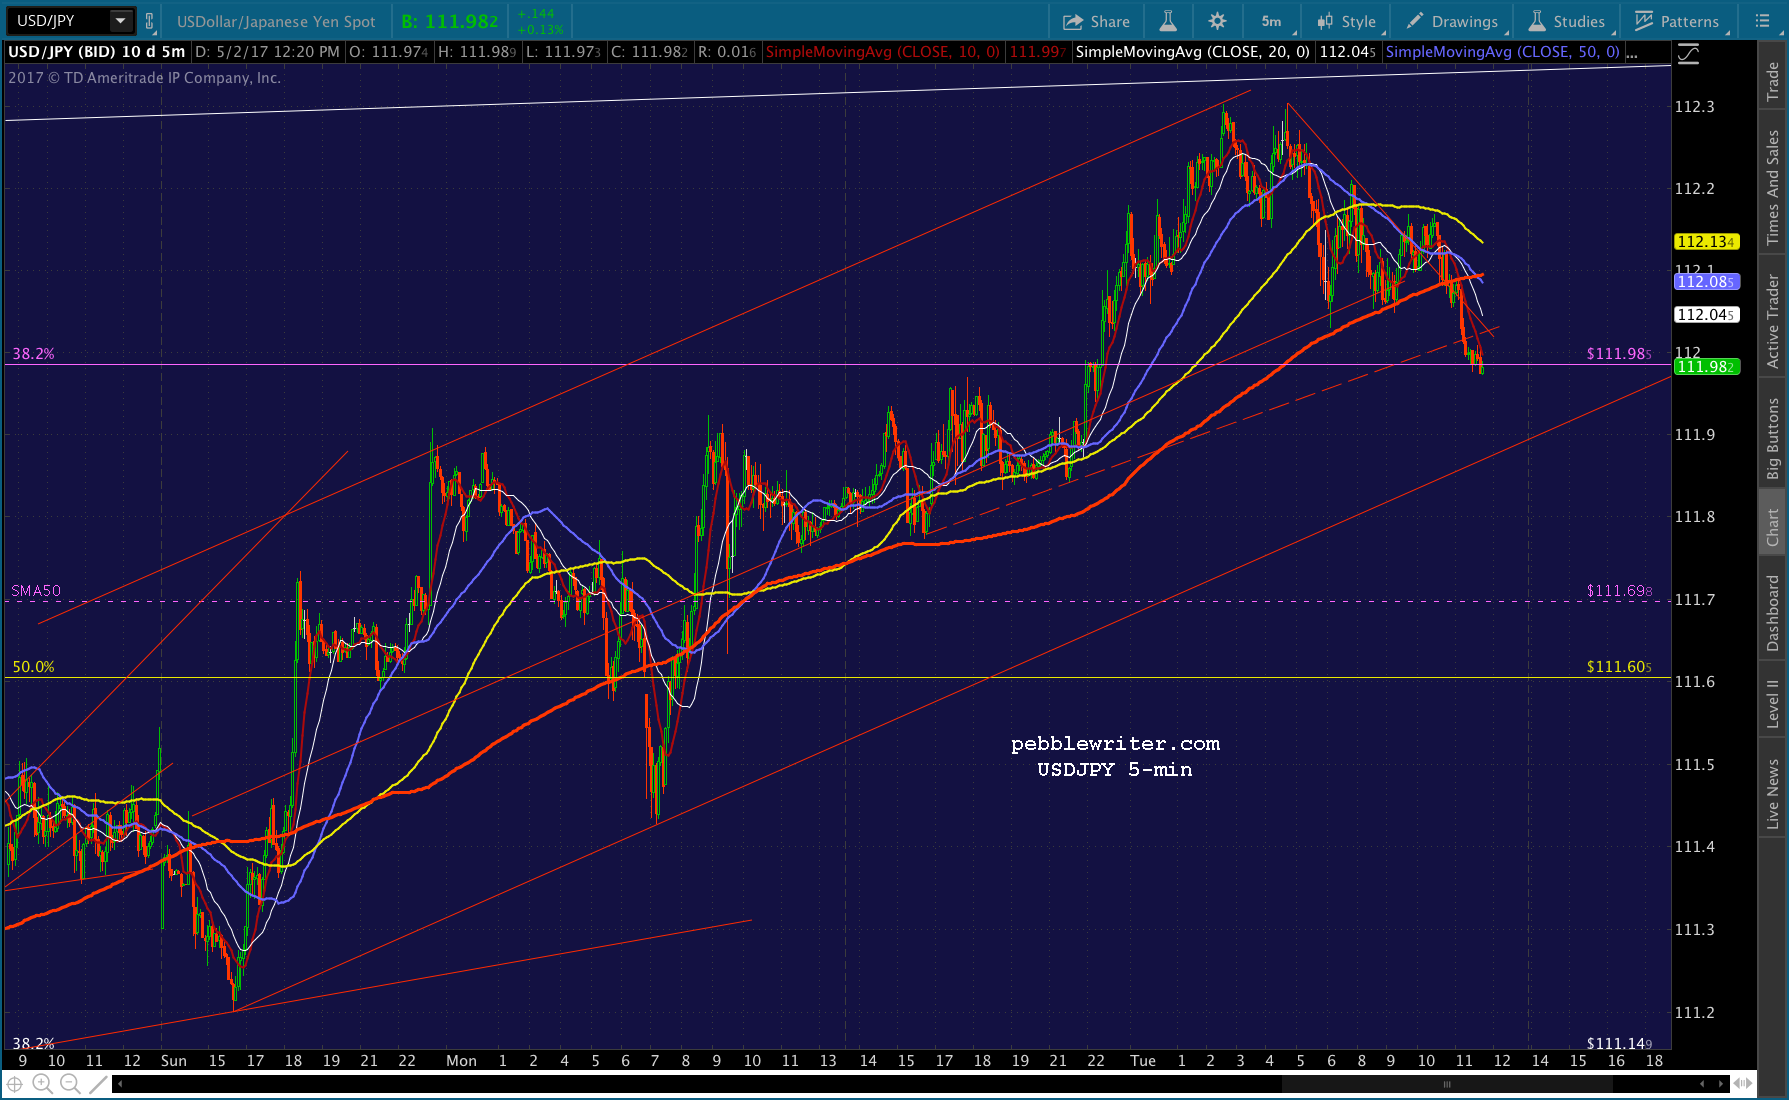
SPX tried to get back down to the white channel bottom, but got pushed up above the SMA5 100 by VIX’s momentary reversal at the SMA5 200. VIX popped back up above the SMA5 200 and TL, but it might be too late. SPX still has a slight chance of getting back to 2386, but the odds are quickly diminishing. VIX is starting to slip back beneath support, CL has reached its .886, and USDJPY has reached its SMA5 200.


 UPDATE: 12:34 PM
CL is slipping lower. A drop through 48.20 would be bearish, as it would represent a breakdown of CL’s channel dating back to Apr 2016. Likewise, a reversal by USDJPY at the little red TL would be tough for stocks to digest.
 FWIW, VIX has reversed twice today at the SMA5 50. Third chance coming up. If it doesn’t, then SPX should be boosted higher.
 UPDATE: 12:45 PM
Last chance. Might be worth taking a short position here. But, again, not much downside if all we get is a tag of the white channel bottom. Mostly up to VIX… If it were to happen, it would probably terminate around 1:25 PM at 2387ish, when the purple channel bottom intersects the white. It could easily hold off a bit longer, and wait until the red neckline intersected the white channel bottom at 2PM at 2387.70.
Again, I wouldn’t hold my breath. While the lack of a good tag on the white channel bottom is faulty chart behaviour, we’ve seen plenty of it over the past 7 months.
 UPDATE: 1:40 PM


 UPDATE: 2:41 PM
That should be enough. Back to long here with tight stops (reality could always sneak back into the equation.) I’d keep a close eye on ES, and the little red TL it has set up.

 If SPX should drop through the neckline again, there’s additional support at the neckline of another, smaller white H&S Pattern – about 2386.53.
 UPDATE: 2:53 PM
Not a good sign for bulls, but probably a head fake to establish a new H&S that it can bust… Back to short with stops at the SMA5 200. I assume it’ll turn at the white neckline at 2386.60. Can VIX hold this little break out, or will it drop back to/through the red TL?
 UPDATE: 3:04 PM
Not in a million years do I expect this to happen, but remember our red target down at the purple .618 at 2370.86. This would be another backtest of the yellow channel top, the white channel top, and the .618 Fib (a common retracement after reaching the purple .886.)
I’ve left it alone for the past few days, but it’s still down there. If this white H&S plays out to 2377.50ish, it puts SPX within 6 points of that red target.  If it were to happen, it could be at the close today or tomorrow’s open. It would be a 16-pt drop (0.6%) drop from here. They might declare a market holiday in order to allow things to stabilize.
 And, if all hell breaks loose (a Le Pen victory) then I suppose our yellow target down at 2361ish is theoretically in play.
UPDATE: 3:24 PM
Backtesting the SMA5 200…again. USDJPY and VIX are suggesting we just might get some additional downside. But, it’s impossible to feel even the least bit confident.

 UPDATE: 3:48 PM
This is the time of day when I usually write the warning to only hold short if you can hedge or handle the gap risk we’ve all come to know and love. USDJPY is now revving up to boost stocks going into the close.