

More of the same. Today’s forecast is exactly the same as yesterday’s, with a little more certainty thrown in regarding a backtest.
continued for members… (more…)
More of the same. Today’s forecast is exactly the same as yesterday’s, with a little more certainty thrown in regarding a backtest.
continued for members… (more…)
SPX has cleared most of the obstacles to unfettered new highs. USDJPY continues to perform contortions that only a central banker could love. While, CL continues to be a potential drag.
continued for members… (more…)
Technically, SPX reversed yesterday at the 1.618 extension of the drop from 1576 to 666 between Oct 2007 and Mar 2009. In an unrigged world, we’d call the move from 1810 to 2143 a truncated 5th wave and get ready for a massive sell off.  But, with more and more talk of helicopter money in Japan, and rapidly rising CL and USDJPY, it’s hard to imagine.
continued for members… (more…)
The last time SPX was in a position to make new highs, it fell 125 points instead. If fact, it’s tested the May 2015 highs six times since then. Any of those days, it was within a good ramp job of shooting up past 2134. Is this one any different?
continued for members...
First, note that SPX has successfully backtested the falling yellow channel (though it probably dipped a little lower than they had planned.) It has also broken out of the falling purple channel. 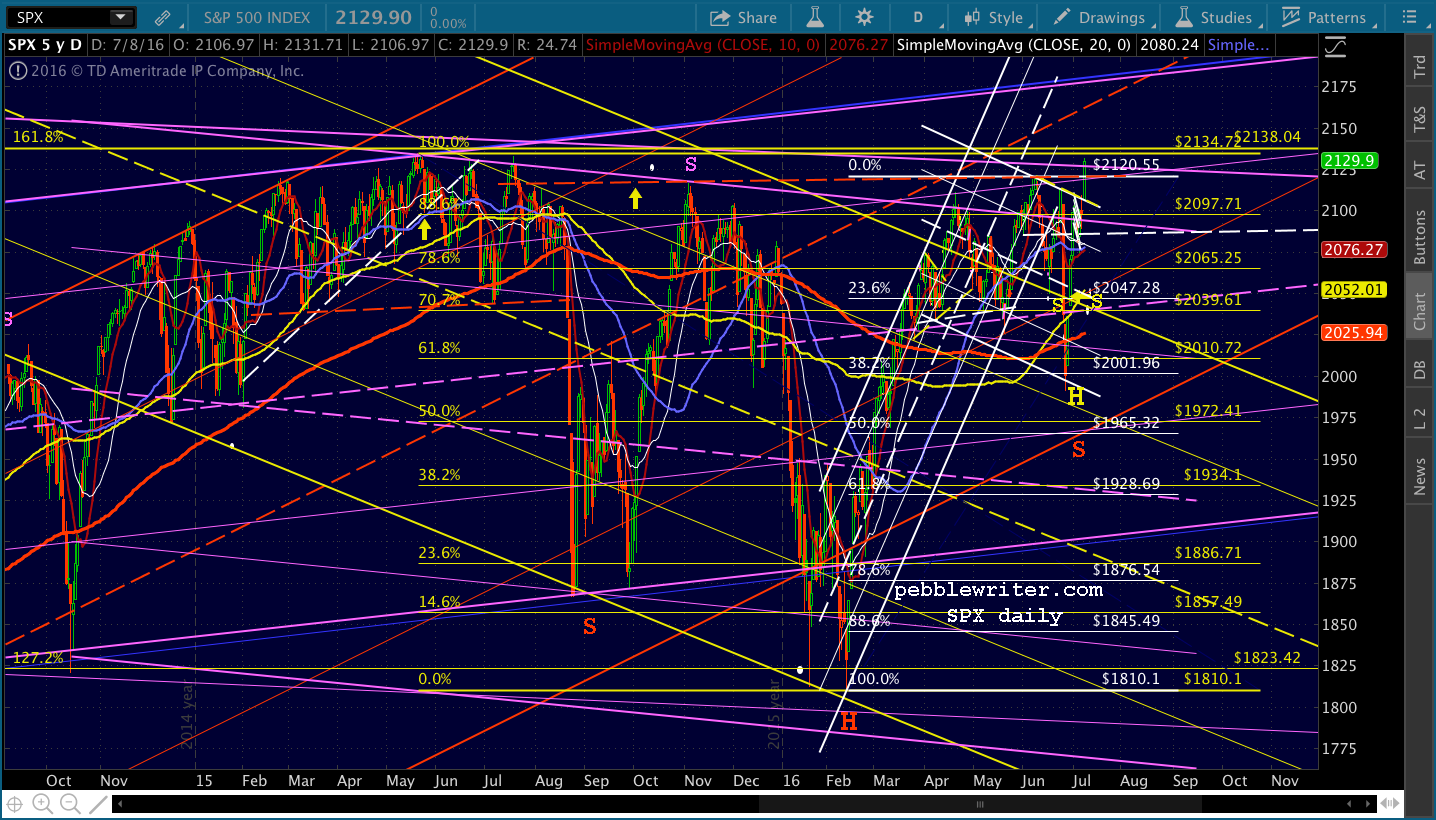 It did this once before, but Brexit knocked it back down quite a bit. It has now completed an IH&S Pattern within the right shoulder of a much larger IH&S Pattern targeting 2422.
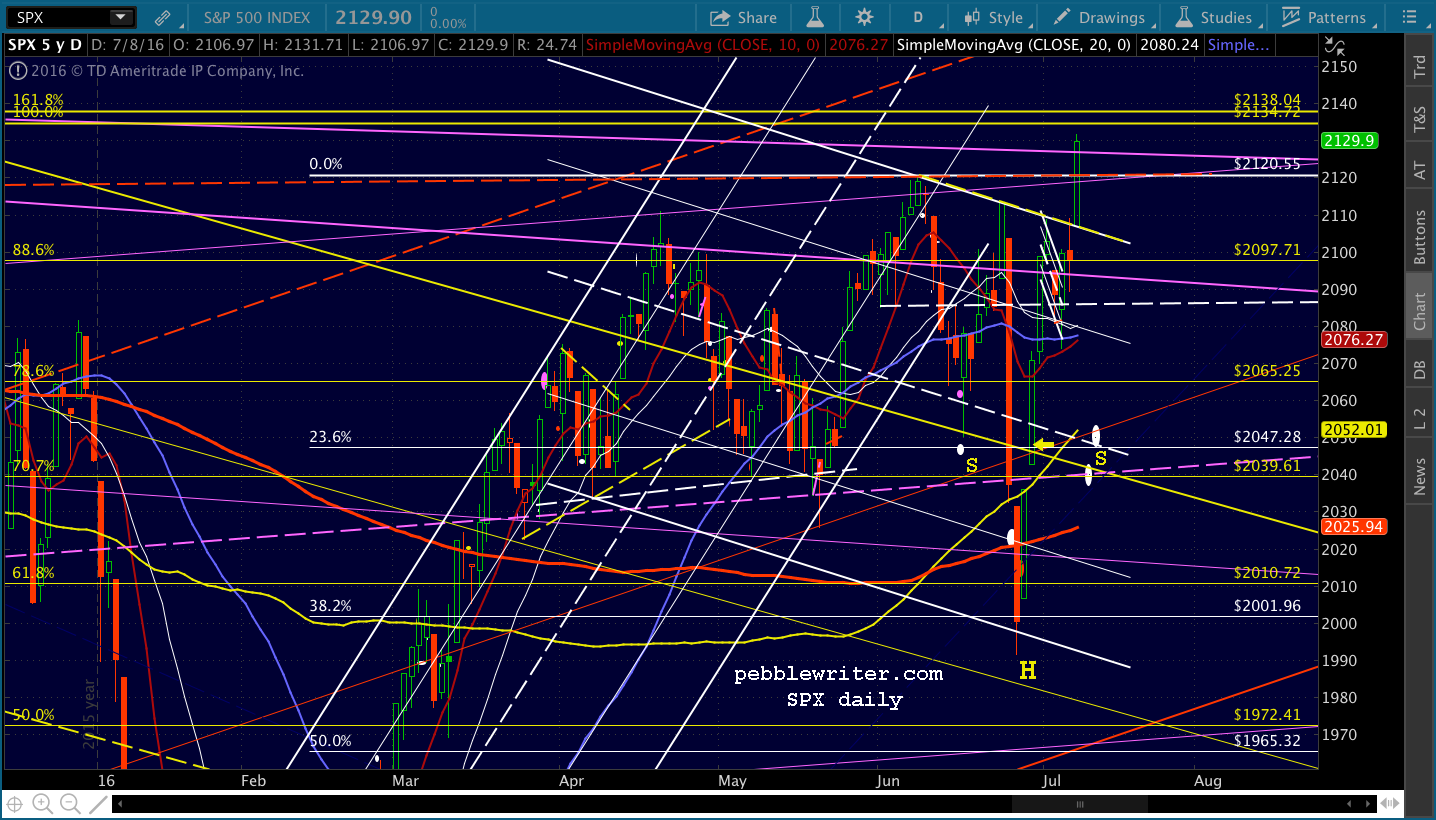 And, it broke out of the small, falling white channel — busting the bearish Harmonic grid that had provided a path lower.
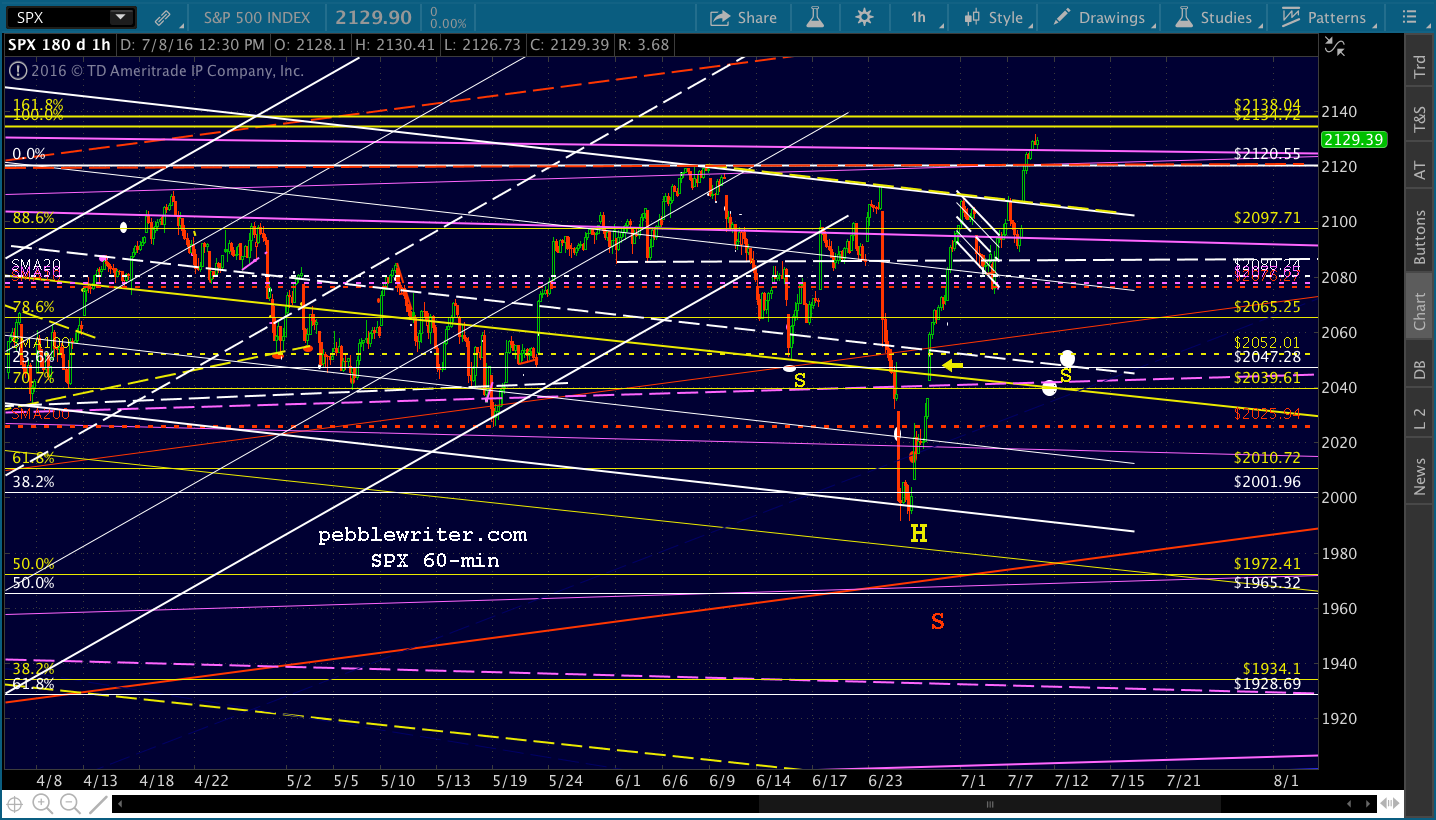 In short, there are no chart patterns or harmonics standing in the way of new all-time highs — which is what you would expect when central bankers are gearing up for more stimulative action and when the global Stimulator in Chief (Abe) was reelected in a landslide.
About the only resistance is the actual 1.618 extension at 2138.04. It was this Fib level that SPX came up 4 points short of on May 20, 2015. Technically, we could call the rise back to 2138 a truncated 5th wave and get ready for a huge decline.
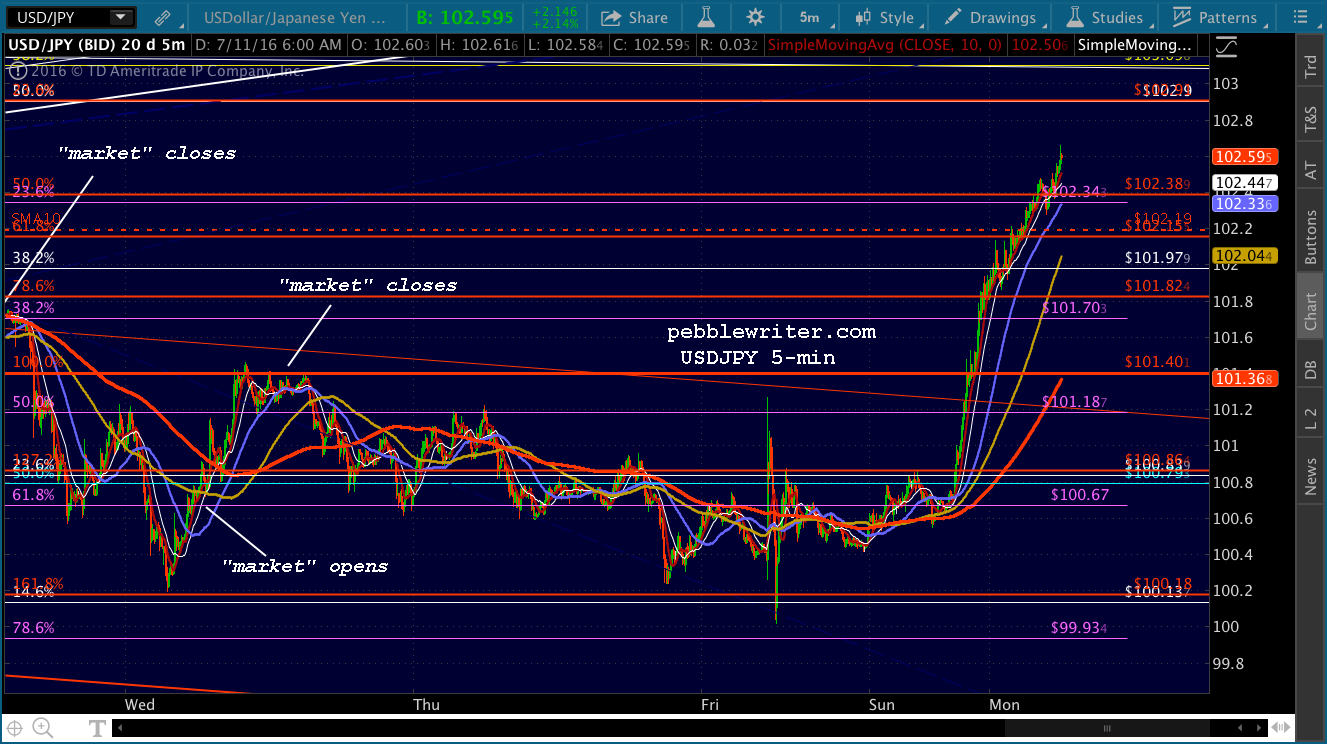
But, I imagine TPTB have taken this risk into account and are planning a very big push to make sure it doesn’t happen. Seen USDJPY this morning?
 GLTA.
GLTA.
Not much new to report at this hour, as all eyes are on this morning’s employment report. Another bust like last time would drive a nail into the Fed’s rate rise coffin. While, a strong report might give pause for thought.
The biggest chart development yesterday was in oil, which tumbled sharply.
continued for members… (more…)
Yesterday, SPX reached our initial target and came up just short of our secondary before a convenient API report sent CL spiking higher.  The algorithms were in fine form, dragging SPX higher as well.
  From yesterday’s post:
Look for SPX to try to contain this morning’s losses to the channel bottom. I expect new lows, with the SMA50 at 2076.59 and the SMA10 at 2072.28 as the next mostly likely targets.
USDJPY continued its streak of intraday ramp jobs. And, again, it settled lower after the stock “market” closed. continued for members… (more…)
SPX had little trouble reaching our downside target yesterday. As we noted before the open:
Today, we see a capitulation of the USDJPY ramp job that dragged stocks out of their post-Brexit malaise. It should be enough to allow SPX to finally backtest some of its moving averages, the closest being the SMA20 at 2082.
SPX tagged 2080.86 before the usual CL and USDJPY ramps prompted an 11-pt rebound into the close. But, the ramp jobs didn’t last.
  And, in fact, their continued weakness suggests much lower lows to come.
continued for members… (more…)
We’ll start with a peek at the Big Picture posts for each month so far this year, and wrap up with a look at what to expect going forward.
The Big Picture, January 5, 2016
On Jan 5, I was focused on the fact that USDJPY had dipped below the critical Fib line at 120.11.
Did you feel it? Something big happened yesterday, and it had nothing to do with China, Saudi Arabia, Iran or Donald Trump. Of course, I’m talking about USDJPY, which closed below the key Fib line at 120.11. Is it important? Well, the last time it dipped below this level, stocks were in the midst of a 12.5% plunge.
 With SPX at 2020, I identified two important levels of support: 1984 and 1962.
With USDJPY below 120.11, and CL potentially plumbing new depths, 1962 should be doable. After that, we’ll have to see what tricks TPTB can come up with to maintain the purple channel. If they don’t, then we’re obviously in for much more downside than we’ve seen in a long, long time.
The following day, SPX dropped below 1984. The day after that, SPX plunged through 1962 and didn’t stop until it reached 1812 — a 12.9% (versus 12.5%) drop from the end of the year highs.
By Feb 8, I was crash watch. USDJPY had dropped below the bottom of a huge, 15-month old huge channel, with devastating results for stocks.
Now, as USDJPY drops through the channel bottom again, the “market’s” fate rests on whether or not the central planners will elevate the USDJPY yet again.
SPX, already down nearly 15% from its peak, had completed a huge Head & Shoulders Pattern that threatened to send the index tumbling another 17%.
 When the FOMC increased rates two days later, it completed an even more bearish H&S Pattern. On Feb 11[see: USDJPY Finally Relents], I wrote:
USDJPY, along with CL and SPX, should bounce here. If you’re a bull, they must bounce here. The only question: is it too late? [Keep] an eye on CL, USDJPY and NKD for signs of a turn. You’ll know, because all three will be screaming higher.
CL, USDJPY and SPX all reversed sharply that day. CL screamed 50% higher (currently about 100% higher) in about five weeks, producing a 12% rally in SPX and a 17% rally in NKD. It was a massive, highly successful intervention that cemented CL’s role as the primary driver of stock prices. I set a target at 2000 for SPX by Mar 12.
SPX had already reached 2000 by Mar 4, over a week ahead of schedule. The FOMC and BoJ were both due to announce next steps the week of Mar 14.
And, now we face the question of whether SPX will reverse strongly or merely take a breather here. With Kuroda announcing any BoJ policy changes tomorrow and Yellen doing the same on Wednesday, “markets” remain in the hands of the central planners. Wouldn’t it be nice if they’d just publish future stock prices while they’re at it?
Given their success in rallying SPX off its Feb 11 lows, it seemed they were more likely to break out than down. I placed targets of 2050-2065 around Apr 1 and 2087 (later increased to 2098) by Apr 22.
 The central banks obliged. SPX reached 2065 by Mar 30 and 2087 by Apr 18. SPX topped out two days later at 2111, 13 points beyond our upside target.
This was another post centered around the coming FOMC and BoJ actions. SPX had managed a rather extreme rising channel that was built entirely on CL and USDJPY intraday rallies.  But, I had little faith in the BoJ’s ability to keep the USDJPY rising.
That’s probably about it for this leg. If you’re a contrarian and can hedge overnight and don’t believe BoJ has any ammunition left, this would be a great place to short. I still believe the yellow .786 at 2065 is in play…
If there’s a silver lining for bears, it’s that tilting the rising red channel over a bit theoretically presents an opportunity for a backtest of the SMA200 down at 2014 (the red dot above.) Though, it sounds ludicrous to talk of a 73-pt drop in the next day or two.
The following day, the BoJ Screwed the Pooch, and SPX began a 3-week decline to 2025, not quite to the SMA200.
On May 5, I focused on a potential bottom for SPX, identifying a backtest of the broken white channel at 2039 as the most likely scenario.
It could happen any time between now and then, and it could even wait until Friday or Monday. But, the point is to backtest and, thereby, firmly establish support in order to legitimize another push higher.
 SPX would backtest the white channel top the next day, bounce 35 points, test it again on May 13 and 17 before finally dropping below it on May 19.
This post was all about the FOMC’s rate decision the following day. My thoughts on the matter:
Tomorrow, I expect the Fed to punt. I expect the dollar to try and sell off, but be propped up by central banks when the yen carry trade unwinds a little more. And, I expect oil to rise to compensate. As always, I don’t recommend trading on Fed announcement days. But, if SPX sells off, and if you’re very careful not to get whipsawed, I’d look for opportunities to short SPX, possibly down to 2017 or even 2000.
As it turned out, a steep rally in CL kept SPX on the rise through June 23, at which point it dropped through 2000 (and the falling white channel) to 1991 before beginning the biggest, sharpest V-shaped recovery we’re seen in quite a while.
continued for members… (more…)
The EOTWAWKI Sale
Final 48 Hours
There’s something deeply satisfying about being short when the buy and hold crowd is freaking out over the massive (their word, not mine) 5% Brexit drop in the S&P 500. And, that’s what pebblewriter.com is all about — catching most of the moves most of the time, regardless of which way it’s going.
Ordinarily I wait until the actual end of the month to start any kind of membership sale. But, we’ve had a pretty good month so far [CLICK HERE]; and, I have the feeling there are a lot of folks out there who are truly confused about what’s going on.
Be confused no more. Sign up for an Annual Membership at over half-off the first year or, even better, a Charter Annual Membership where your rate is guaranteed to never increase for the life of the site. Don’t delay, as this promotion ends on July 2.
CLICK HERE here to Sign up Now!
Were you frustrated a few times last month? If you’re anything like me, you found the degree of market manipulation downright stunning. But, we were presented with some great opportunities — from the 5% Brexit correction to Wednesday’s CL short, and several USDJPY shorts.
I’ll have last month’s results up this morning, but in the meantime, take a look at USDJPY. As expected, the rising purple channel broke down last night.
Our bonus chart from 7:30pm last night…
 …and, the same chart this morning.
  We’ve talked many times about how USDJPY has been reduced to a tool for manipulating stocks (just yesterday, in fact.) Consider NKD, which has been building a sharply rising channel all week since Brexit. USDJPY needed to reset last night, ideally to flesh out the less steep white channel I expected to take form.
Note the tags on NKD’s channel bottom, labeled 1-3. And, note the placement of the same labels in USDJPY. Which was the tail and which was the dog?
 There are a number of charts which indicate SPX should take a breather, now that the month/quarter are over. But, will it? It’s been a hell of a ride since popping back up above the DO NOT CROSS channel top on Tuesday, its first of three gaps higher this week.
 I’ll be watching to see when USDJPY drops the rest of the way to 102.3 — a pretty sure thing.
CL, which is now off 4.2% since our top call on Wednesday, suggests we’d be safe shorting here — particularly if it doesn’t pop back above the purple channel midline. With the holiday weekend just ahead, it’d be pretty easy to undo whatever damage TPTB allow today.
continued for members... (more…)
With SPX having recovered almost two-thirds and FTSE all of its Brexit losses (from their inflated pre-Brexit ramp job heights) by the end of the 2nd quarter, The Powers That Be can pat each other on the back. The crisis has been averted, the “markets” are safe, and life is worth living again. Mission accomplished.
After the quarter officially ends, maybe USDJPY will go back to wallowing around on its way lower. After tagging our downside target last night (a few hours late) it has managed to maintain the positive channel, and should manage to do so for a few more hours. CL, which had gained a stunning 9.1% in order to rescue stocks, is down 2.8% since yesterday’s top call. Congrats to all who were foolhardy enough to heed the call.
 SPX hit its .618 Fib yesterday, a sharp 4.3% spike off Monday’s lows but landing at a spot that should produce a reversal.
This has been a very difficult month, with chart and Fib patterns trashed at every opportunity by the folks who are really running the show: your friends and mine, the central bankers.
continued for members… (more…)