Month: May 2016

  • Charts I’m Watching: May 31, 2016

    Lots to examine today.  Futures are up 3 points, but the bigger development is that DX and USDJPY have reached the upside targets we set for them several weeks ago.  We’ll start with DX, which after losing trend last week, came back and tagged the top of the falling white channel.2016-05-31 DX 4 0610 USDJPY has reached almost as important a level of resistance — the midline of the channel that has guided its downside for over a year.

    continued for members(more…)

  • Update on RUT: May 30, 2016

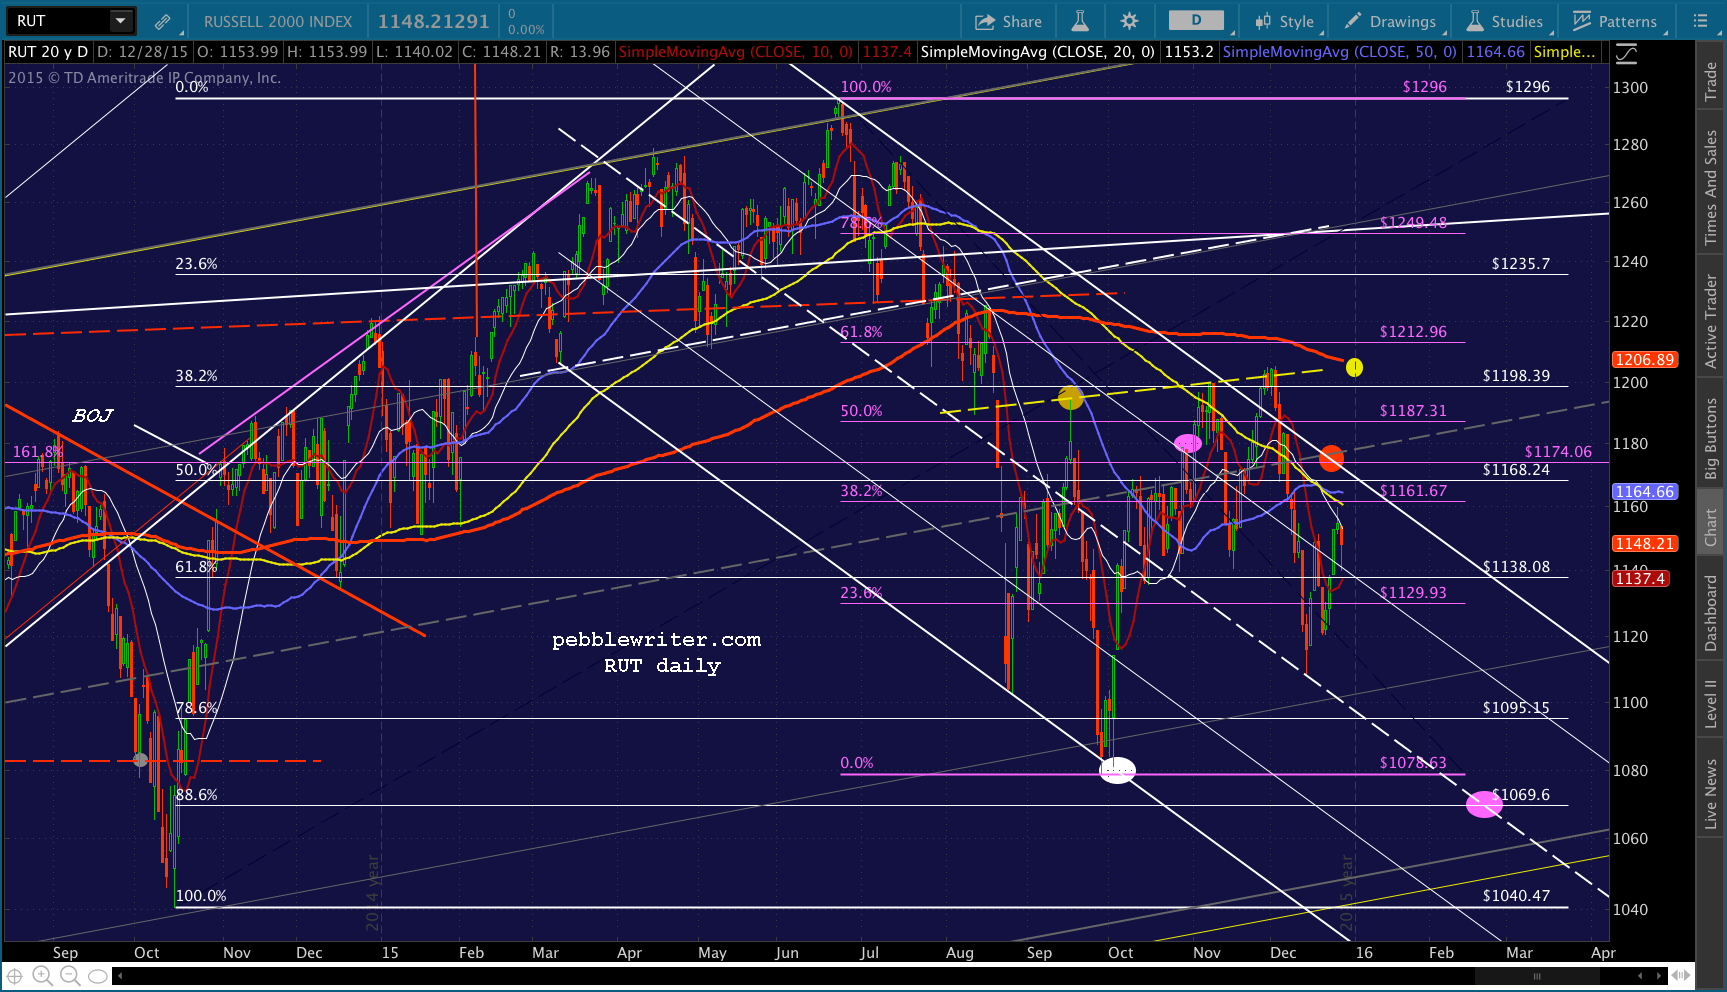
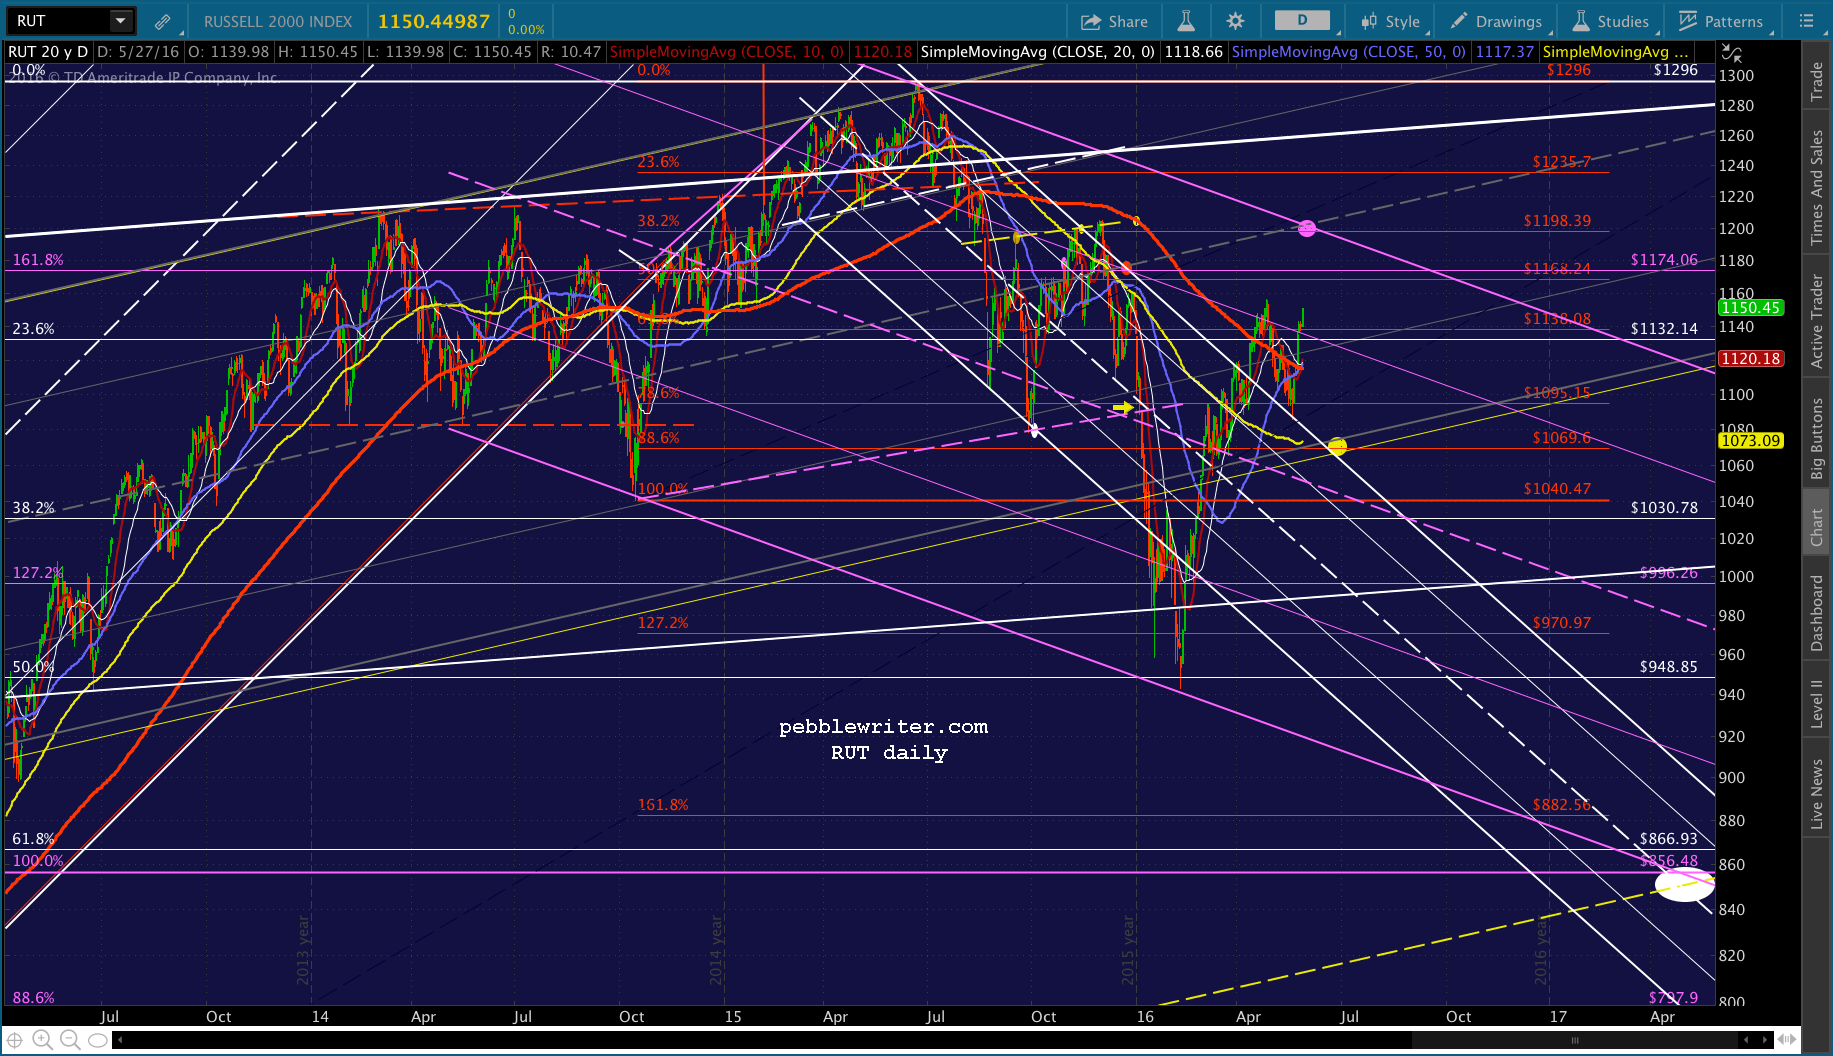
    When we last caught up with RUT, it was potentially going to take another shot at completing an Inverted Head & Shoulders pattern.  But, as I noted at the time, this would require it to break out of the falling white channel that had guided it lower for six months.

    2015-12-29 RUT daily 0400But, to do so, it needed help.

    USDJPY [has] continued falling until it reached (well, almost) the most important support on its entire chart: the yellow .618 at 120.11.  If it holds/bounces, then RUT should get another bite at the apple.

    As it happened, USDJPY was in no mood to help.  Instead of bouncing at 120.11 in the wake of the first Fed rate hike in nearly a decade, it dropped through and shed 12% over the next several months.  With the yen carry trade unraveling, RUT plunged 19% over the next six weeks.

    2016-05-30 RUT daily CU 1815continued for members

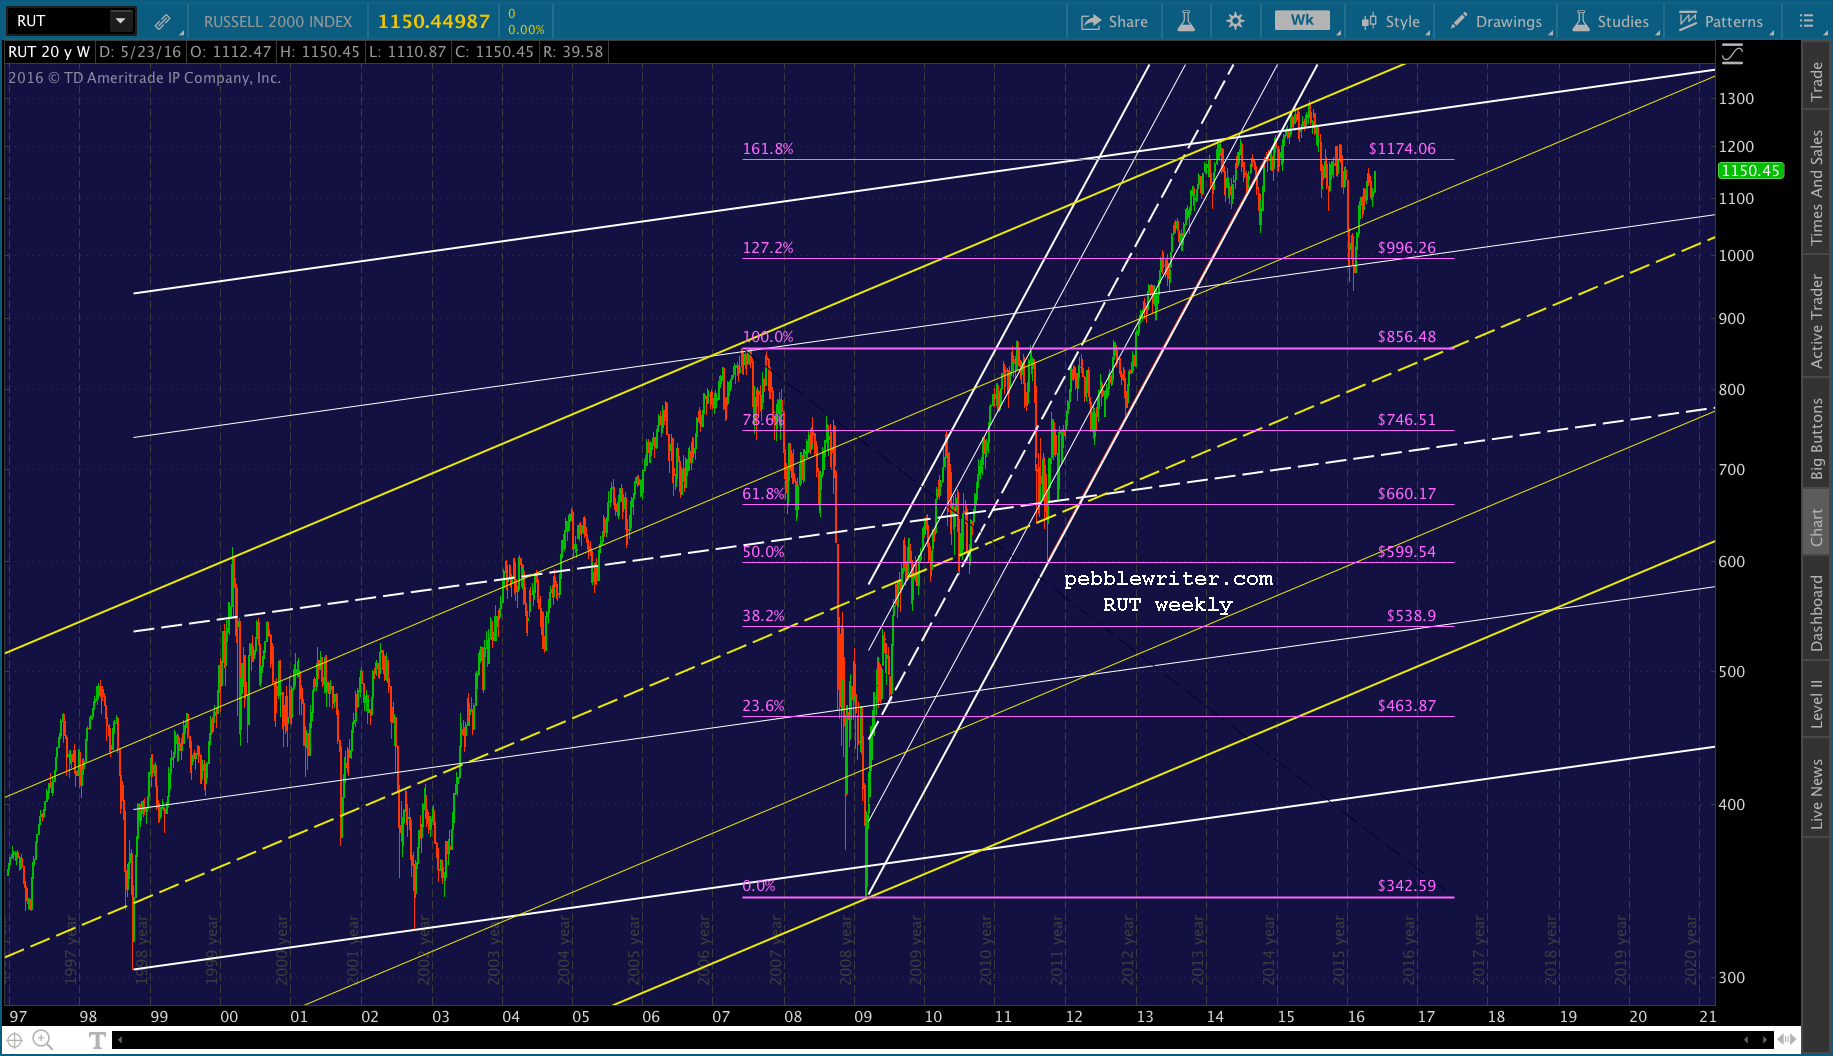
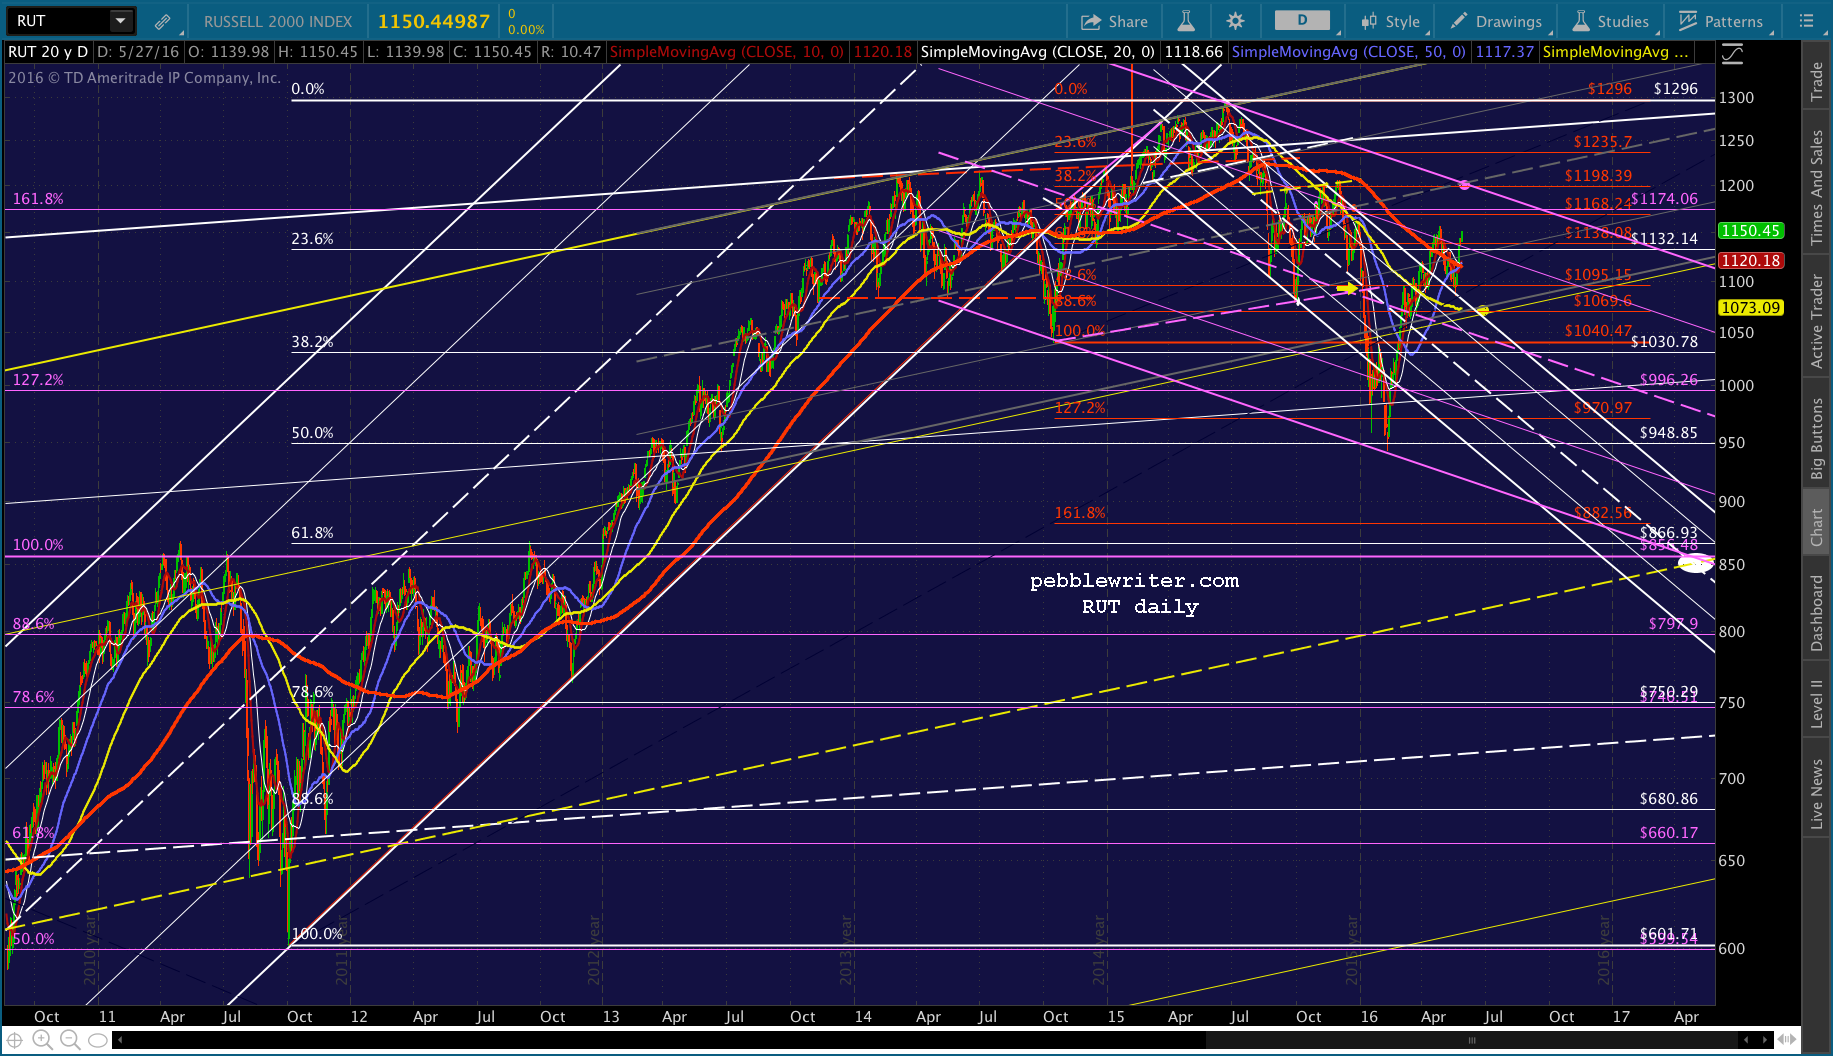
    RUT’s long term channel is a good place to start.  Like many other indices, RUT should have reversed when it tagged the top of the white and yellow channels at the purple 1.618 in late 2013.  (Of course, that was when USDJPY started making noises about heading higher again.)

    2016-05-30 RUT wkly 1700Instead, it went sideways for months, successfully avoiding a H&S Pattern that would have sent it to 870.  It finally broke down, but bounced sharply in October 2014 (the Bullard Bounce) to new highs.  It didn’t top out until late October, a month after SPX.

    Note that it climbed the underside of the broken white channel for six months — all the way until it hit the top of the rising yellow channel again, at which point it climbed the underside of that channel for another six weeks.2016-05-30 RUT wkly CU 1815Eventually, it topped out — two weeks after USDJPY did.  And, it eventually formed the falling white channel I mentioned in the Dec 2015 post.

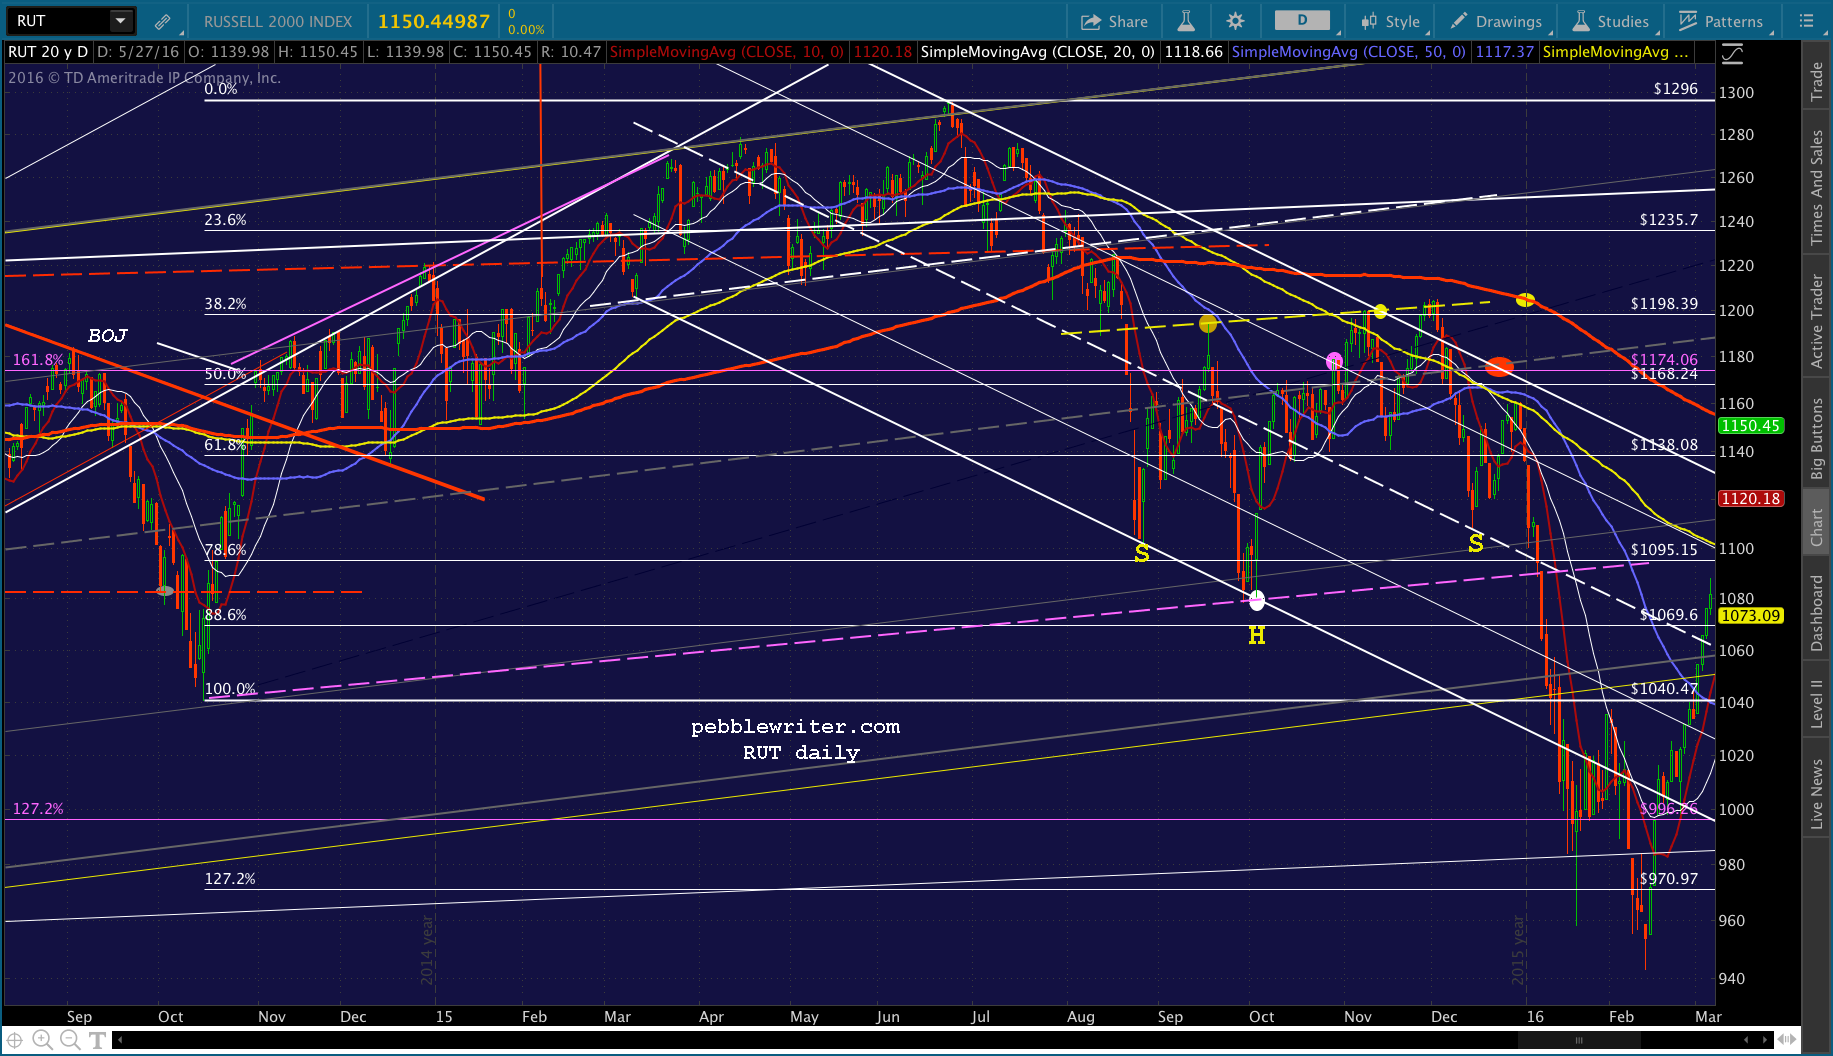
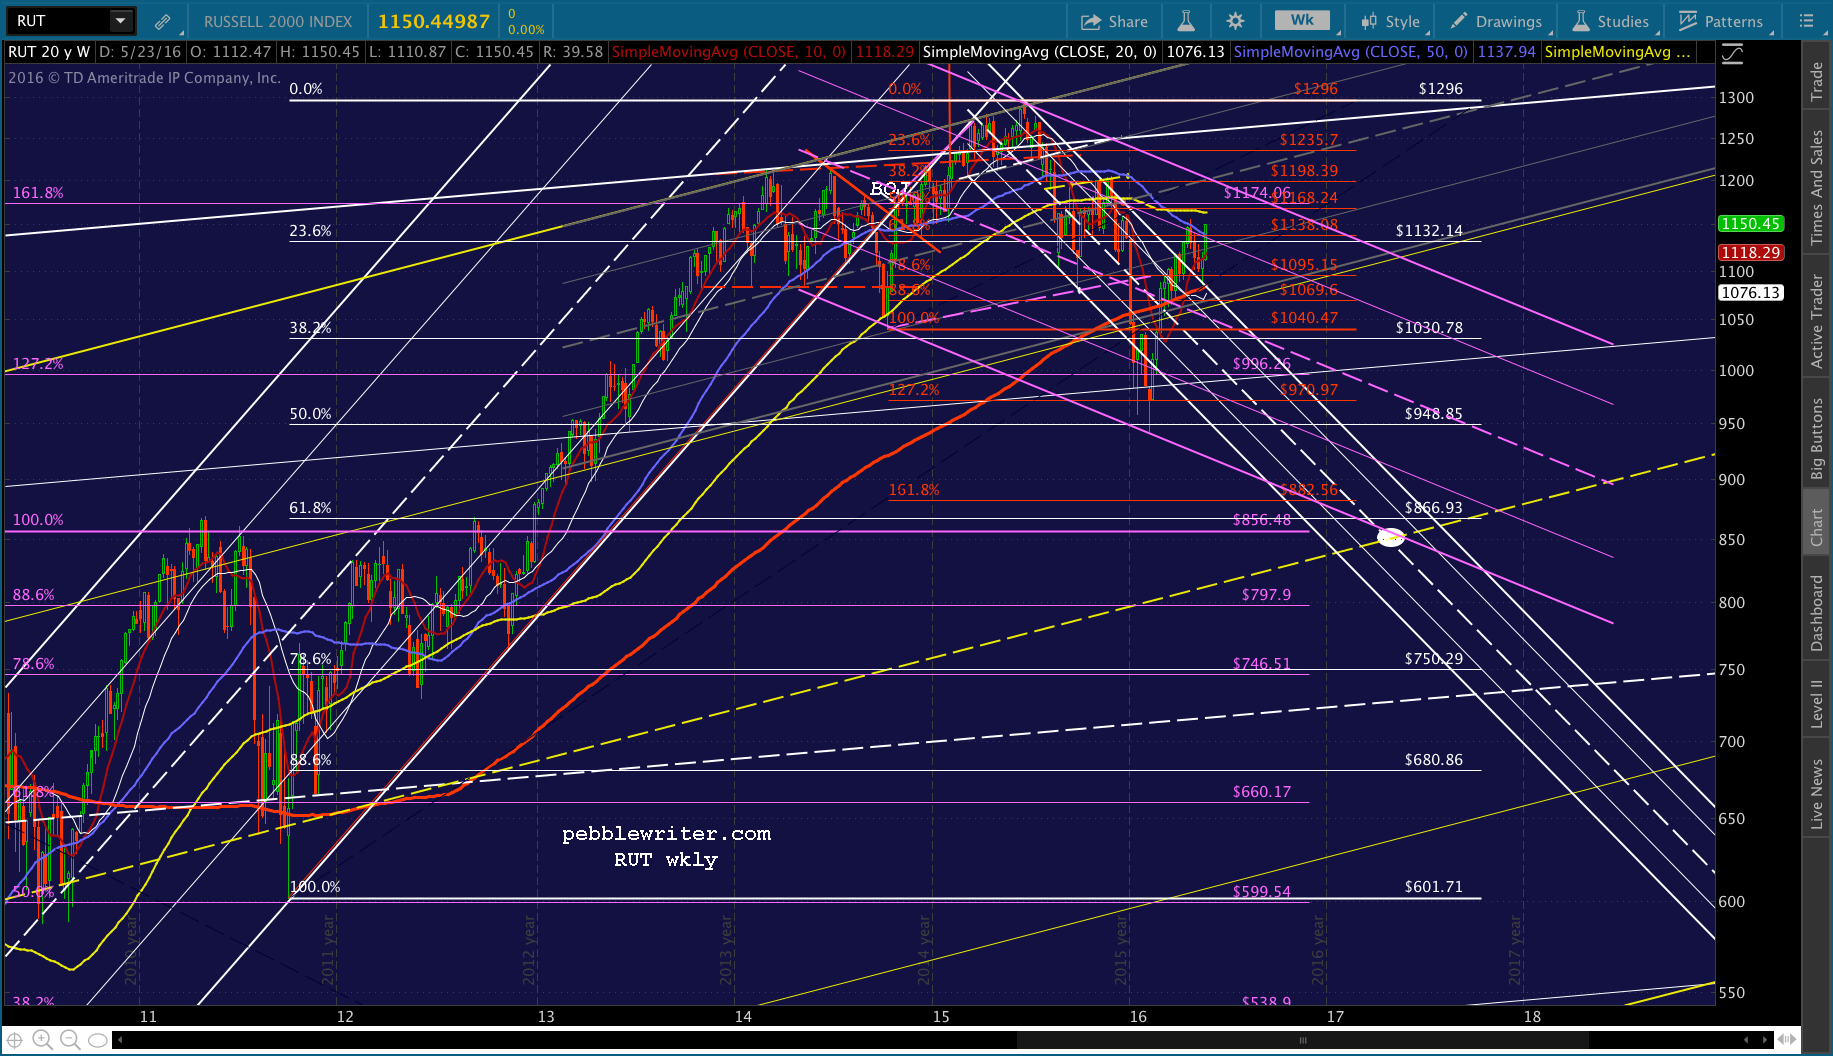
    In January, that falling channel broke down, and RUT continued until it found another means of support.  I’ve inserted the falling purple channel above, which does a reasonably good job of capturing most of the turning points.

    Note that RUT, after bouncing on Feb 11 when oil bottomed out, is back above the falling white channel.  It even backtested it, for good measure.  It looks as though it intends to test the top of the purple channel at 1200ish, though there could easily be a C leg down to 1070 first.2016-05-30 RUT daily CU 1900

    With another rate hike potentially on the way (we’ll believe it when we see it) we have to wonder whether it can actually push to new highs at this stage.

    Having already reached the purple 1.272, it has satisfied the bare minimum reaction to that Fib.  And, having already reached the red 1.272, it could conceivably be done with the downside Fib pattern. 2016-05-30 RUT daily 1900

    But, note the white dot in early May 2017 at 850-867.  It represents the bottom of the falling purple channel, a backtest of the May 2007 and April 2011 highs,the red 1.618 extension, the white .618 retracement, the yellow channel midline, and probably some other stuff I haven’t even noticed.

    It’s more than a little ironic that it’s the same price range that the 2014 H&S Pattern targeted.  And, given that TPTB worked so hard to avoid that drop in the first place, it’s probably a long shot that it could fall another 24%.

    If it bounces from here, the upside resistance consists of the purple .618 at 1161.19, the purple channel top at 1200, and the white channel top at the .886 of 1255.77.  From there, it’s only 40 points to new highs.2016-05-30 RUT daily ECU 1900As in December, much will depend on whether or not the Fed announces another rate hike in June.   It appears, at this time, that they’re trying to get it up past as much resistance as possible before that occurs.

    Stay tuned.

  • Update on NDX: May 30, 2016

    In our last update on NDX, I noted that NDX was testing key support at the bottom of a long-term channel as well as the 100- and 200-day moving averages.  The index had climbed to within 1.6% of its tech bubble highs from the year 2000.  New all-time highs appeared to be just ahead.  But, there was a catch:

    However, if investors are disappointed with the Fed’s upcoming decision, look for another test of the white channel bottom at around 3955.

    2015-12-14 NDX daily 1800As it turned out, investors were quite disappointed when, two days later, the FOMC increased its target range by 25 bps to .25 – .50% and the YE 2016 target rate to 1.375%.  TPTB managed to tread water for another 10 sessions, through the end of the year.

    Then, NKD broke down.  It reached 3992 within the next three weeks, bounced almost 8%, then plunged below our 3955 target to complete a Bat Pattern at 3888.  By the time all the dust had settled, it was an 18% plunge in about 7 weeks.2016-05-30 NDX daily 1538Hedgies that were crowded into some of these can’t-miss stocks took it on the chin.  Now that the index is back to a point of major resistance, what lies ahead?

    continued for members... (more…)

  • Memorial Daze

    There’s an old saying: never let a good 3-day weekend go to waste when the market needs propping up in the weeks leading up to a rate hike.

    Not really.  I made that up.  I’m not sure it’s going to catch on, either.  But, it might…if more investors took a good, hard look at all the shenanigans that go on around 3-day weekends.

    I looked back at the past 15 Memorial Day weekends to get an idea what we can expect over the next several days.  Spoiler alert: there’s a very high incidence of major market manipulation — the momentum-changing variety.  And, it wasn’t always successful.

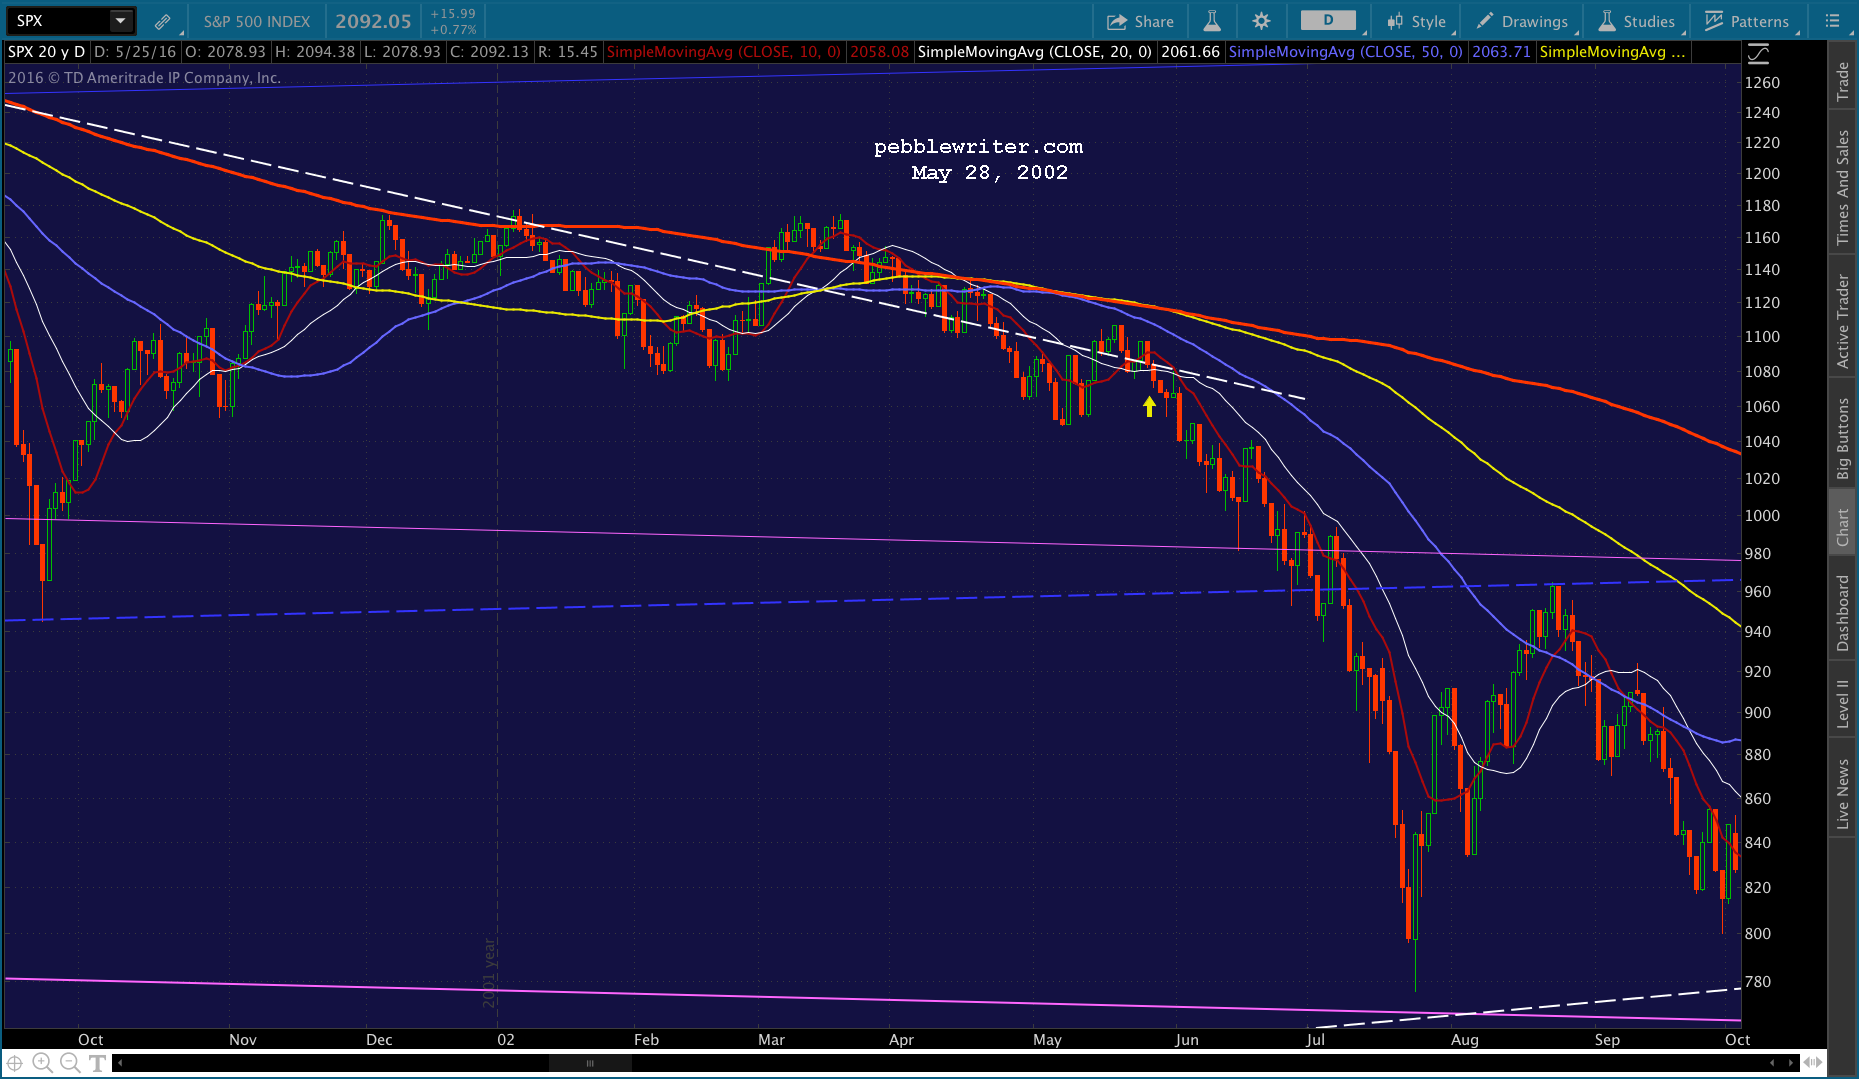
    For details, read on.  The yellow arrows in each chart refer to the day markets reopened after each Memorial Day weekend.

    May 30, 2000

    SPX gapped back above the 200-day moving average, then bounced 7.6% over the next six sessions.  This occurred shortly after stocks made a new all-time high at the height of the tech bubble.2016-05-25 SPX 2000May 29, 2001

    SPX did its best to hold above the SMA100 it had just gapped above (breaking the falling trend line in the process.)  Ultimately, it couldn’t stop the tech bubble from bursting. SPX dropped 26% in the next four months.

    2016-05-25 SPX 2001May 28, 2002

    Again, SPX tried and failed to hold a breakout.  It led to a 23% drop in the next two months.

    2016-05-25 SPX 2002May 27, 2003

    SPX gapped above two important trend lines as well as its moving averages.  SPX gained 8% in the next three weeks.  It marked the end of the tech bubble crash.

    2016-05-25 SPX 2003June 1, 2004

    Nothing spectacular here — just kept a strong bounce intact and held the SMA50.

    2016-05-27 SPX 2004May 31, 2005

    This day was about playing defense.  SPX had twice tried, and failed, to retake 1200.  On May 31, the pullback was limited to a channel midline and the 10-day moving average in order to allow 1200 to broken the following day.

    2016-05-27 SPX 2005May 30, 2006

    More defense.  SPX fell 20 points from the Friday before the close, but managed to hold the line at the 200-day moving average.  The battle was lost a few days later, but the war was won when the bottom of the rising purple channel from 2004 held.

    2016-05-27 SPX 2006May 29, 2007

    SPX had just topped 1500, but had run into the midline of a channel dating back to 2003.  It needed to hold on to its gains, and a push back above the SMA10 over the weekend helped it do so.  It bounced for two more days, before continuing lower in the crash of 2007-2009.  It wouldn’t see those prices again until 2016-05-27 SPX 2007May 27, 2008

    After having lost 320 points from new all-time highs the previous October, SPX had just bounced up to trend line resistance and the 200-day moving average. Memorial day weekend provided a nice bounce at the SMA50.

    2016-05-27 SPX 2008 Unfortunately, the bounce only lasted two days.2016-05-27 SPX 2008-2May 26, 2009

    This one’s kinda special.  After crashing 58% since October 2007, SPX was considering breaking out of the huge falling channel that guided it lower.

    The smart move might have been to allow a deeper dip in May to set up an inverted Head & Shoulders pattern.  But, they powered it right on through and put in a small right shoulder after topping the SMA200.  It’s all good.

    2016-05-27 SPX 2009June 1, 2010

    Ah, ha, ha, ha, stayin’ alive. Stayin’ alive.  SPX plunged 2%.  Fortunately, the Ben-Gees were ready with another round of QE.

    2016-05-27 SPX 2010May 31, 2011

    This bounce came a few weeks after I started publishing my research on May 2 — thinking that a top was near.  It shook my confidence, as SPX broke out of a well-formed falling channel.2016-05-27 SPX 2011It sure looked like a breakout, so I was more than a little nervous as I posted that day:

    If [the push to 1381] doesn’t happen by Monday, then the drop from May 2 was IT. 

    Thank you, oh wise and powerful chart gods.2016-05-27 SPX 2011-1May 29, 2012

    After clawing back to the 2011 highs, SPX finally reached the 1381.50 Fibonacci target — but formed a Head & Shoulders pattern and completed a Butterfly pattern in the process.  May 29’s bullish-looking bump proved to be a 1% head fake in the midst of an 11% correction.  2016-05-27 SPX 2012

    May 28, 2013

    An unremarkable 0.6% bump in the midst of an 8% correction.  It didn’t matter, as SPX was backtesting the 2007 highs.2016-05-27 SPX 2013

    May 27, 2014

    This one was a bit of a dud — a 0.5% pop over horizontal resistance.  Just another day in paradise.

    2016-05-27 SPX 2014May 26, 2015

    SPX closed the Friday before Memorial Day weekend just a few points away from our long-held 2138 target.  No doubt, most traders went comfortably long into the three-day weekend.

    After having pointed out the dangers two days prior [The Last Big Butterfly], I was anything but comfortable.  But, I was surprised all the same to see SPX dump 22 points when the markets reopened.

    2016-05-27 SPX 2015By the time the dust had settled 3 months later, SPX had shed 12.2% and May 20 was crowned the new all-time high.  A year later, it still is.

    2016-05-27 SPX 2015-1Lessons Learned

    Of the sixteen Memorial Day weekends since 2000, seven have been seen SPX fall on the following Tuesday.   Losses averaged 12.4 points.  The other nine Tuesdays saw SPX rise by an average of 15.4 points.

    Screen Shot 2016-05-27 at 5.47.28 PMThe biggest gains occurred when SPX was trying to recover from a sharp decline and needed support.  The biggest losses occurred soon after new highs or an extended rally such as we’ve experienced this past several months.

    Bottom line, markets like 3-day weekends for the same reason that muggers enjoy dark, moonless nights.  It’s easier to accomplish the task at hand when no one’s around to notice.

    With SPX only 35 points from new all-time highs, it would seem an ideal time to push through resistance. What better opportunity?  Of course, that’s what folks thought last Memorial Day weekend.

    We have a rate hike coming up, possibly next month.  Things didn’t go so well the last time the Fed hiked rates [see the Bonus Charts below.]  Watching the dollar spike today, I’m apparently not the only one who remembers.

    2016-05-27 DX 60 1300

    Bonus Charts:

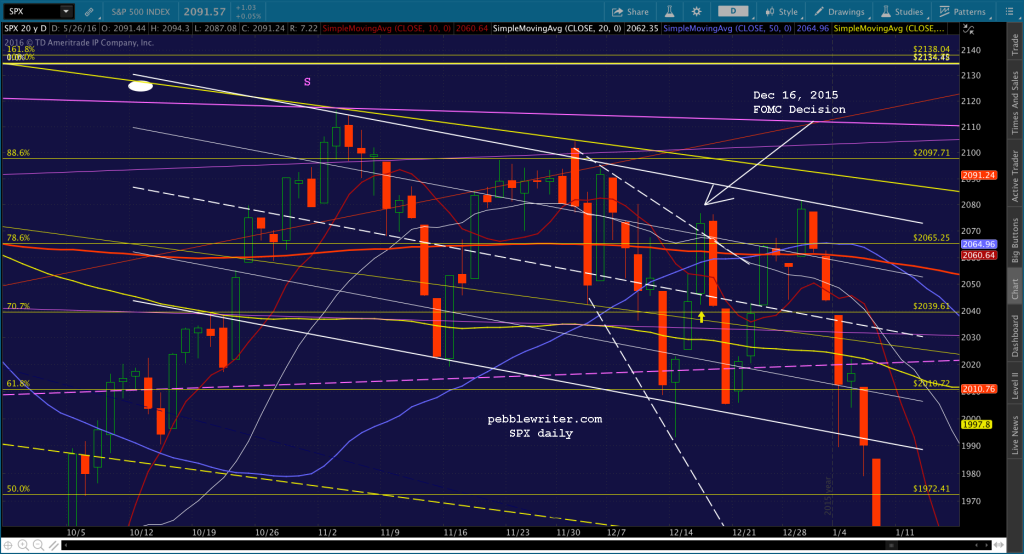
    The last time the FOMC actually raised the discount rate was Dec 16, 2015.  The markets reacted with their usual rally.

    The Fed likes to “help” markets rally on FOMC announcement days.  It reassures investors that the FOMC has their backs, and won’t let anything bad happen.

    2016-05-26 FOMC 60 Dec 16 2015In this case, SPX actually broke trend and popped above the 200-day moving average — a very strong reaction. 2016-05-26 SPX daily FOMC CU 12-16-15 But, of course, it didn’t stick.  After the support was withdrawn, SPX dropped like a rock.
    2016-05-26 FOMC 60 big Dec 16 2015 If it plays out like this again, look for the US dollar to make another strong move.2016-05-26 DX daily FOMC Dec 16 2015

  • Will She or Won’t She?

    yellen12Like nervous high school boys dressing for the prom, investors everywhere are wondering whether or not Janet Yellen will deliver the goods today.  Her fellow FOMC members have practically guaranteed a rate hike by July, maybe even June.

    There’s no better indicator than the US dollar, which has spent the past 10 days or so dancing around a range of support — formerly resistance.2016-05-27 DX 60 0545continued for members(more…)

  • Ludicrous and Ludicrous-er

    I’ve been observing the CL algo nonsense for a long time, so I’m not easily shocked by the ludicrous goings-on there. This past week has truly set for records for ludicrous-ness (with apologies to Mrs. Seine, my 10th grade English teacher.)

    What’s my forecast for oil?  Whatever price is necessary to keep stock prices rising. 2016-05-26 CL v ES 60 0620And, after USDJPY’s dismal showing last night, it’s more necessary than ever.

    continued for members… (more…)

  • Update on USDJPY: May 25, 2016

    Back on May 2 [see: Happy Anniversary] I noted that USDJPY was in danger of losing its last shred of support.

    USDJPY has clearly lost the support of the rising purple channel from 2011, meaning the yen carry trade is on life support.  It’s possible the yellow .786 will give it the bounce it needs, but it looks tenuous at best.

    2016-05-02 USDJPY daily 0635

    As it turned out, the BoJ must have come to the same conclusion.  Because May 2 was the bottom, and USDJPY has since bounced an impressive 4.8% — though not without fits and starts.

    Now that it’s reached its first serious resistance, will it be able to punch through?  Can the yen carry trade be saved?

    continued for members(more…)

  • Charts I’m Watching: May 25, 2016

    SPX made its way to our channel top yesterday, thought about it for a nanosecond, then broke out forcefully.  While the housing data helped, most of the gains were already in the bag on the back of a massive 3.6% rally in oil, and an almost as impressive 1.11% ramp job in USDJPY.  2016-05-25 USDJPY 60 0615The USDJPY rally would be more impressive had it not taken the pair to some pretty heavy resistance.

    continued for members... (more…)

  • Update on EURUSD: May 24, 2016

    We’ve had a nice run with EURUSD.  Back on February 29, we forecast a bounce on the bottom of a rising red channel. 2016-02-29 EURUSD daily 1800 Two days later, we had a near miss.  A week after that, the pair took another swipe at it before experiencing the biggest intraday reversal of the year.2016-04-18 EURUSD daily 1842On April 18, we forecast a spike up to 1.1577, the top of the red channel, and were rewarded with a sharp reversal there on May 3.    With EURUSD having shed over 4% since then, what might be in store for the beleaguered pair?

    continued for members

    (more…)

  • Update on Bonds: May 24, 2016

    You might be one of those investors who cares nothing about bonds.  With the 10-yr failing to even keep pace with inflation, why bother?  Because, after decoupling in 2014 and part of 2015, stocks and bond yields have mostly moved in tandem for the past year.  Ignore bond yields at your own peril.

    *  *  *  *  *

    In our January 13 update, I noted that TNX was nearing potentially important support.

    Note the white dot at 20.21.  This is not only a key Fib level (.618), but the bottom of a TL off the Jan 30 lows.  As support goes, it’s of average strength.  But, it likely lines up with our 1882-1887 SPX target.  So, I’m giving it the benefit of the doubt.2016-01-13 TNX 5 0845If the trend line breaks, then the next major support isn’t until 1.90 or so– the Aug and Sep lows — which would probably mean SPX 1882-1887 didn’t hold either.

    TNX reached 20.21 two days later, bounced for a few days, then broke down below that white channel bottom. Needless to say, SPX 1882-1887 didn’t hold either.

    SPX plunged 138 points over the next two days (the thin, purple line.)  Only when TNX bounced back above the channel bottom did SPX recover at all.2016-05-23 TNX 5 1100TNX eventually found support, but it’s been unbelievably wishy-washy about holding that support.  If I didn’t know any better, I’d say TPTB are propping it up.

    But, that would mean press conferences, interviews, sound bites wherein Fed presidents talk up the probability of an imminent rate hike, even when it seems contrary to an unending stream of weak economic data.  Come to think of it…

    The long-term picture is one of the charts that, back in 2013, had me absolutely convinced that SPX was heading lower.

    Previous plunges in interest rates had obviously accompanied plunges in stocks.  The logic is straight forward: stock market crashes drive investors into bonds, which bids up the prices and down the yields.  The 2000-2003 and 2007-2009 crashes are the obvious ones.2016-05-23 TNX wkly big 1743But, TNX experienced a number of less dramatic reversals that accompanied smaller corrections: Apr-Jun 2010 (-15.4%), Jul-Oct 2011 (-20.1%) and Mar-Jul 2012 (-9.9%.)

    In September 2013, the 10-yr tagged the yellow trend line from June 2007.  But, SPX was still a little shy of our 1823 target.  So, we forgave TNX when it bounced slightly higher to nail the .618 Fib at 30.13.  As it turned out, SPX nailed 1823 at the same time.  It was a beautiful setup for shorting.

    Sure enough, TNX plummeted almost 50% — from 30.36 to 16.51.  SPX, on the other hand, went higher.  A lot.  By the time rates were done dropping, SPX had climbed nearly 15%.  Those bears, like me, who hadn’t noticed the growing influence the yen carry trade was exerting on stocks, did not have a good year.2016-05-23 TNX wkly 1743But, all manipulated things must come to an end.  The BOJ stopped devaluing the yen, and the yen carry trade is a mere shadow of its former self.  So, when TNX began another leg down a year ago, stocks followed along just like in the good old days.   Instead of rising 14.8%, SPX fell 14.9%.

    The last stretch of the decline occurred when TNX plunged below our 20.21 line in the sand (the yellow arrow.)  As mentioned above, that led to a 138-pt (7%) decline in SPX.  It was followed by a 108-pt bounce when TNX popped back above support.  But, when the bounce failed two days later, SPX plunged 137 points.

    Fortunately for bulls, TNX ran into strong support at the .886 retracement of its rally from 13.94 in Jul 2012 to 30.36 in Dec 2013.  It was the same day USDJPY and CL bottomed, so stocks had a lot of help in kicking off a strong rally.

    2016-05-24 TNX v SPX 60 2100While SPX rallied strongly for several months, TNX ran out of steam after just one.  It has since put in two lower highs — hardly the sort of behavior one would expect if higher rates are, indeed, right around the corner.

    On the other hand, it’s hard to miss the triangle pattern setting up over the past several months.  IMO, it’s not so far off the lows that it qualifies as a legitimate pennant pattern.  But, it obviously represents a coiling of sorts — exactly the sort of pattern one would expect with a rate decision coming up next month.

    Stay tuned.