

There’s an old saying: never let a good 3-day weekend go to waste when the market needs propping up in the weeks leading up to a rate hike.
Not really. I made that up. I’m not sure it’s going to catch on, either. But, it might…if more investors took a good, hard look at all the shenanigans that go on around 3-day weekends.
I looked back at the past 15 Memorial Day weekends to get an idea what we can expect over the next several days. Spoiler alert: there’s a very high incidence of major market manipulation — the momentum-changing variety. And, it wasn’t always successful.
For details, read on. The yellow arrows in each chart refer to the day markets reopened after each Memorial Day weekend.
May 30, 2000
SPX gapped back above the 200-day moving average, then bounced 7.6% over the next six sessions. This occurred shortly after stocks made a new all-time high at the height of the tech bubble. May 29, 2001
SPX did its best to hold above the SMA100 it had just gapped above (breaking the falling trend line in the process.) Ultimately, it couldn’t stop the tech bubble from bursting. SPX dropped 26% in the next four months.
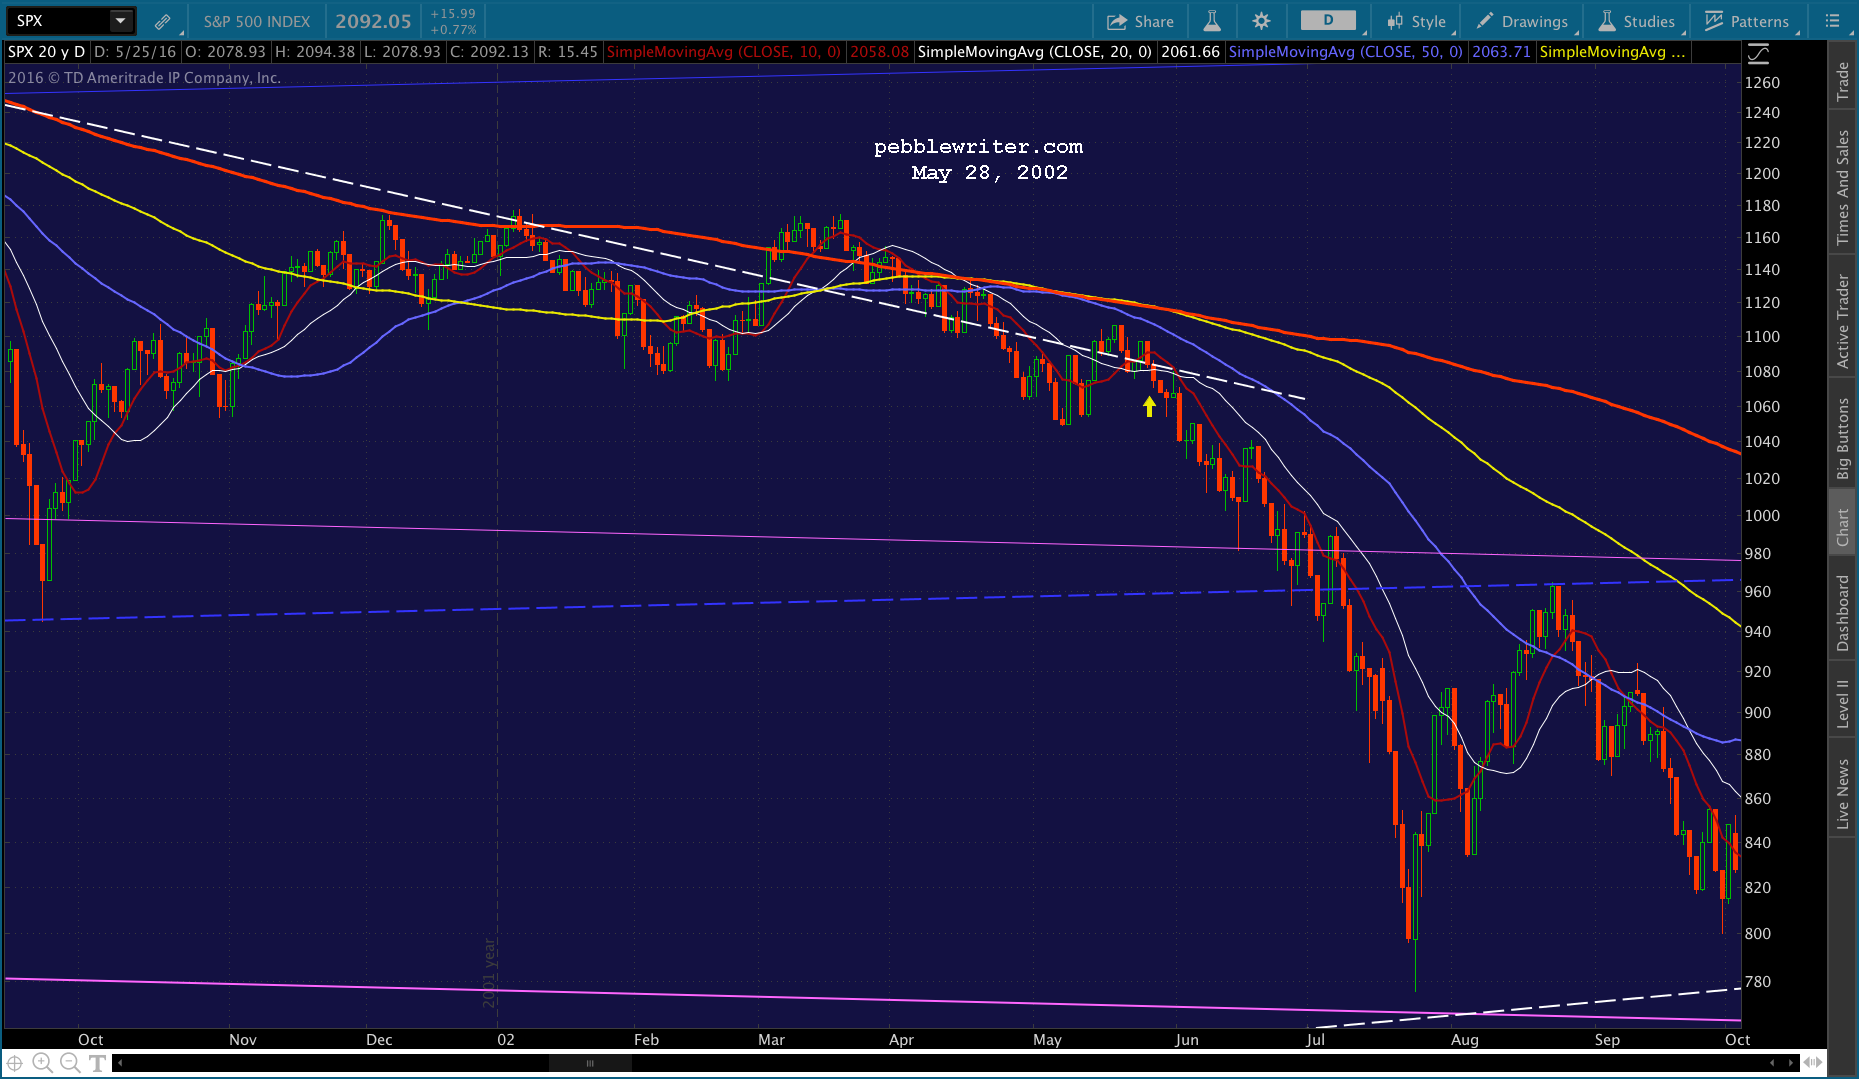
 May 28, 2002
Again, SPX tried and failed to hold a breakout. It led to a 23% drop in the next two months.
 May 27, 2003
SPX gapped above two important trend lines as well as its moving averages. SPX gained 8% in the next three weeks. It marked the end of the tech bubble crash.
 June 1, 2004
Nothing spectacular here — just kept a strong bounce intact and held the SMA50.
 May 31, 2005
This day was about playing defense. SPX had twice tried, and failed, to retake 1200. On May 31, the pullback was limited to a channel midline and the 10-day moving average in order to allow 1200 to broken the following day.
 May 30, 2006
More defense. SPX fell 20 points from the Friday before the close, but managed to hold the line at the 200-day moving average. The battle was lost a few days later, but the war was won when the bottom of the rising purple channel from 2004 held.
 May 29, 2007
SPX had just topped 1500, but had run into the midline of a channel dating back to 2003. It needed to hold on to its gains, and a push back above the SMA10 over the weekend helped it do so. It bounced for two more days, before continuing lower in the crash of 2007-2009. It wouldn’t see those prices again until  May 27, 2008
After having lost 320 points from new all-time highs the previous October, SPX had just bounced up to trend line resistance and the 200-day moving average. Memorial day weekend provided a nice bounce at the SMA50.
 Unfortunately, the bounce only lasted two days.
 May 26, 2009
This one’s kinda special. After crashing 58% since October 2007, SPX was considering breaking out of the huge falling channel that guided it lower.
The smart move might have been to allow a deeper dip in May to set up an inverted Head & Shoulders pattern. But, they powered it right on through and put in a small right shoulder after topping the SMA200. It’s all good.
 June 1, 2010
Ah, ha, ha, ha, stayin’ alive. Stayin’ alive. SPX plunged 2%. Fortunately, the Ben-Gees were ready with another round of QE.
 May 31, 2011
This bounce came a few weeks after I started publishing my research on May 2 — thinking that a top was near. It shook my confidence, as SPX broke out of a well-formed falling channel. It sure looked like a breakout, so I was more than a little nervous as I posted that day:
If [the push to 1381] doesn’t happen by Monday, then the drop from May 2 was IT.
Thank you, oh wise and powerful chart gods. May 29, 2012
After clawing back to the 2011 highs, SPX finally reached the 1381.50 Fibonacci target — but formed a Head & Shoulders pattern and completed a Butterfly pattern in the process. May 29’s bullish-looking bump proved to be a 1% head fake in the midst of an 11% correction. 
May 28, 2013
An unremarkable 0.6% bump in the midst of an 8% correction. It didn’t matter, as SPX was backtesting the 2007 highs.
May 27, 2014
This one was a bit of a dud — a 0.5% pop over horizontal resistance. Just another day in paradise.
 May 26, 2015
SPX closed the Friday before Memorial Day weekend just a few points away from our long-held 2138 target. No doubt, most traders went comfortably long into the three-day weekend.
After having pointed out the dangers two days prior [The Last Big Butterfly], I was anything but comfortable. But, I was surprised all the same to see SPX dump 22 points when the markets reopened.
 By the time the dust had settled 3 months later, SPX had shed 12.2% and May 20 was crowned the new all-time high. A year later, it still is.
 Lessons Learned
Of the sixteen Memorial Day weekends since 2000, seven have been seen SPX fall on the following Tuesday. Losses averaged 12.4 points. The other nine Tuesdays saw SPX rise by an average of 15.4 points.
 The biggest gains occurred when SPX was trying to recover from a sharp decline and needed support. The biggest losses occurred soon after new highs or an extended rally such as we’ve experienced this past several months.
Bottom line, markets like 3-day weekends for the same reason that muggers enjoy dark, moonless nights. It’s easier to accomplish the task at hand when no one’s around to notice.
With SPX only 35 points from new all-time highs, it would seem an ideal time to push through resistance. What better opportunity? Of course, that’s what folks thought last Memorial Day weekend.
We have a rate hike coming up, possibly next month. Things didn’t go so well the last time the Fed hiked rates [see the Bonus Charts below.] Watching the dollar spike today, I’m apparently not the only one who remembers.

Bonus Charts:
The last time the FOMC actually raised the discount rate was Dec 16, 2015. The markets reacted with their usual rally.
The Fed likes to “help” markets rally on FOMC announcement days. It reassures investors that the FOMC has their backs, and won’t let anything bad happen.
 In this case, SPX actually broke trend and popped above the 200-day moving average — a very strong reaction.
  But, of course, it didn’t stick. After the support was withdrawn, SPX dropped like a rock.
 If it plays out like this again, look for the US dollar to make another strong move.