

It was five years ago today that I first got it into my head to write about the markets. SPX, in particular, seemed like it was topping out. I wrote two posts that day that laid out what I thought was a pretty good charting argument for a decline:
Charts for May 2, 2011 and Collision Looming?
My charts were arguably simpler and easier to read back then — as were the markets.
 As it turned out, May 2, 2011 was the high for the year. SPX dropped from 1370 to 1074 before it was all over. It included a nifty analog that allowed us to call the July/Aug correction to the day/dollar, thus cementing my confidence in chart patterns.
 A lot has happened in the past five years, and that confidence has been tested many times — chiefly because central banks around the world have decided it’s not enough to establish monetary policies that would be beneficial to markets.
They’ve taken it upon themselves to reinflate the bubbles that existed in 2007 via the yen carry trade, suppressing interest rates, injecting vast sums of money directly into fixed income and even equity markets, and of course, the constant threat of more QE.
They, and their functionaries, have also made a concerted effort to understand, anticipate and deliberately bust major chart patterns that might have facilitated corrections — hence the countless H&S Patterns which have failed to play out over the years.
This morning, they (predictably) trotted out Warren Buffet to quiet the markets. But, the fact remains that a number of factors that have wrestled stocks higher over the past several months, not to mention years, are broken.
continued for members…
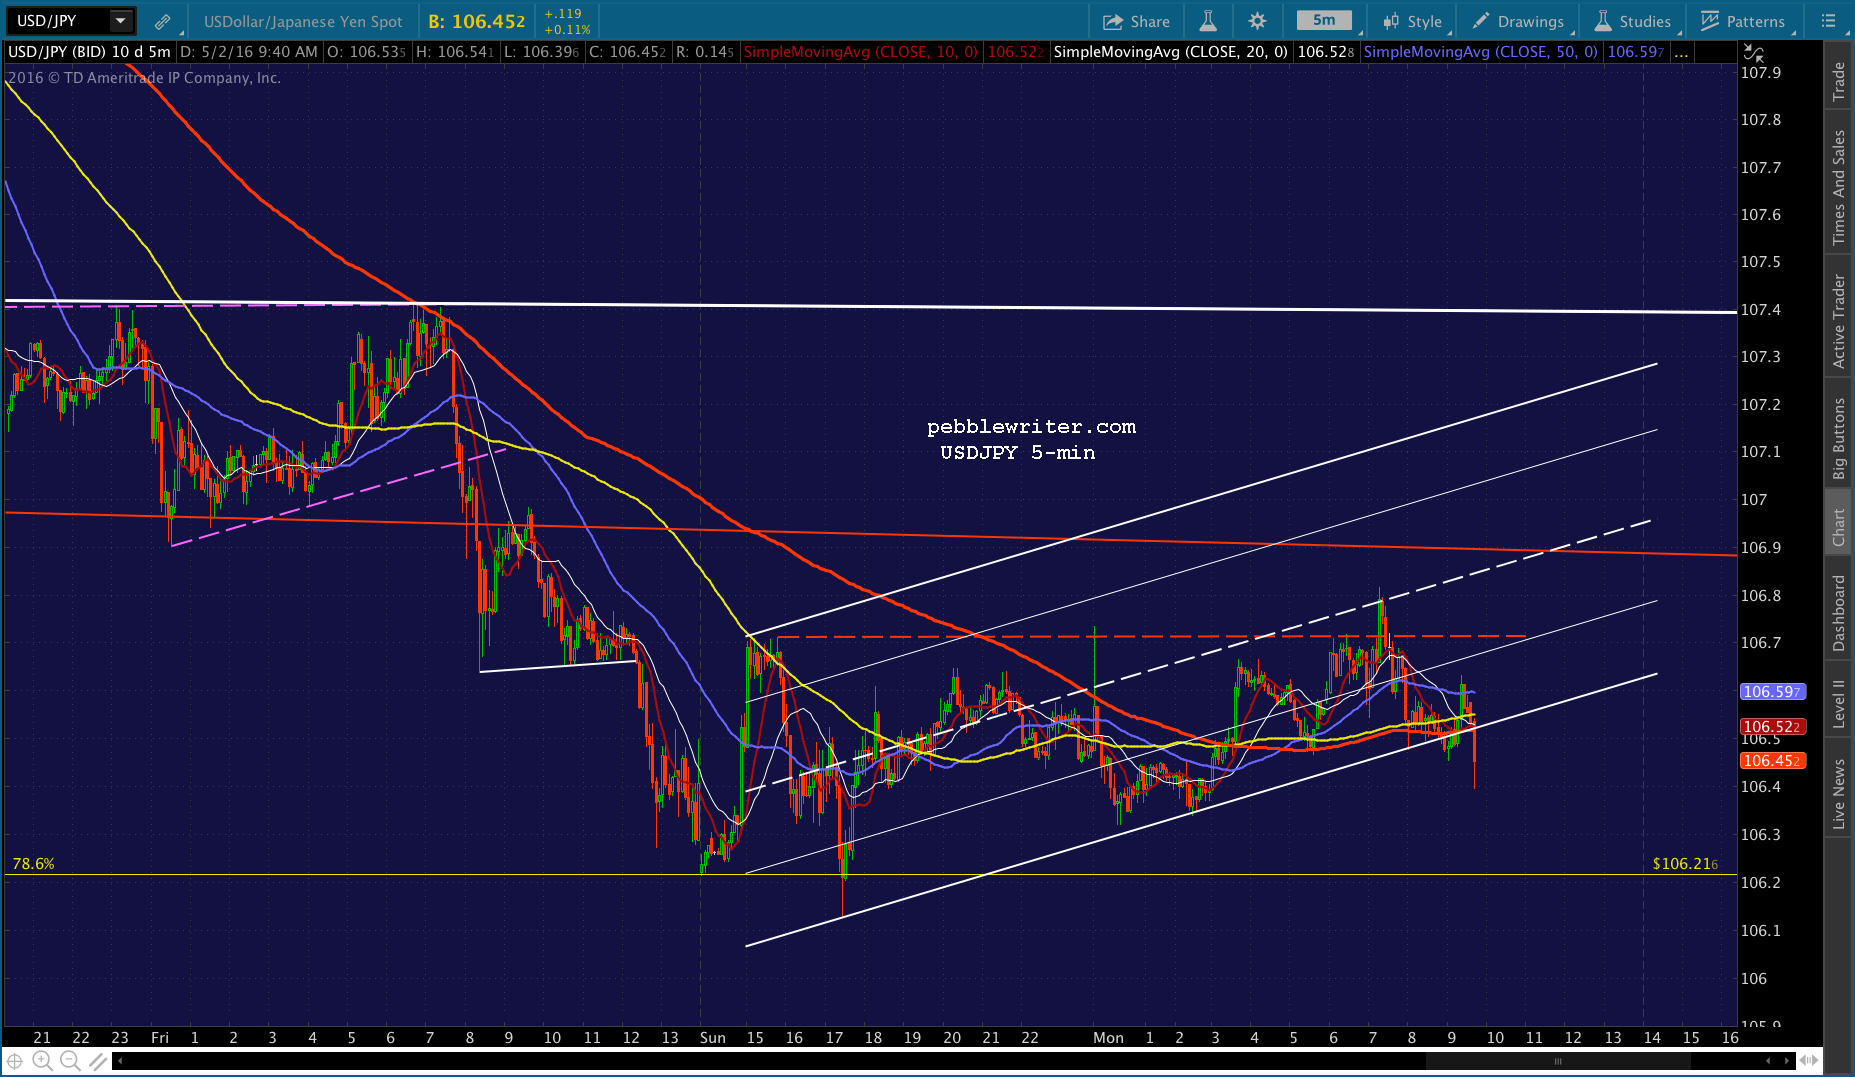
USDJPY has clearly lost the support of the rising purple channel from 2011, meaning the yen carry trade is on life support. It’s possible the yellow .786 will give it the bounce it needs, but it looks tenuous at best.
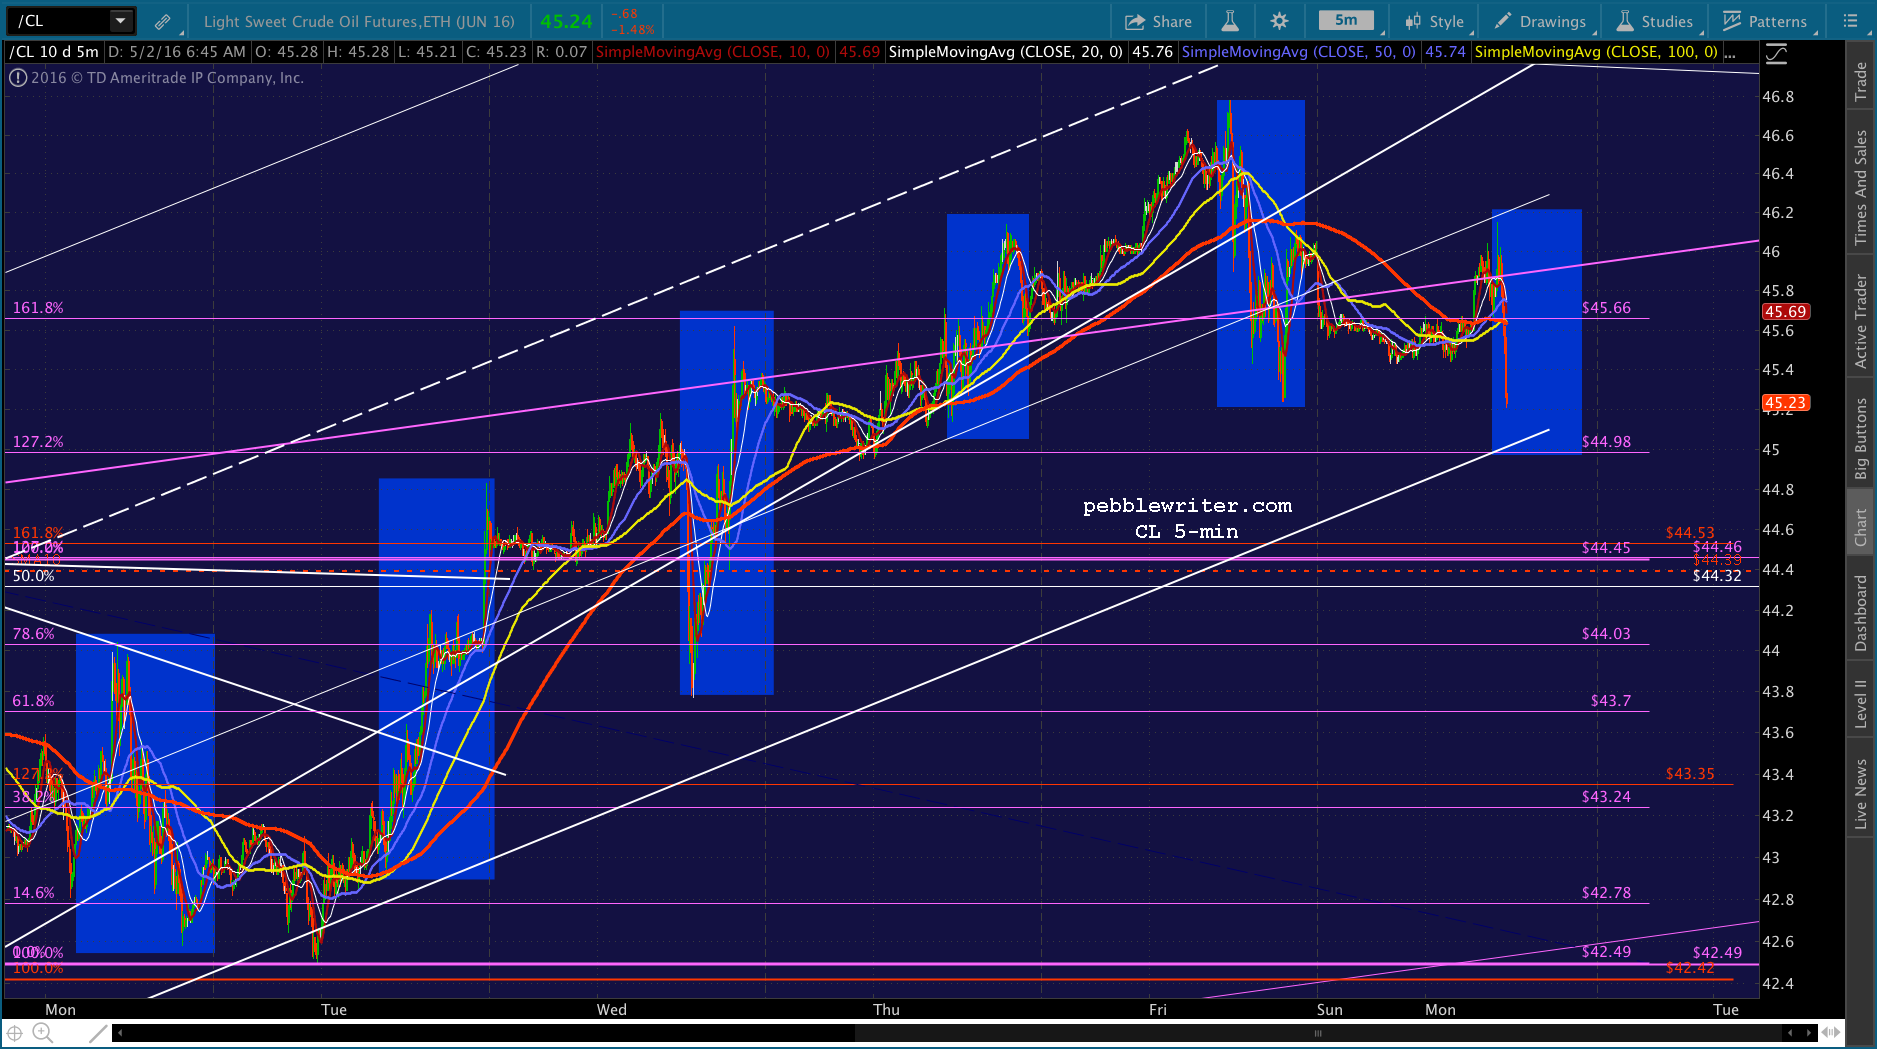
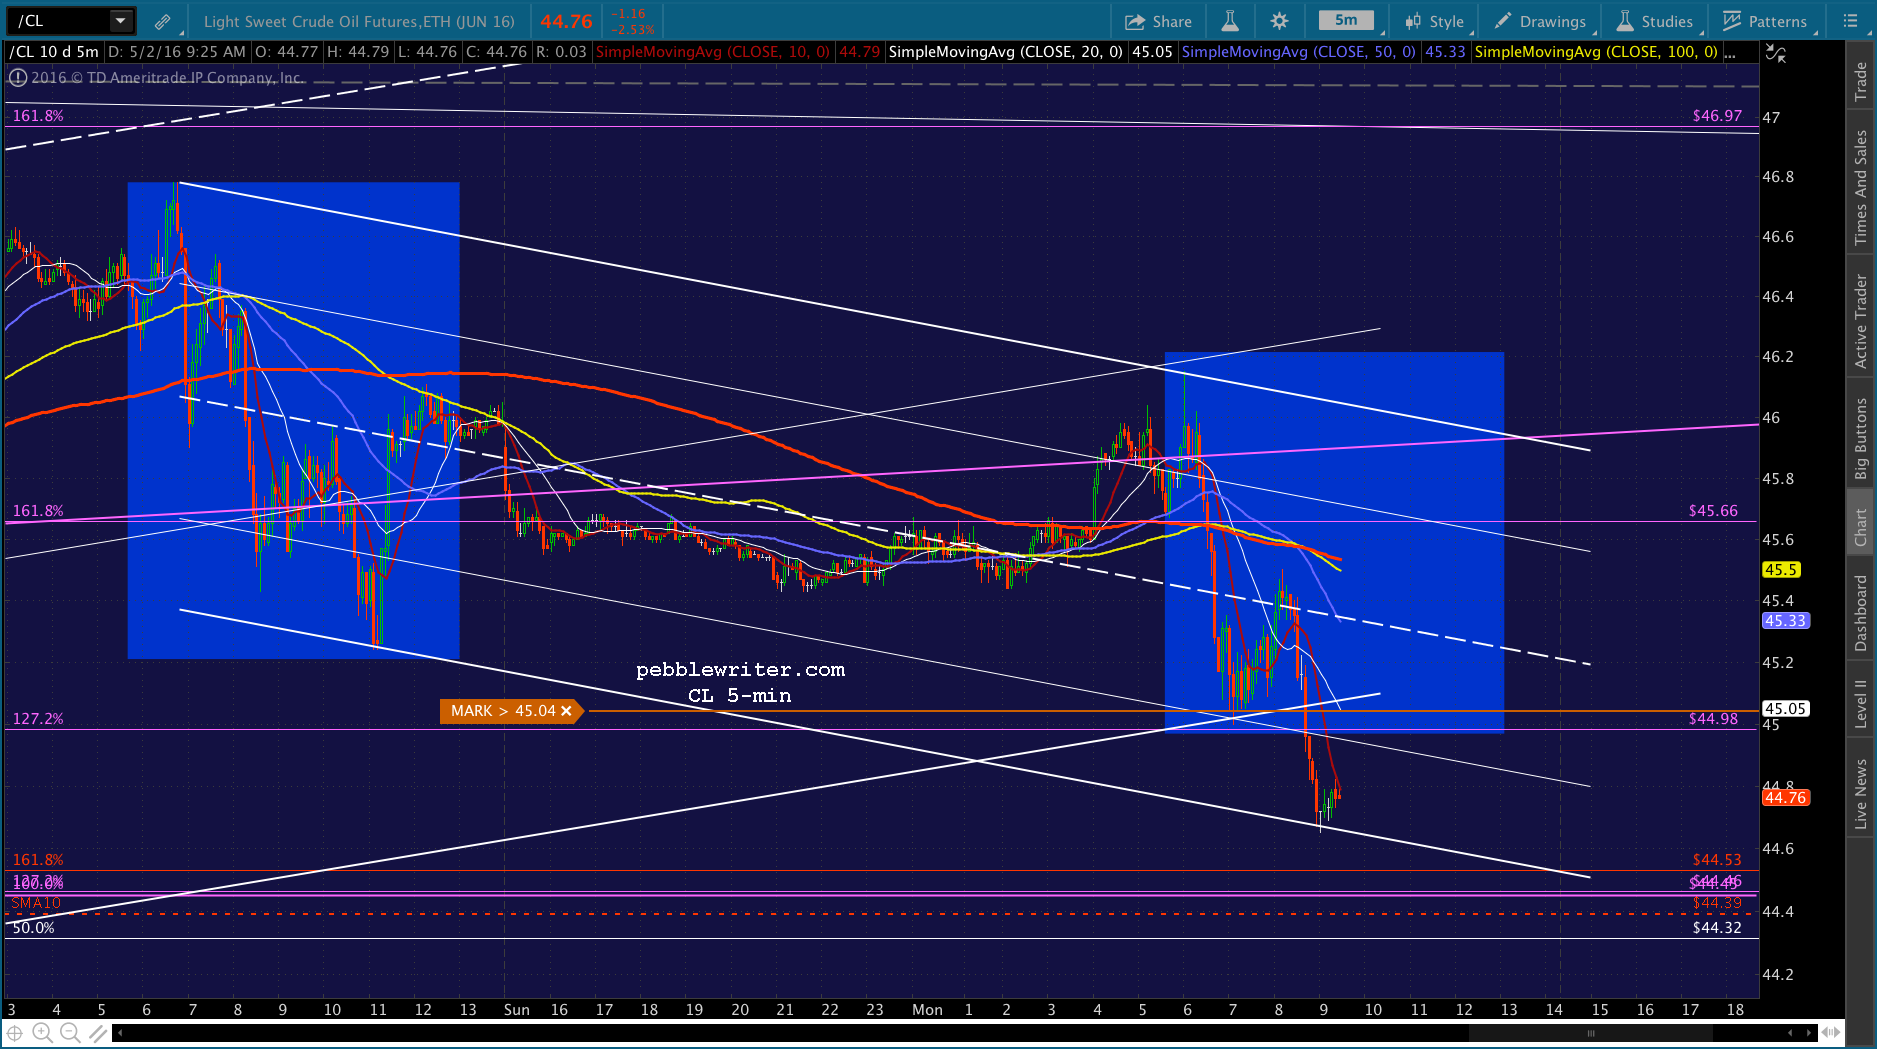
 CL has reached the top of the rising purple channel again. The rising white channel is in danger of breaking down, which would portend additional downside.
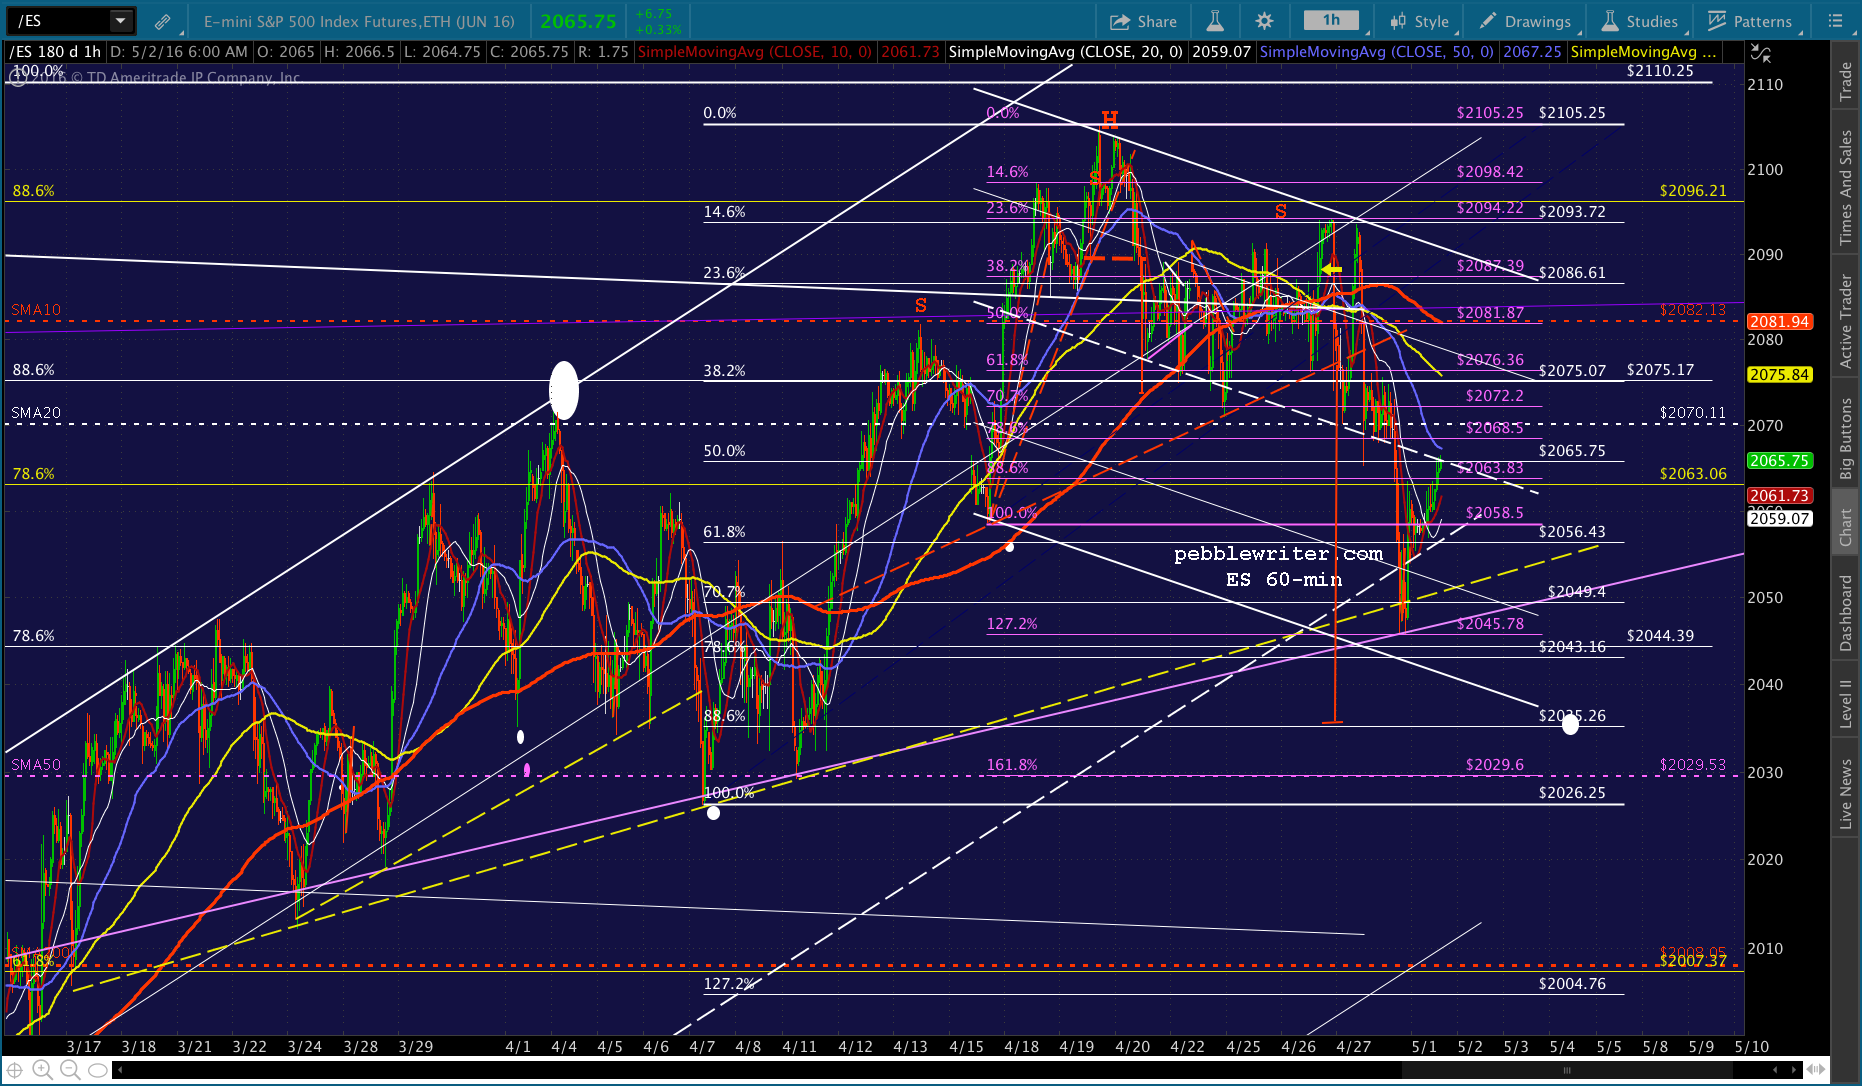
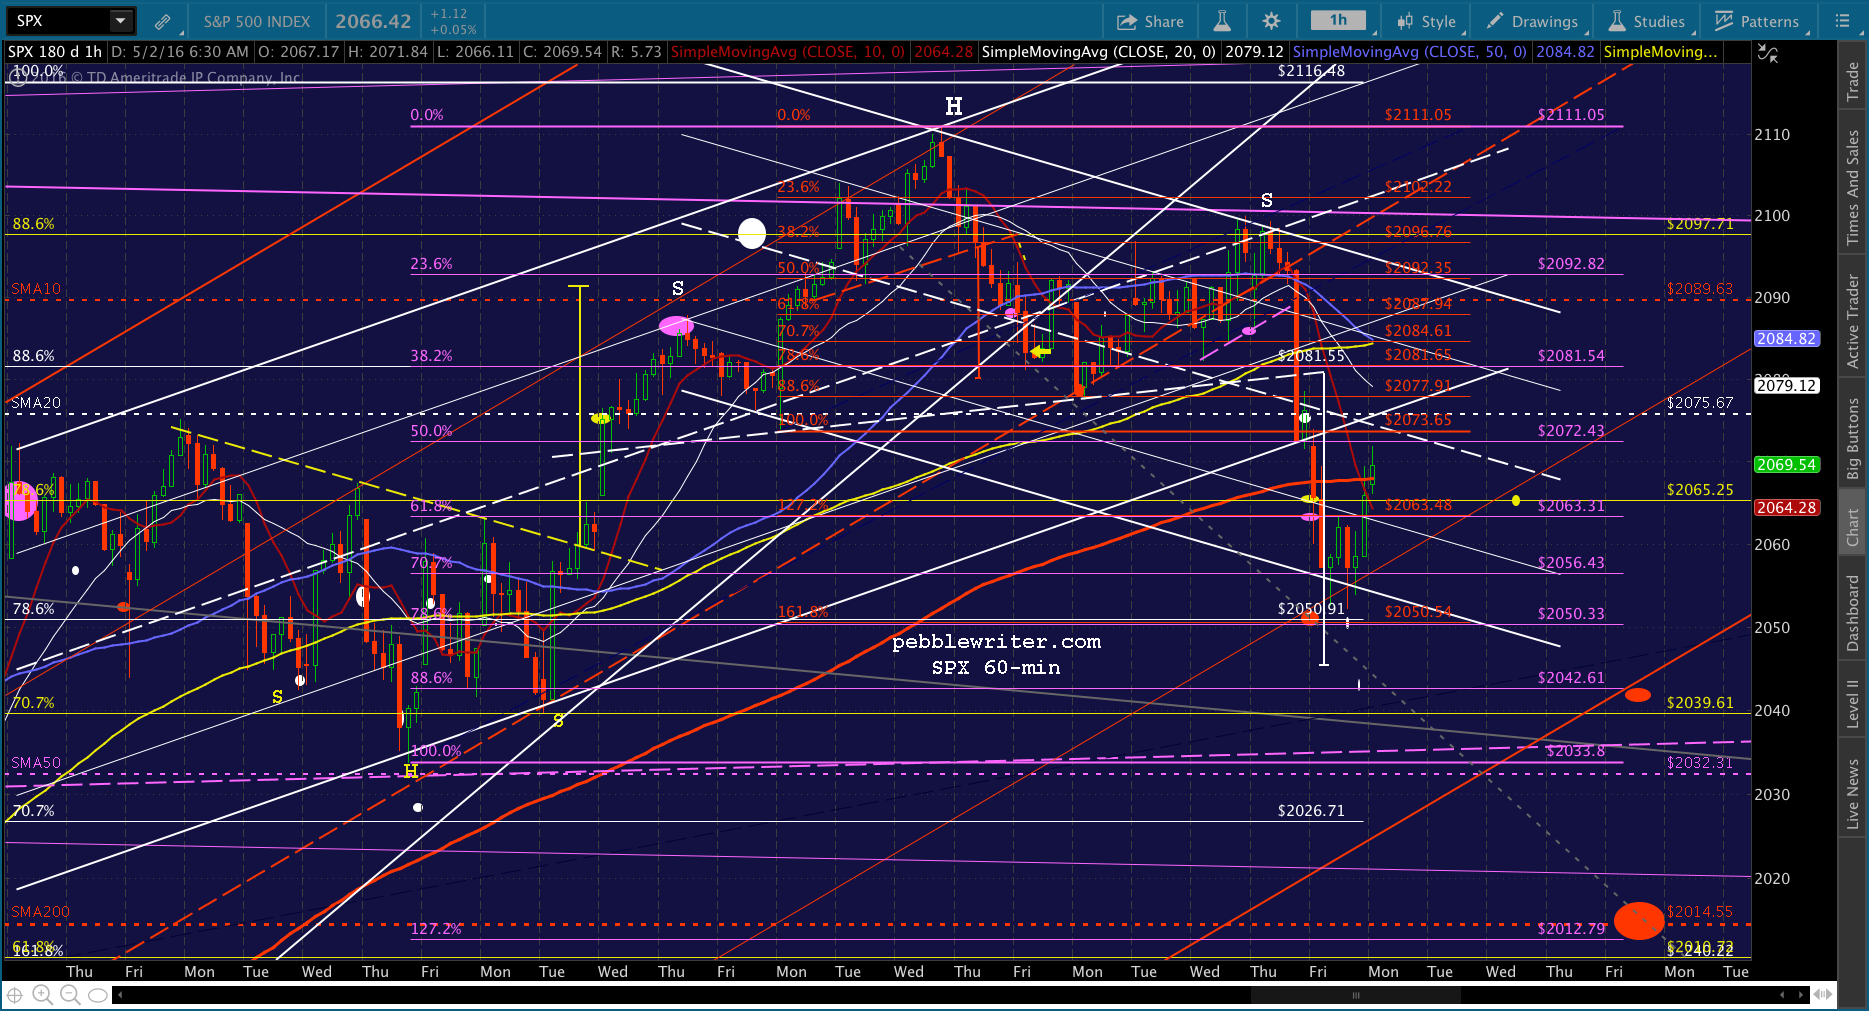
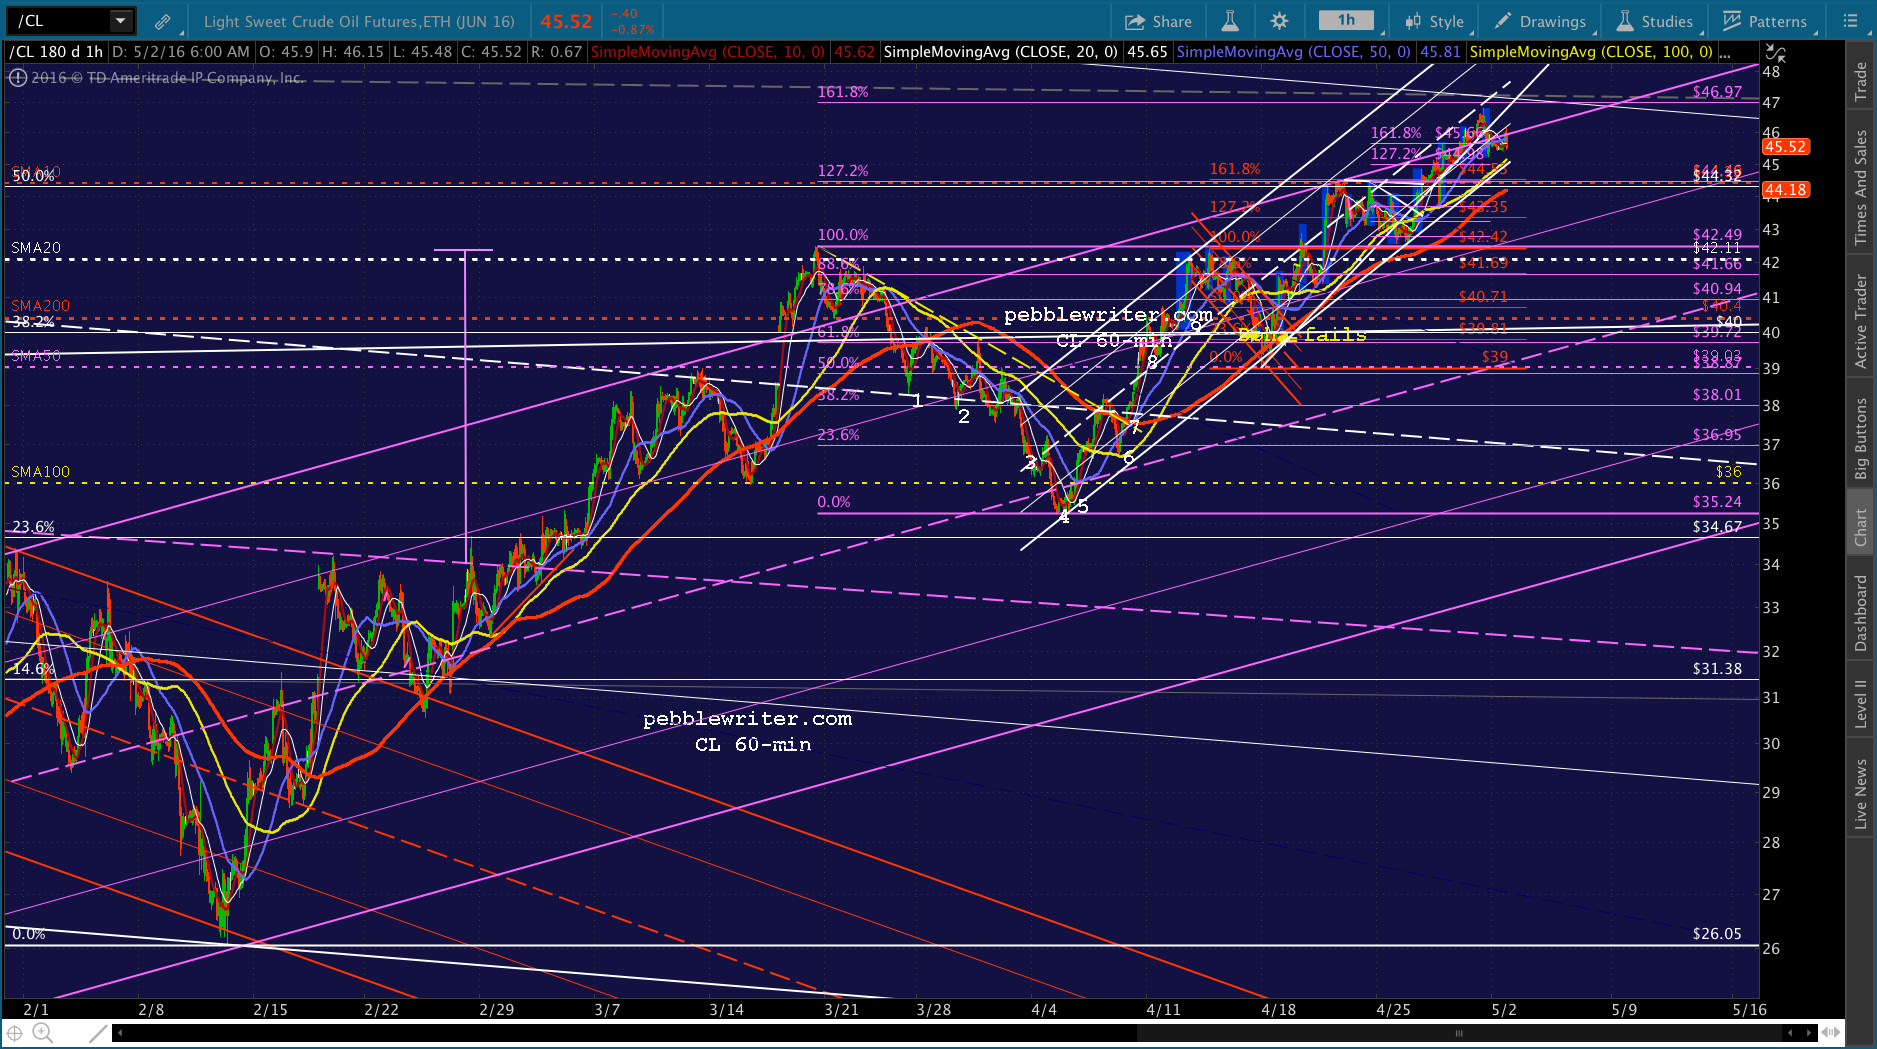 SPX looks a little lost, but like ES there are plenty of H&S Patterns to be found indicating lower prices ahead. Will TPTB allow them to play out?
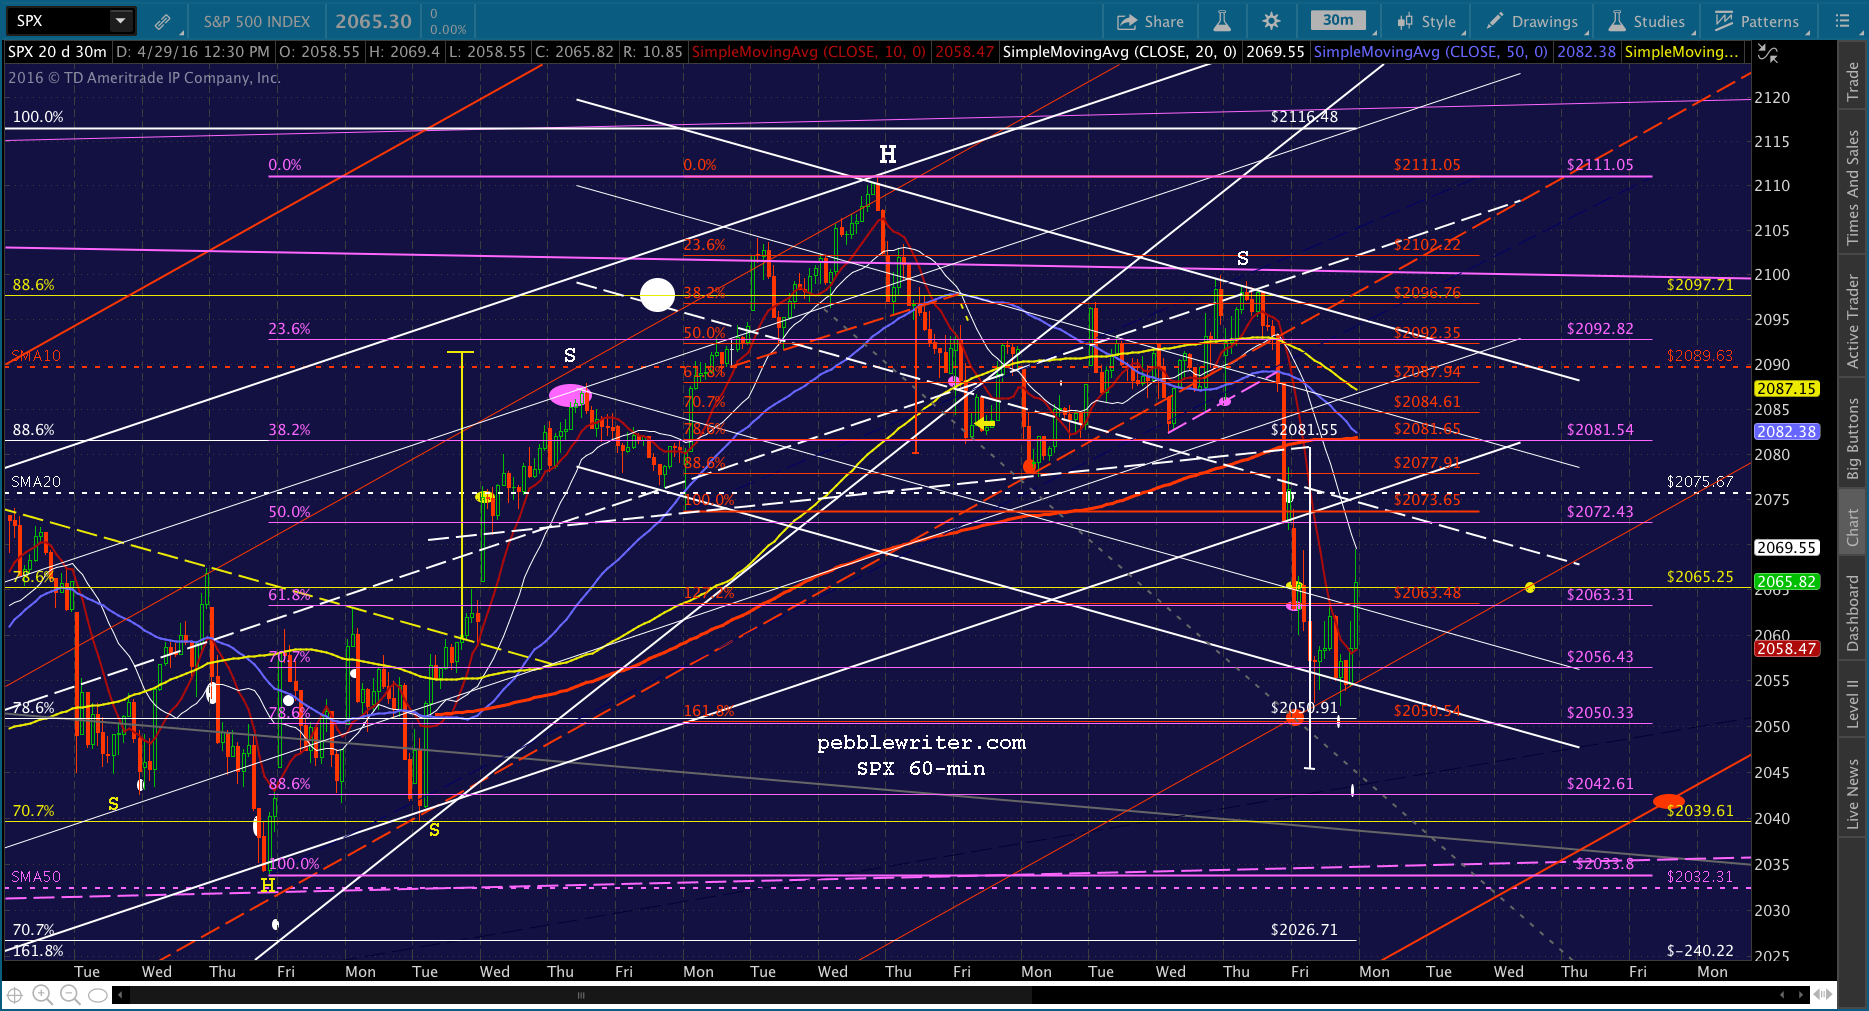
 UPDATE: 9:45 AM
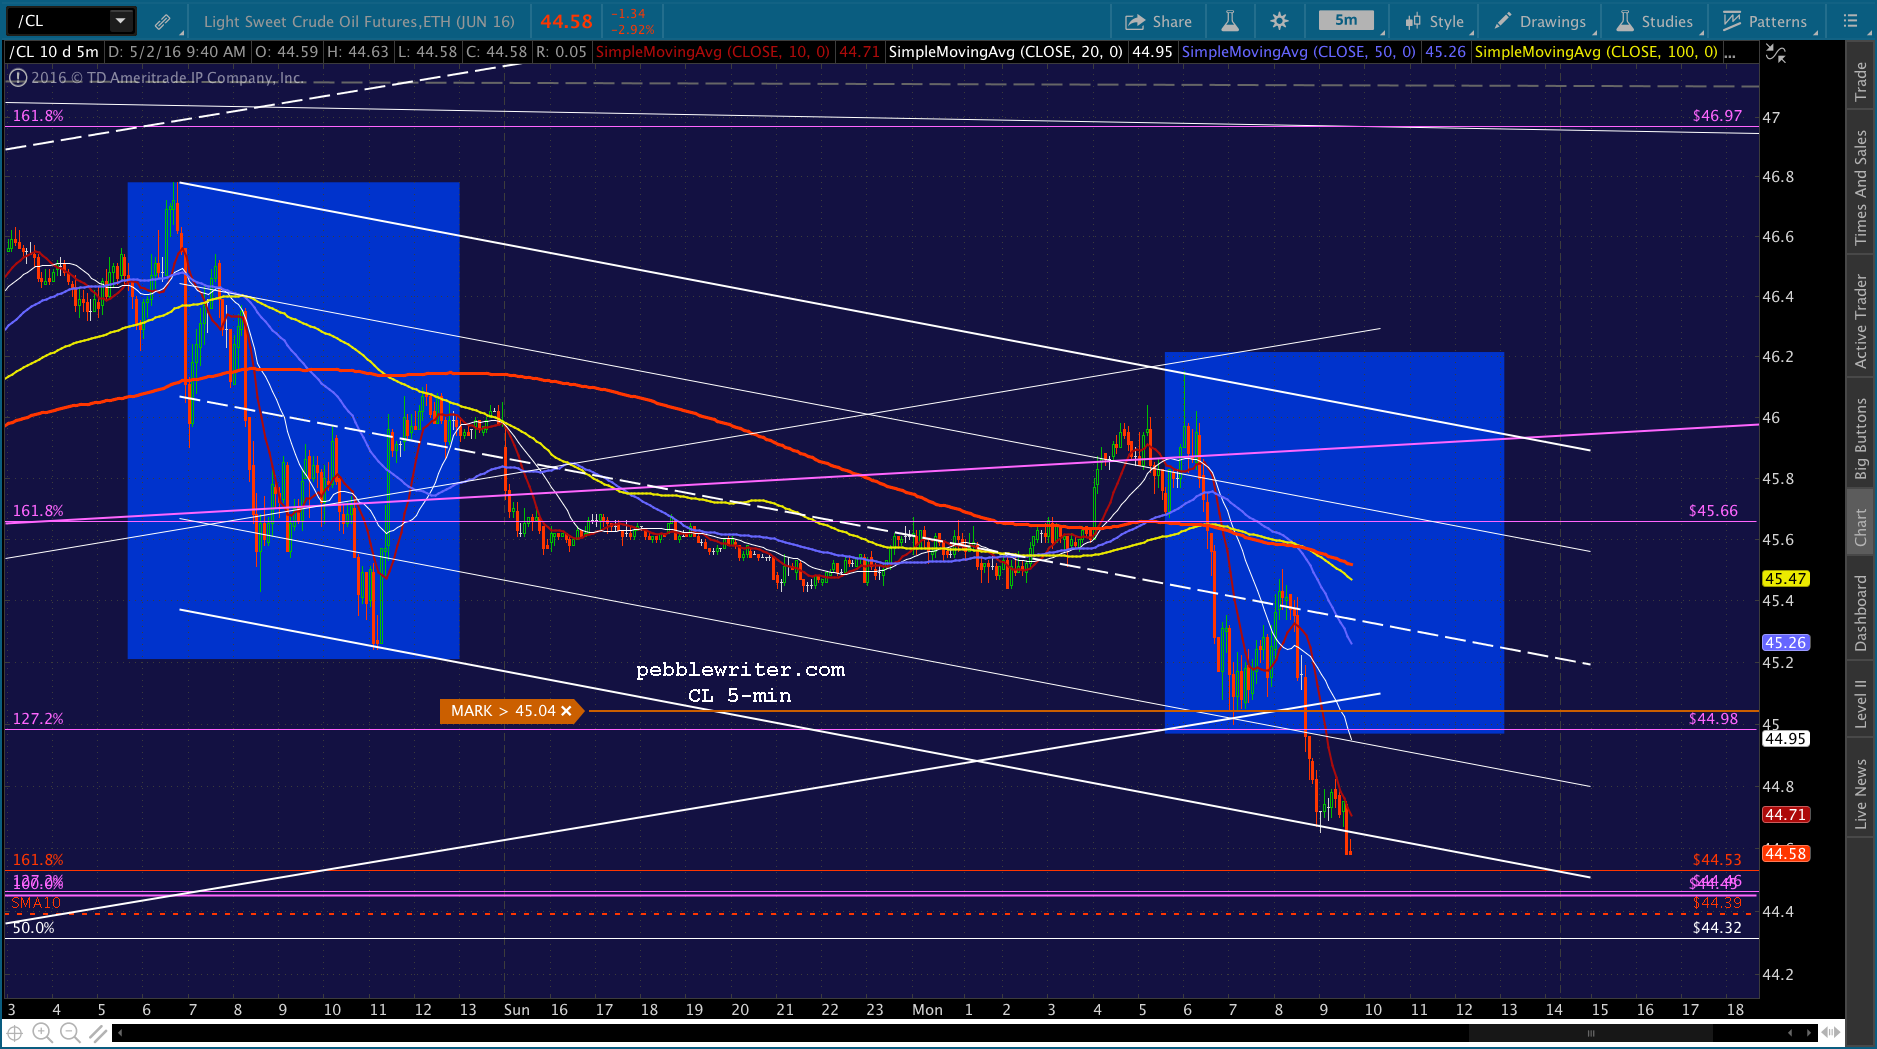
CL is tanking, and USDJPY isn’t compensating. I’d take a short position here and see if we can’t retrace Friday’s ramp.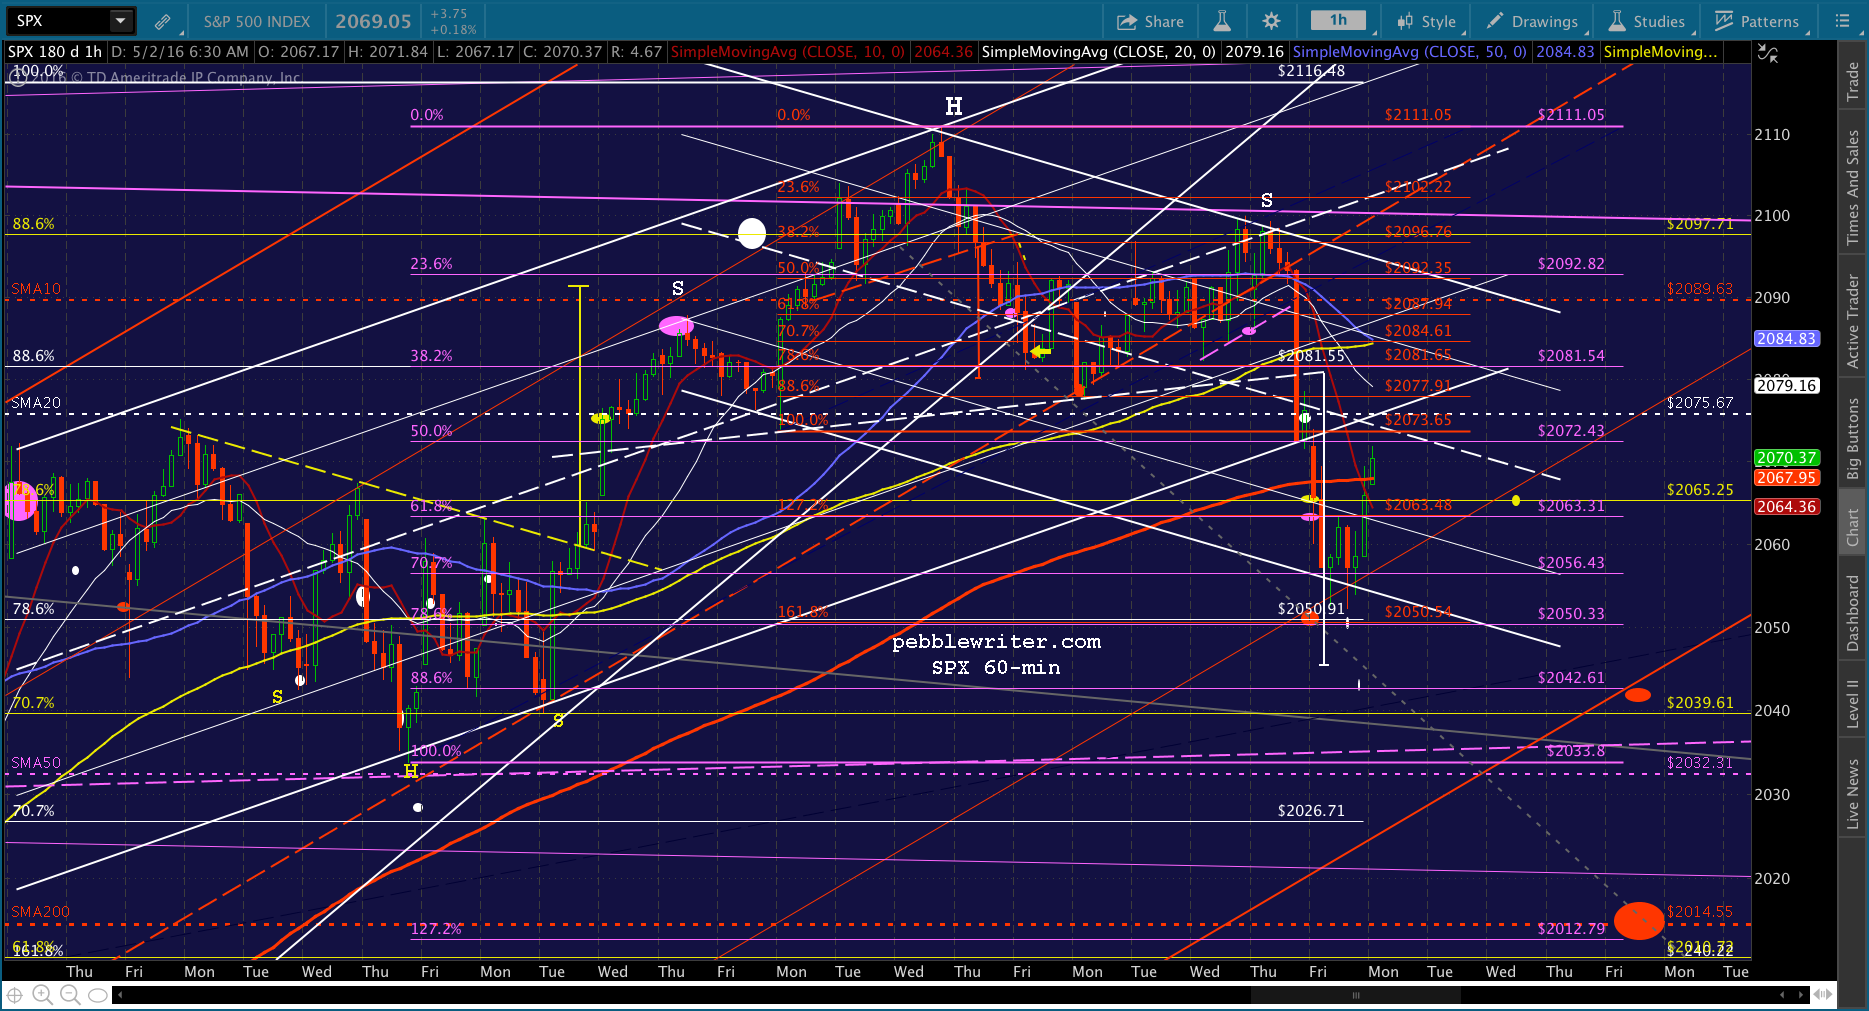
 UPDATE: 10:07 AM
CL has reached the bottom of the rising white channel, just above the purple 1.272. Be careful here, as we could see a bounce that rescues SPX from going negative. I think I’ll step aside and wait to see how it develops.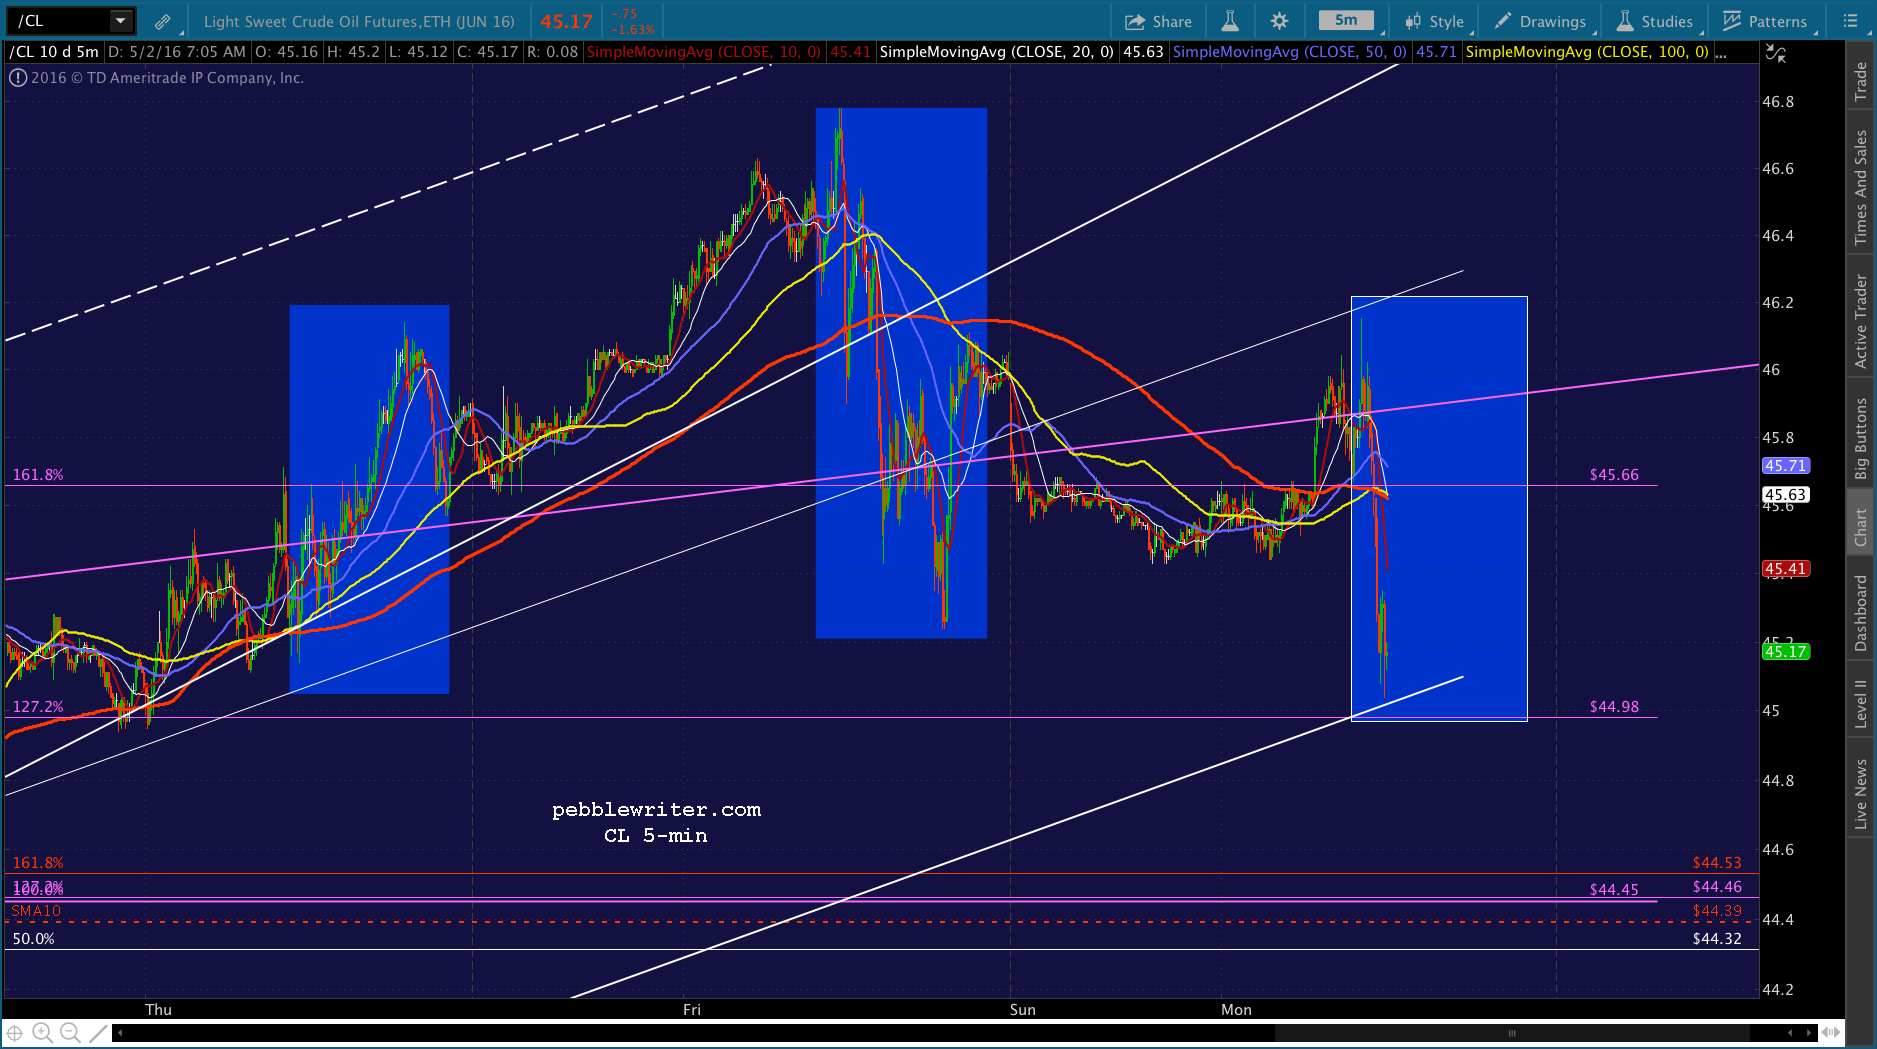
 Here’s the other danger to a short position — a breakout wouldn’t be all that difficult to manage.
 Judging from the 5-min chart, I’d say they’re aiming for the SMA20 sometime around the SMA5 200’s arrival later today. We’ll call it 2075.67. Of course, if CL breaks down, it won’t matter whether USDJPY pops up a little over that red TL.
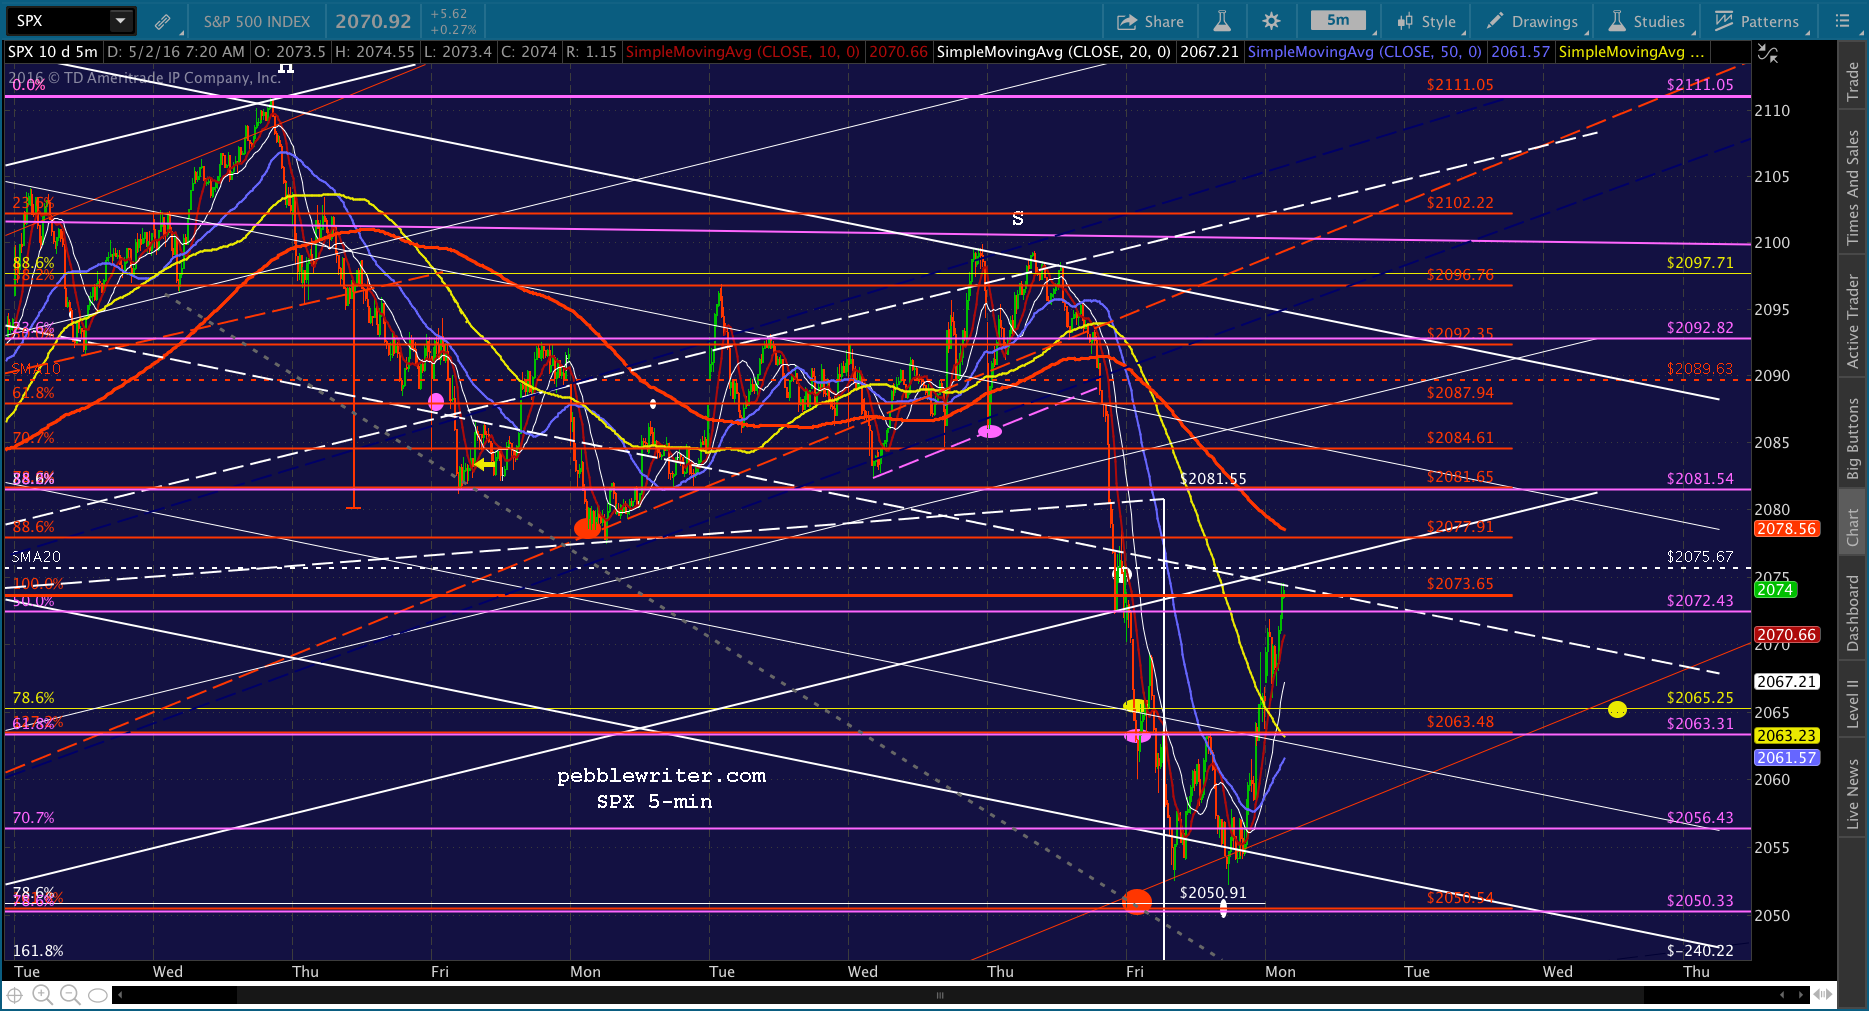 UPDATE: 11:45 AM
CL just broke down…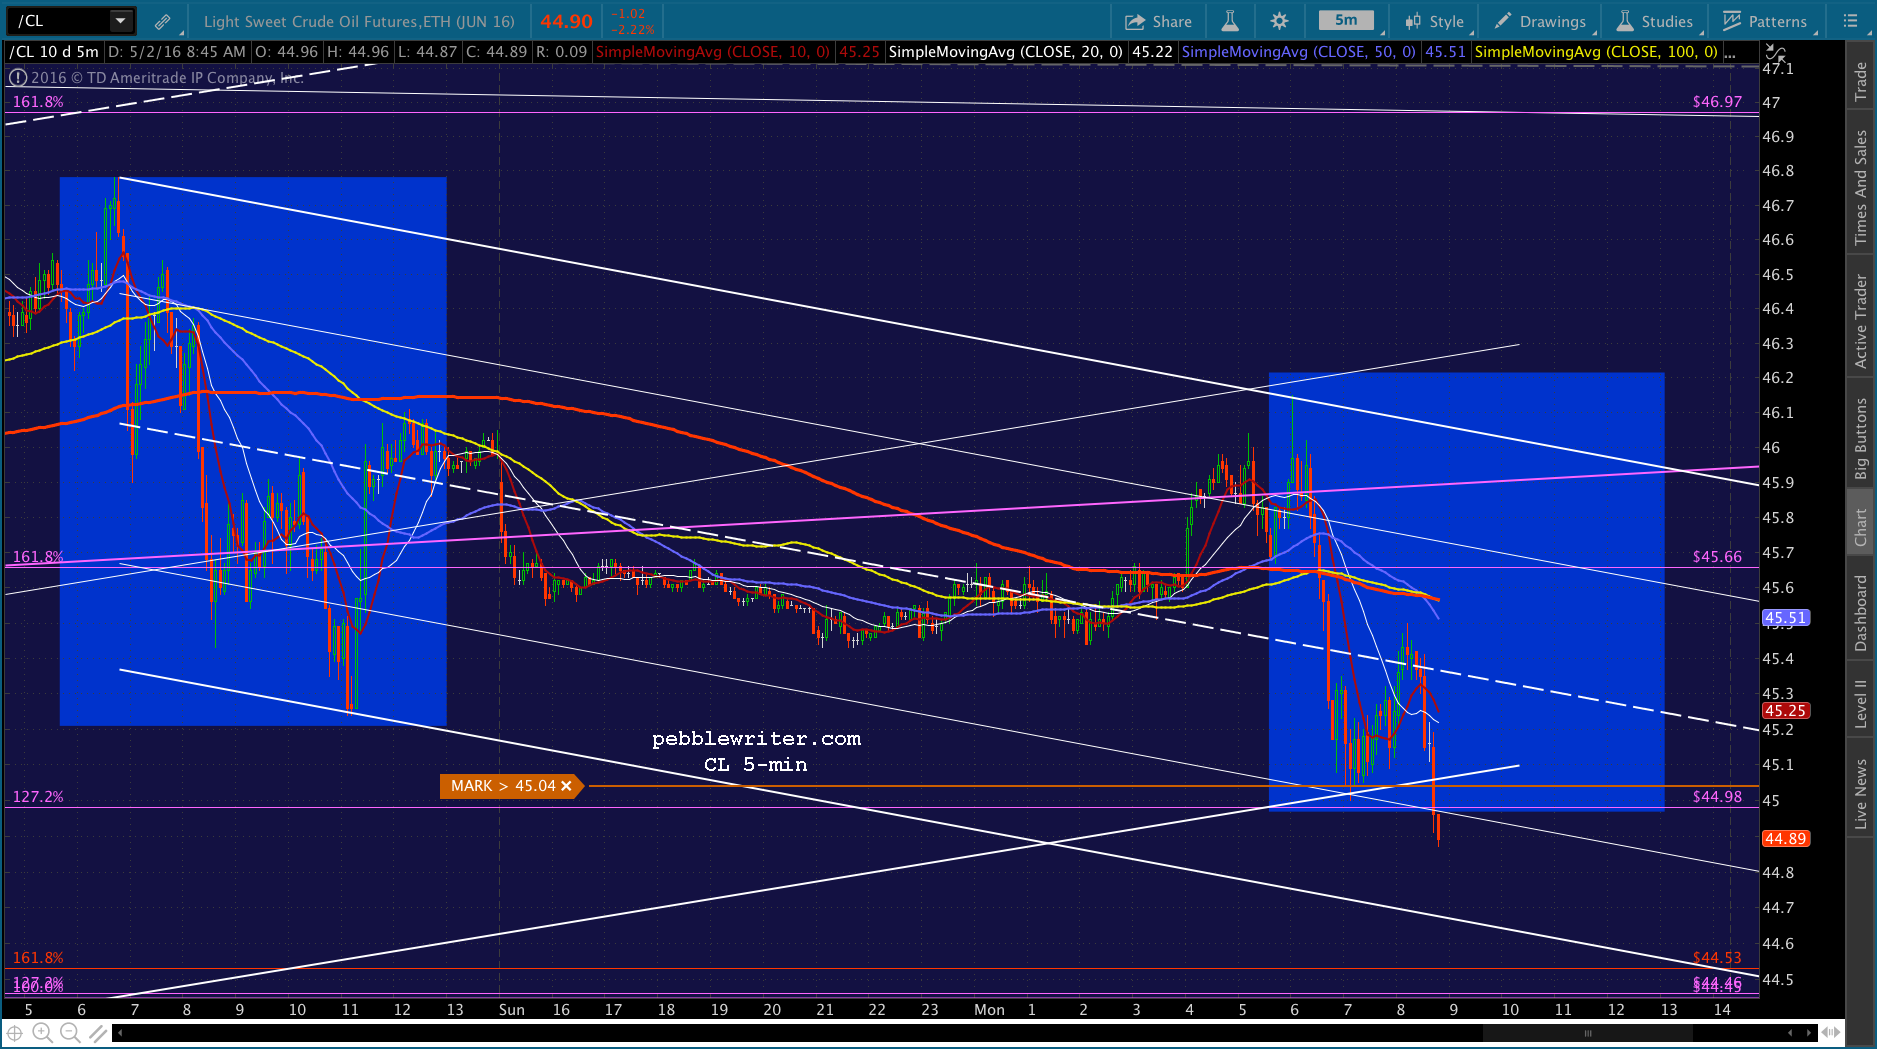 …so, back to short on SPX.
 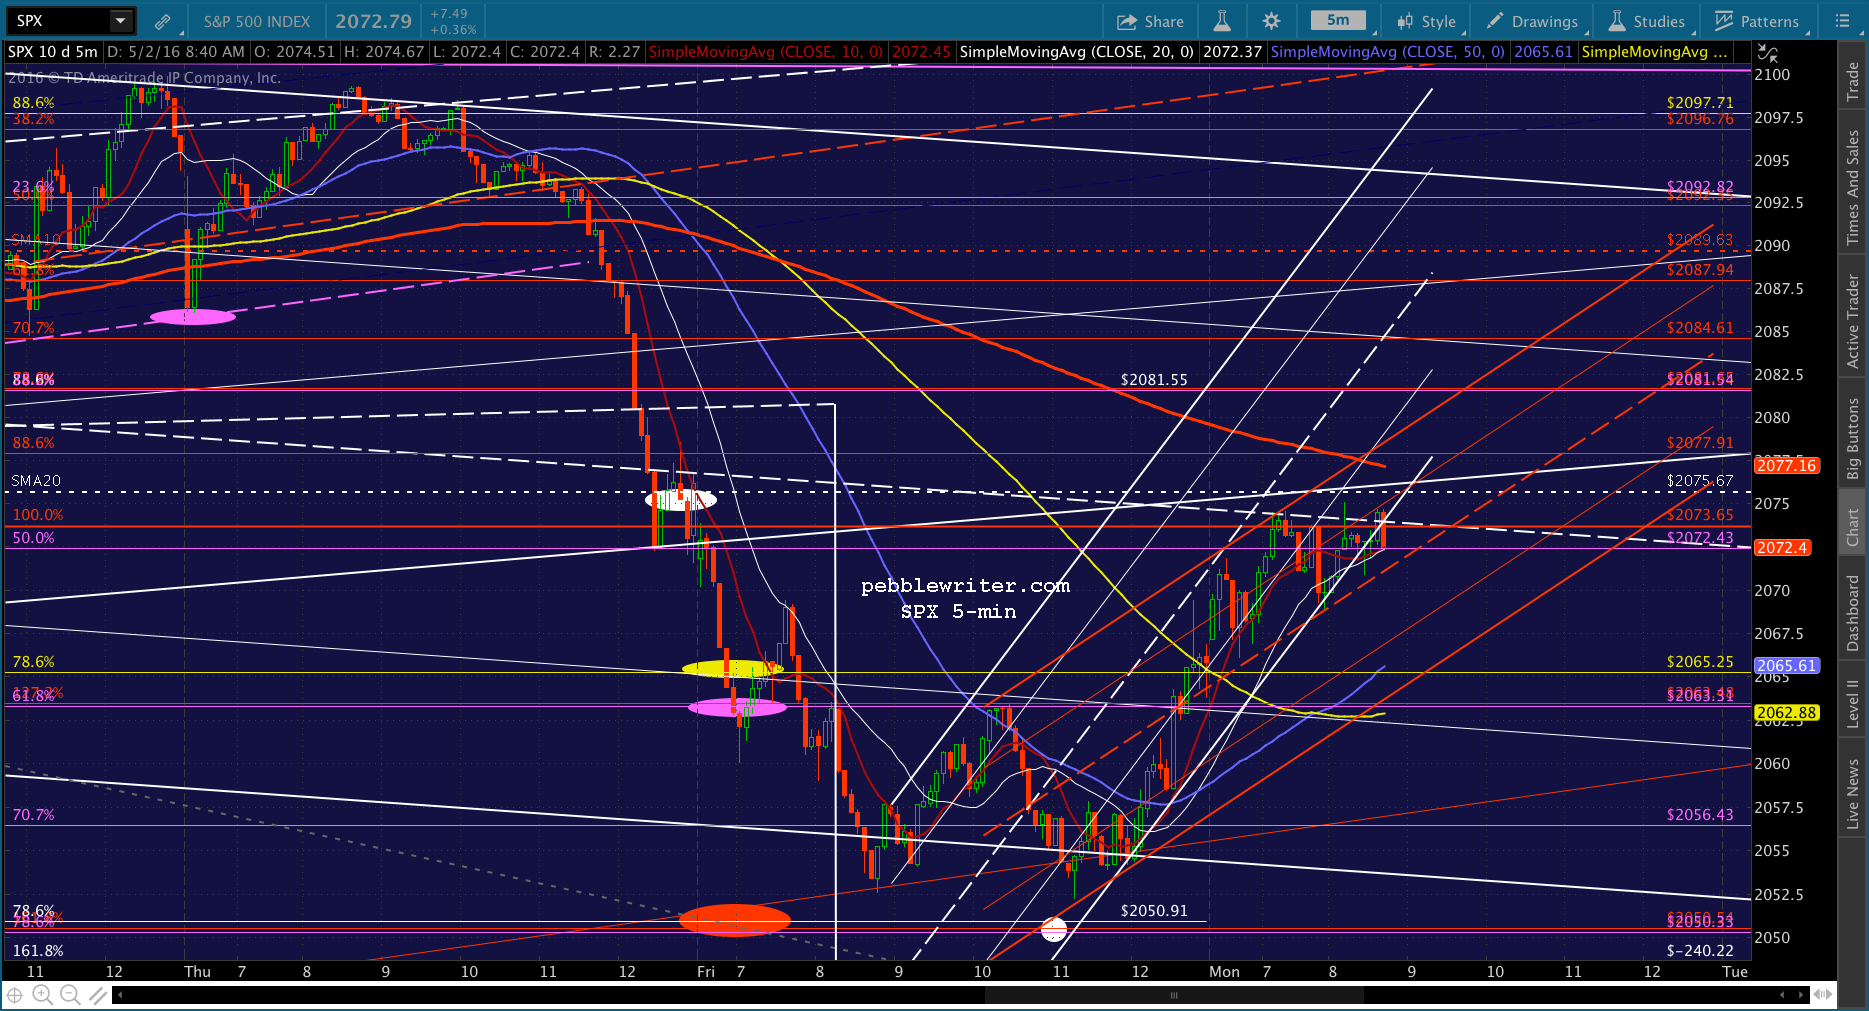 Obviously, USDJPY could spoil the fun with a strong rebound, but so far it’s remaining fairly docile.
 UPDATE: 12:07 PM
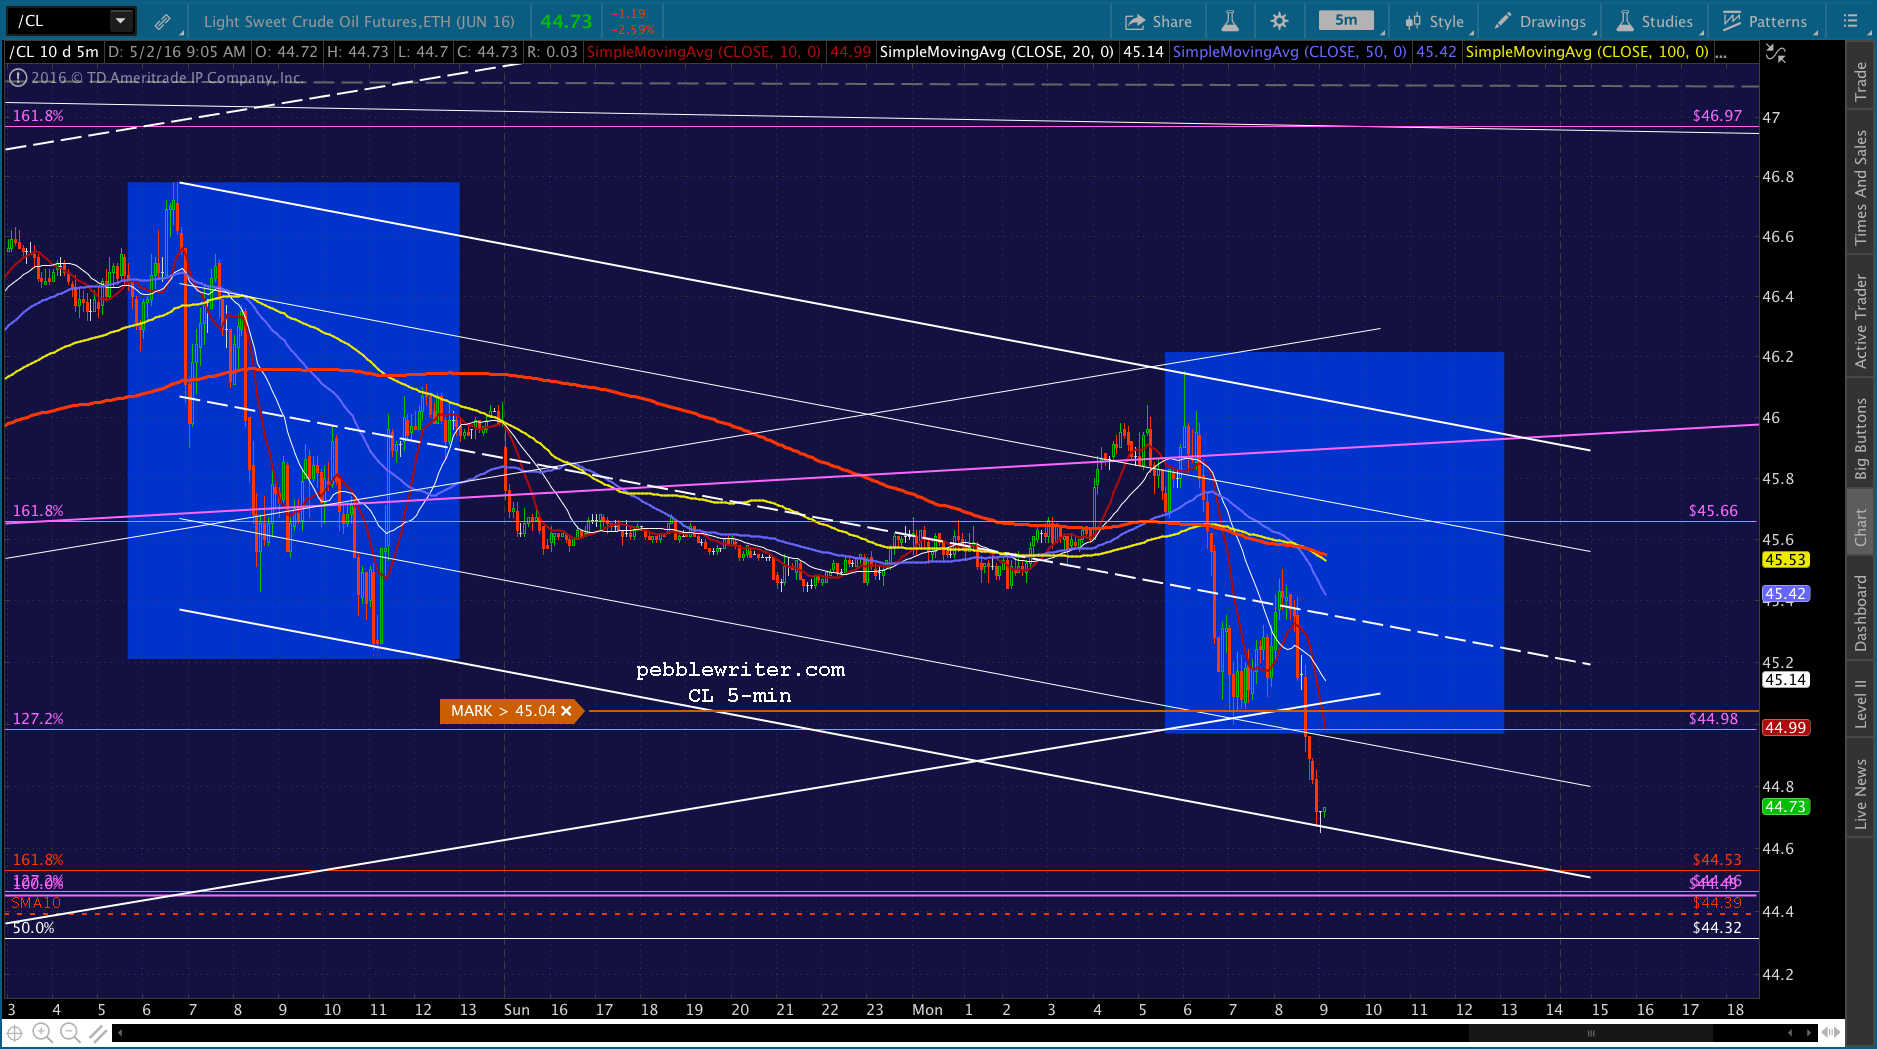
Not much action yet, as CL has now reached potential channel support and USDJPY hasn’t broken down.

 UPDATE: 12:23 PM
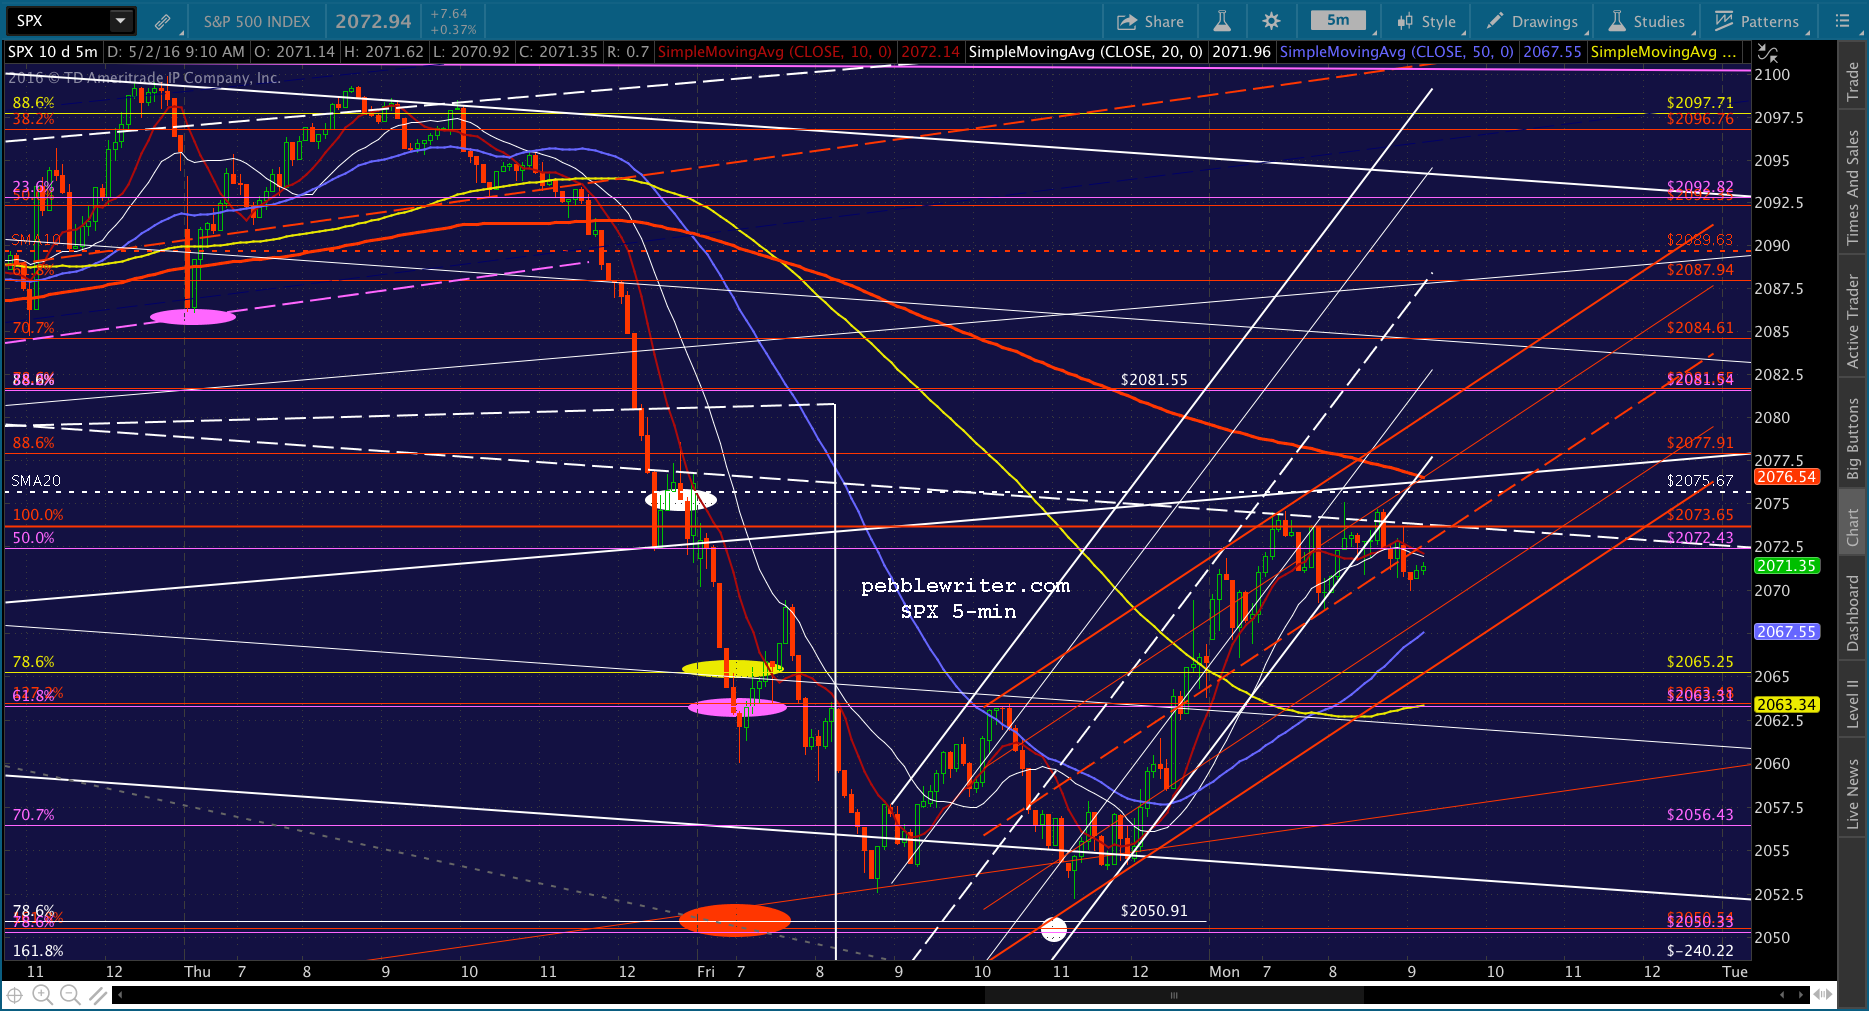
The SMA5 200 is approaching the sMA20 at 2075.67, and I still see that as the most likely path. So, it would be prudent to revert to cash here.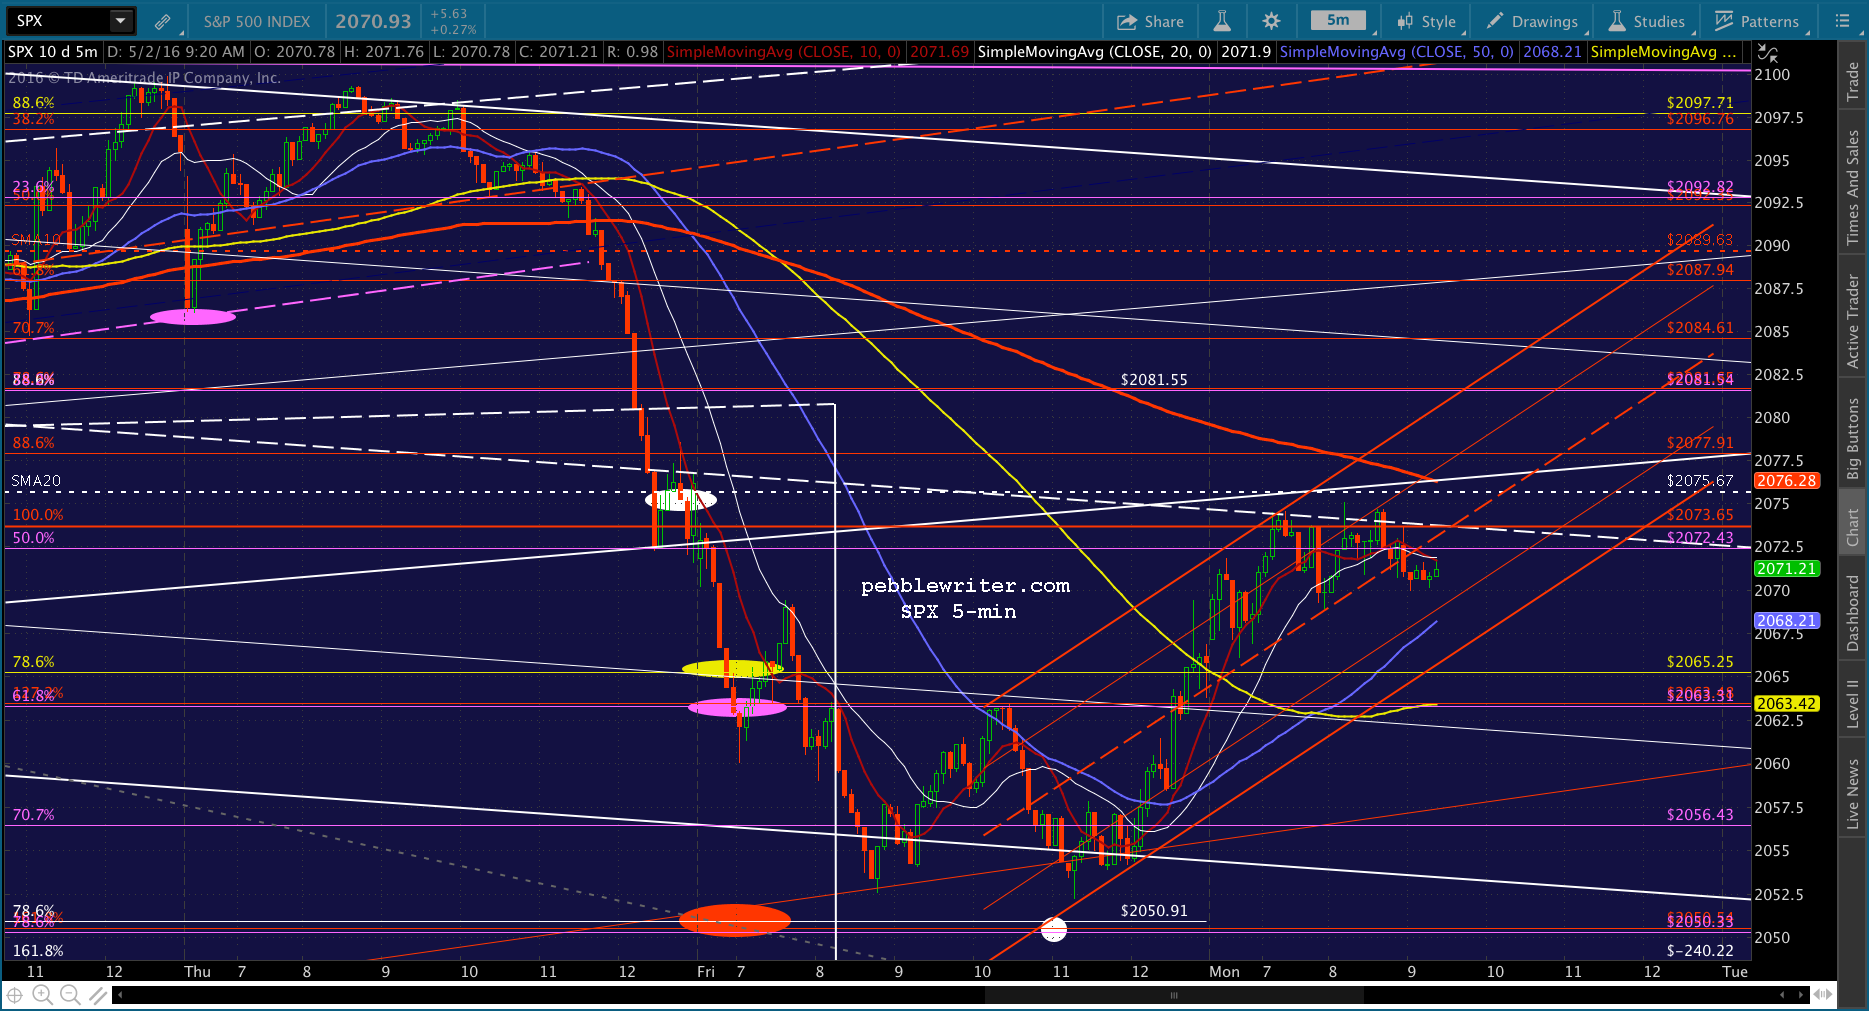
 UPDATE: 12:44 PM
SPX’s SMA5 200 is a few pennies away from the SMA20 at 2075.67, and USDJPY chose this very moment to break down from the rising white channel. Apparently it isn’t time for the SMA20 to be tagged just yet.
If SPX can be kept away from overhead resistance, it will have no reason to reverse lower. Maybe they just want a few minutes to prepare CL for a big bounce? Enough of a reversal, and they could probably get SPX back up to 2081.70.
 UPDATE: 2:57 PM
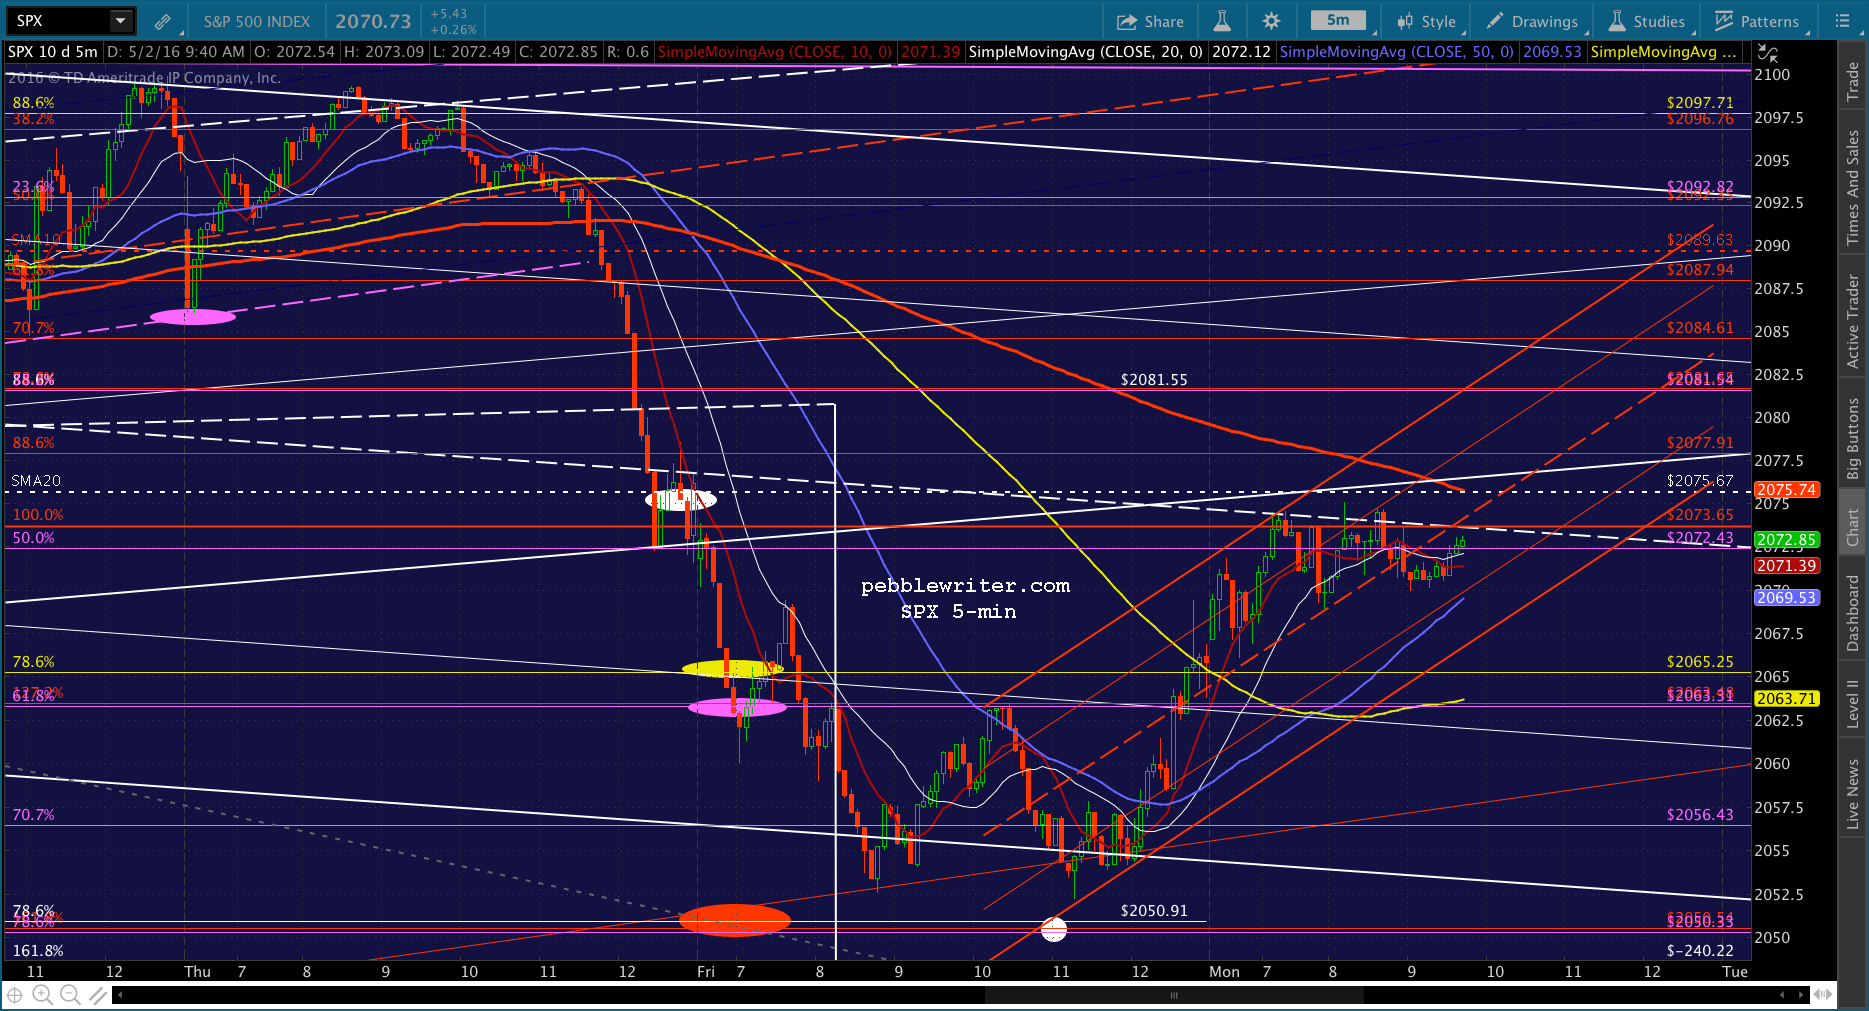
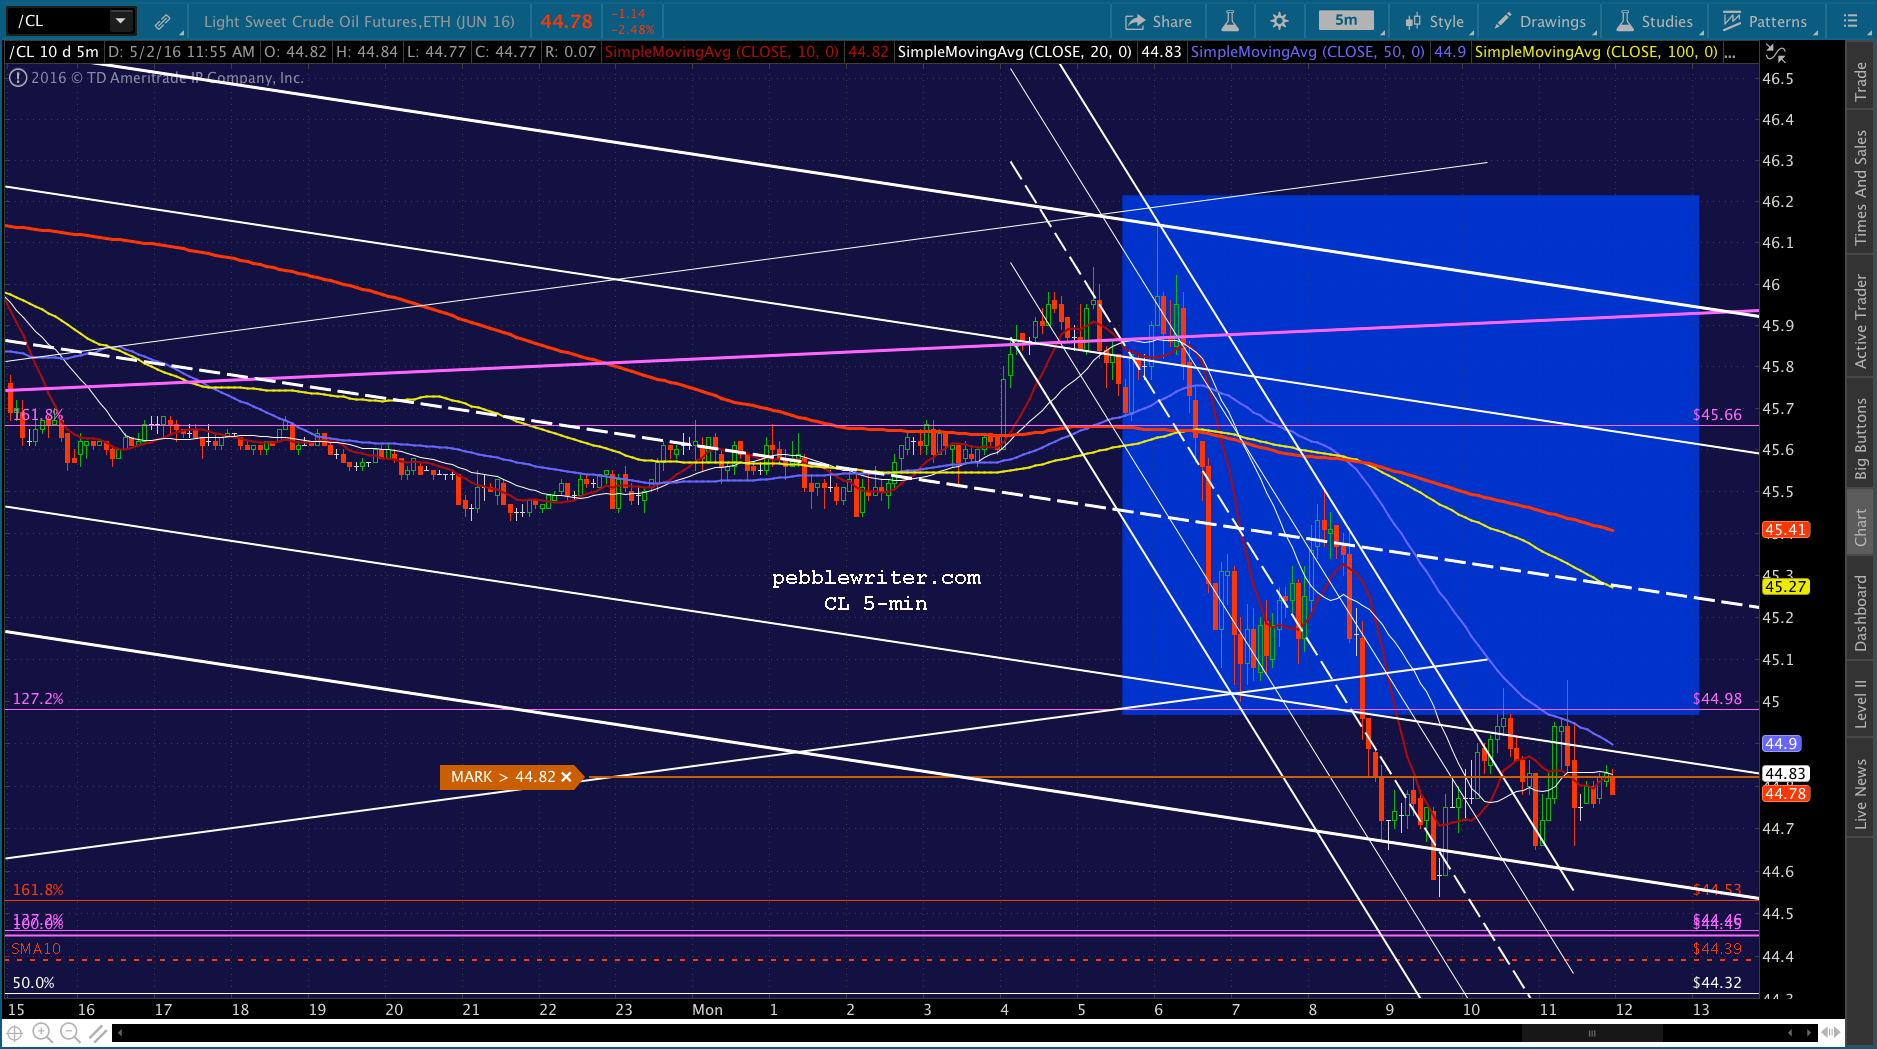
Somewhere along in here it would make sense to backtest the broken SMA5 200 and white channel midline. I’d short here with an initial goal of 2073.50ish, where we’ll likely see a rebound.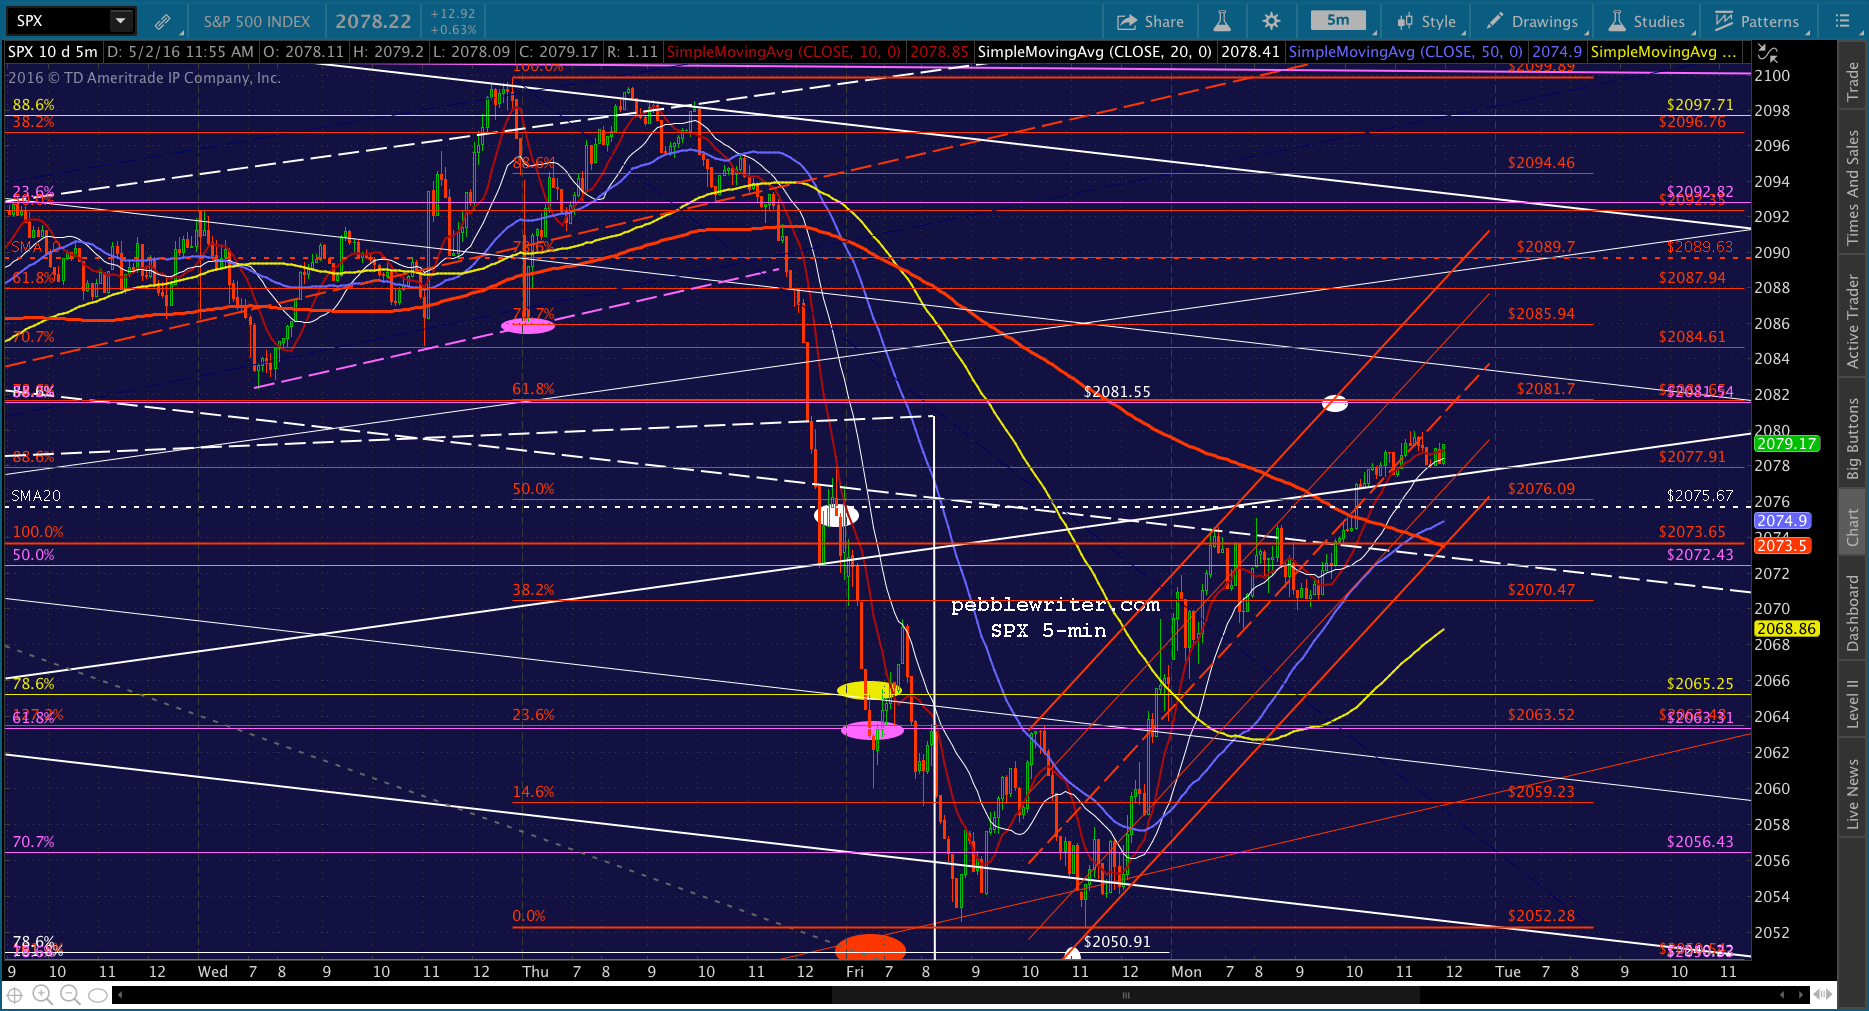

 UPDATE: 3:40 PM
Doesn’t look like they’re going to allow a backtest prior to the close. So, I’d dump the short here and stay in cash overnight.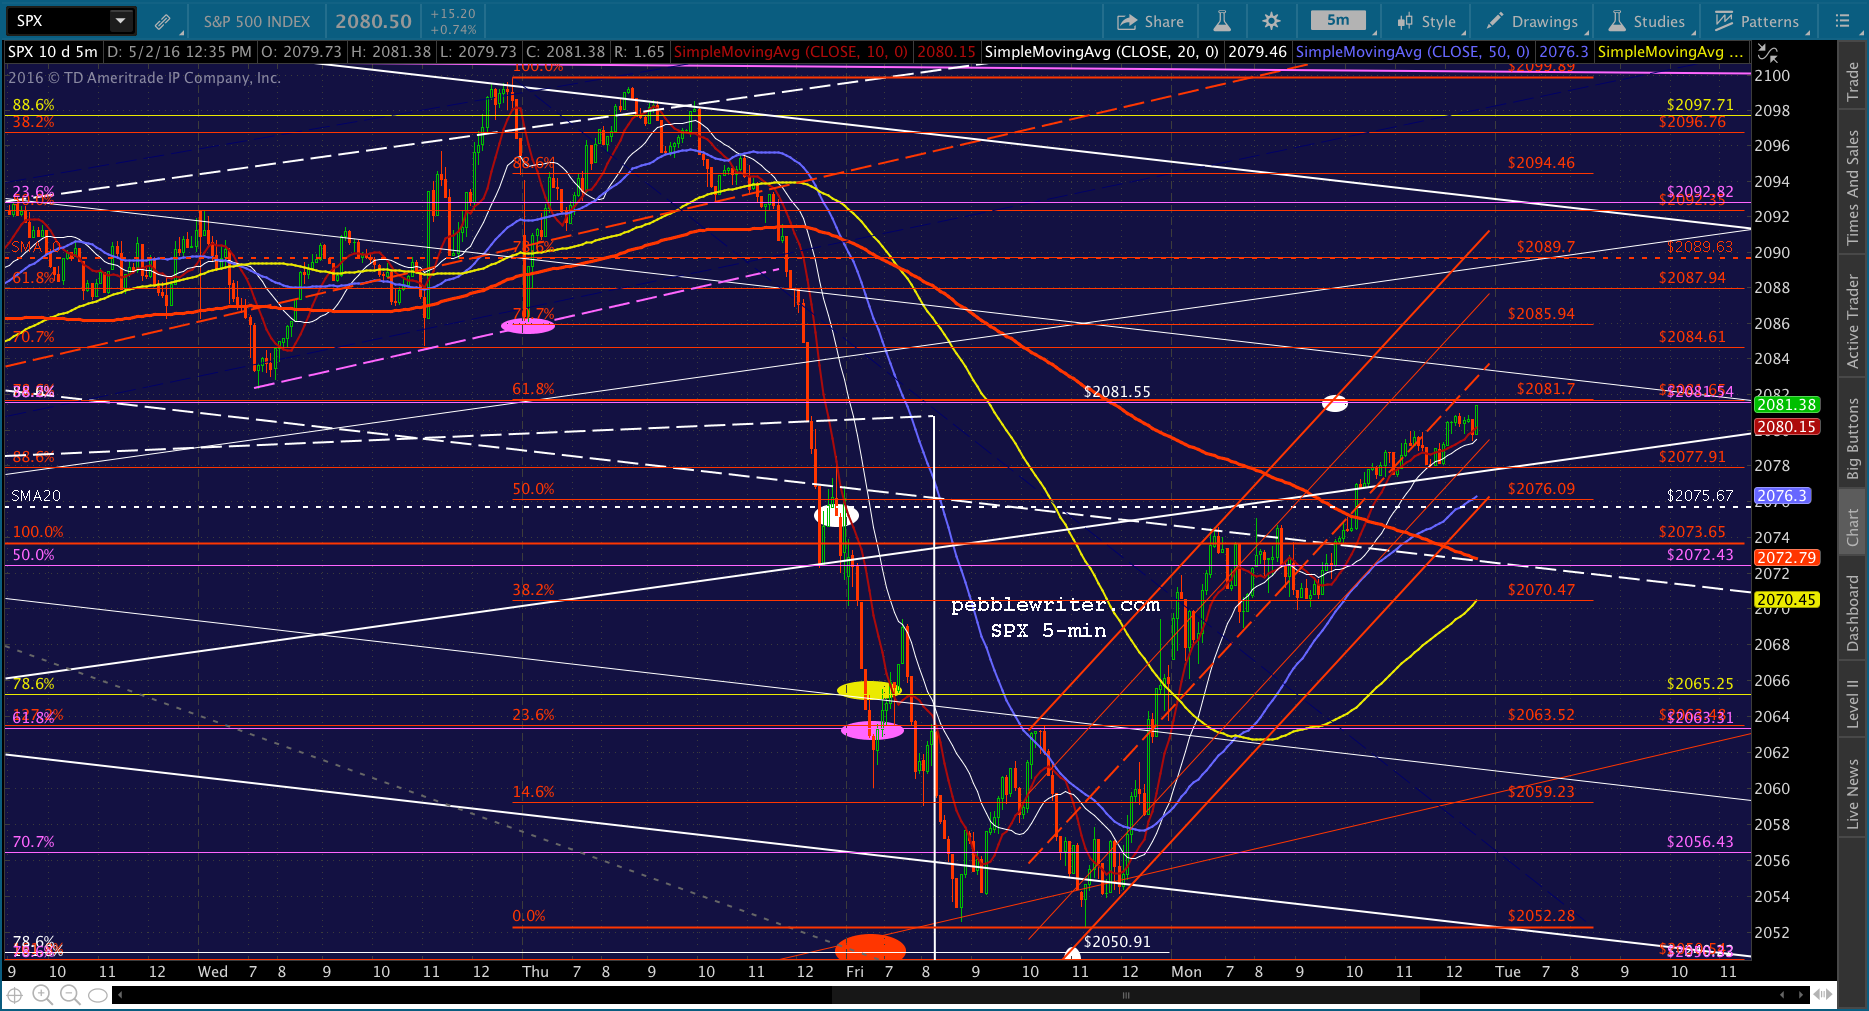 UPDATE: 3:45 PM
Theoretically, SPX should reverse here at the white channel .786 line. But, I question whether they’ll let it back off the white H&S neckline. And, with 15 minutes left in the session, shorting here would amount to a fairly risky maneuver. Having said that, if you have the ability to hedge or watch it closely overnight, it could reverse to at least 2075 or even 2072 — also something worth considering if you’re holding a long position from Friday’s lows. And, if the midline doesn’t hold, then there’s downside to at least 2058.94.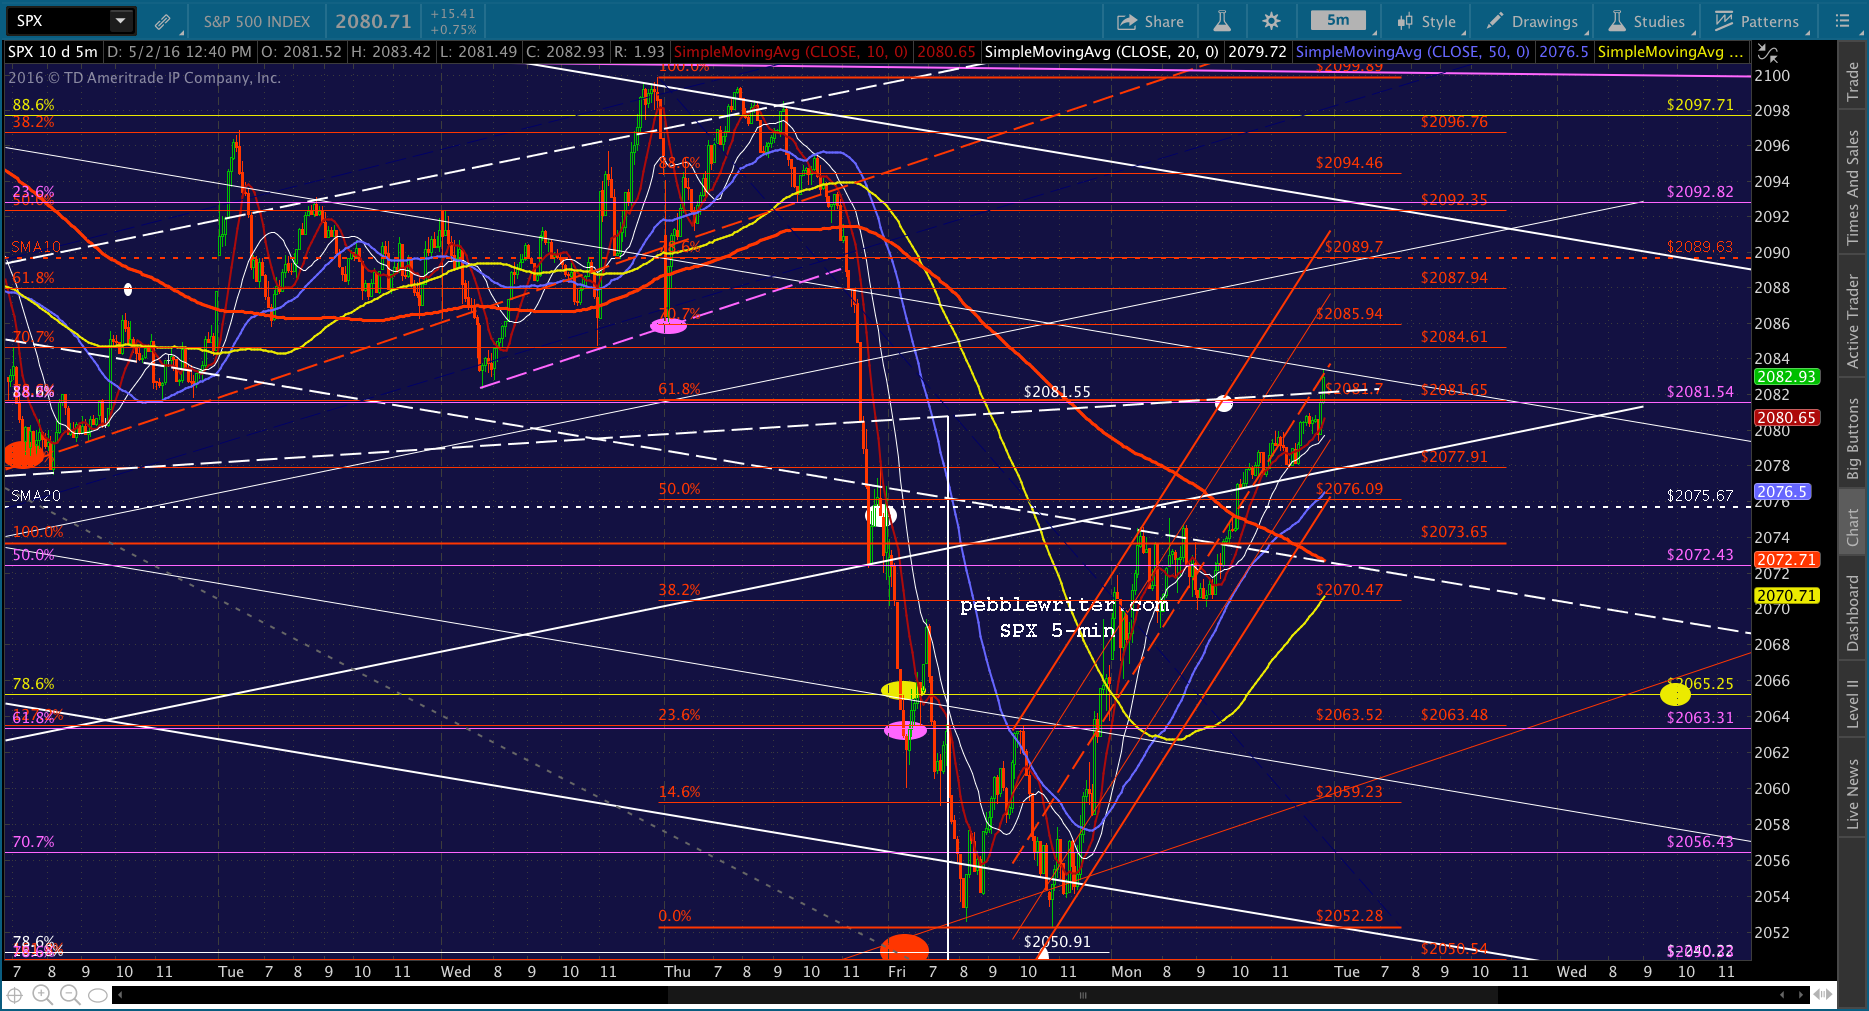
Comments
2 responses to “Happy Anniversary to Us”
PebbleWriter,Happy Anniversary! Your original blog was http://pebblewriter.blogspot.com/ in the old days and your analog analysis is amazing.
The March 2011 earthquake in Japan. It did not stop the analog to play out. It just delayed it. You had an impressive analysis on that.
I was lucky to notice your blog in 2011. Thank you!
Thanks, Tommy. I’m very fortunate to have had such loyal members all along the way!