In our January 27 update, we noted that 10-yr yields had backtested a broken channel bottom and appeared poised to fall further.
But, we also charted an important divergence between yields and stocks.
 The last four major declines in yields were accompanied by declines in SPX ranging from 10% – 52%. This one was different:
The decline that began in January 2014 has lasted longer than any since the financial crisis. And, it’s about the same degree as the average of the others. Yet, it’s the only one accompanied by an increase in SPX — a whopping 14% increase, at that.
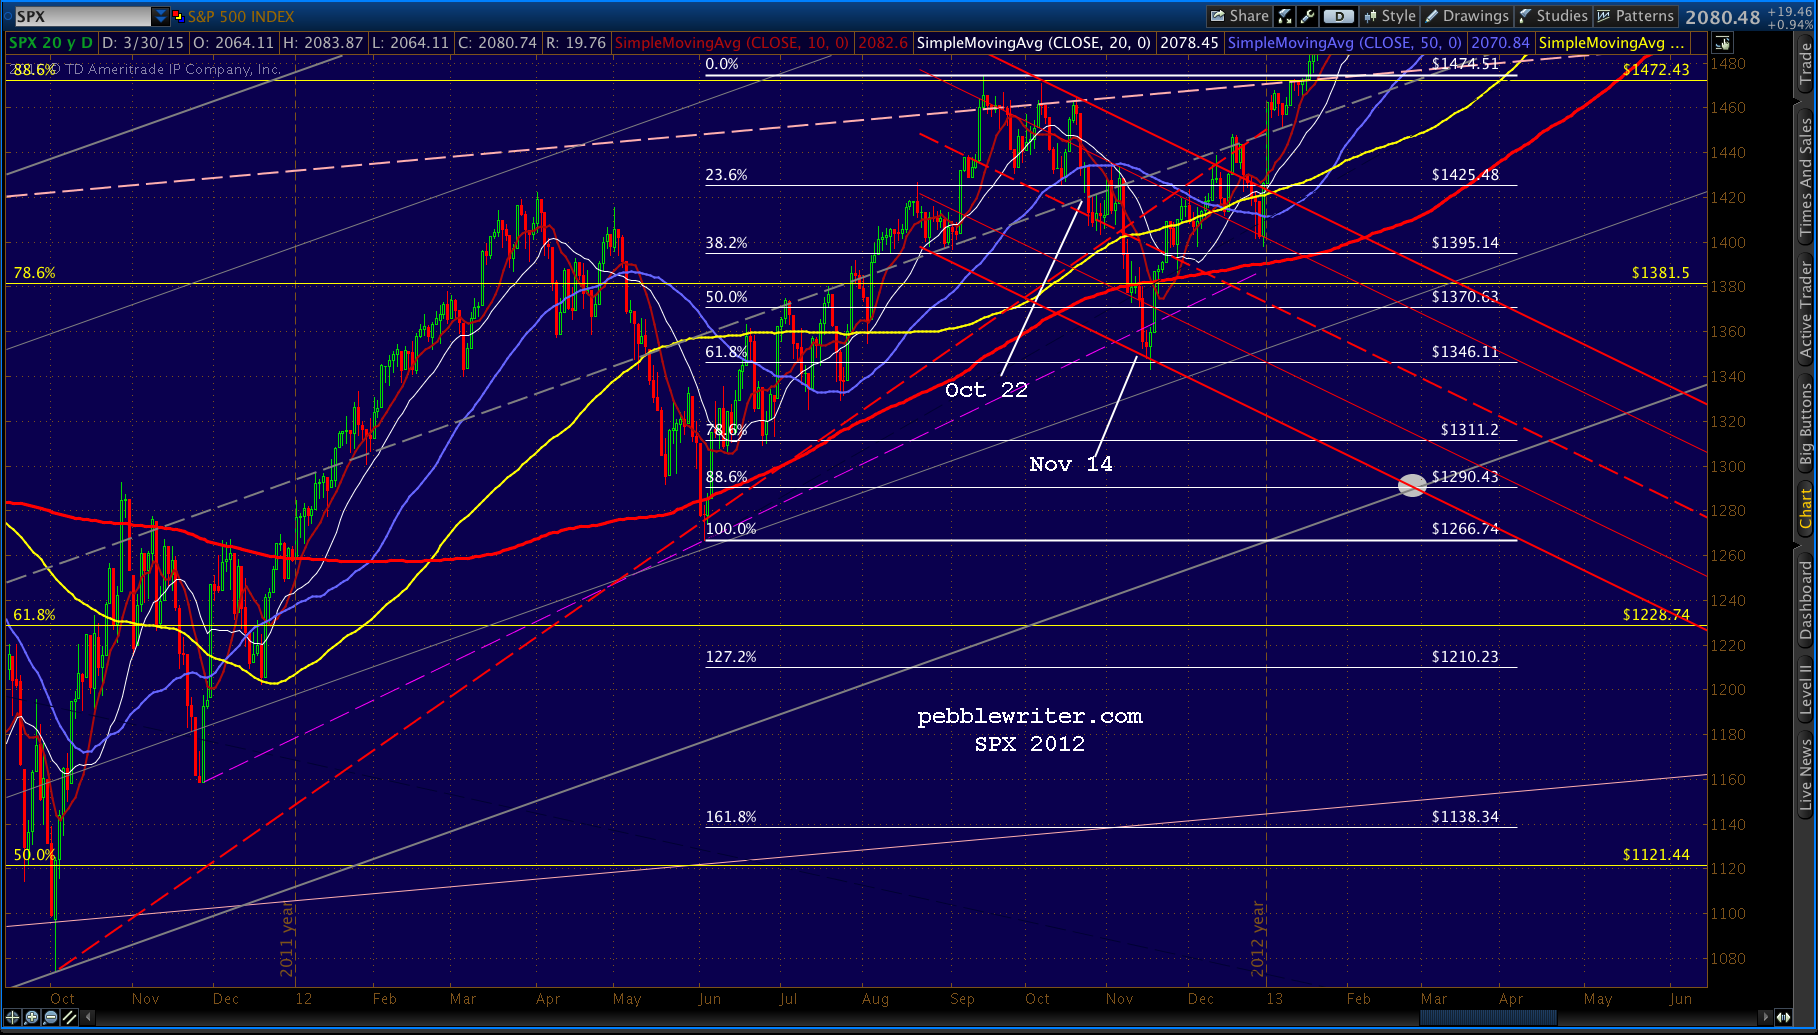
The difference, of course, is the stunning degree to which central banks have openly manipulated interest rates and currencies. The yen carry trade, in particular, has been the most important factor in stocks’ almost non-stop rally since 2011. We cover the effects in some detail in the latest posts on an analog we’re watching and will detail the carry trade itself in a coming post.
In the first week of February, rates had again fallen through support at 17.45 and SPX looked likely to complete the correction that had been aborted in mid-December. But, USDJPY shot up over 2% in 2 days, busting through its SMA10, 20 and 50 and a number of bearish chart patterns. Stocks rebounded sharply, of course, with yet another nonsensical snap-back rally that took SPX to new highs.
But, bonds also thumbed their nose at the usual charting rules. Yields shot right back through the broken red channel bottom, gaining 60 bps over the next six weeks. At 22.59, however, they ran into resistance from the falling purple channel top.
 Not so coincidentally, USDJPY and oil were also running into channel resistance at the time. The upshot was a sharp decline for TNX that has since retraced a little over .618 of that spike from 16.51 to 22.59.
There is initial support at last week’s lows, and at 17.20 from both the red .886 and an interior (.236) purple channel line in the next day or two. The stronger support is white .886 Fib at 15.81. Due to the above-referenced transgression, TNX missed the opportunity to tag it in early March.
Our current analog calls for another opportunity around April 14, with the very good possibility of an overshoot to 14.90-15.10.
Stay tuned.


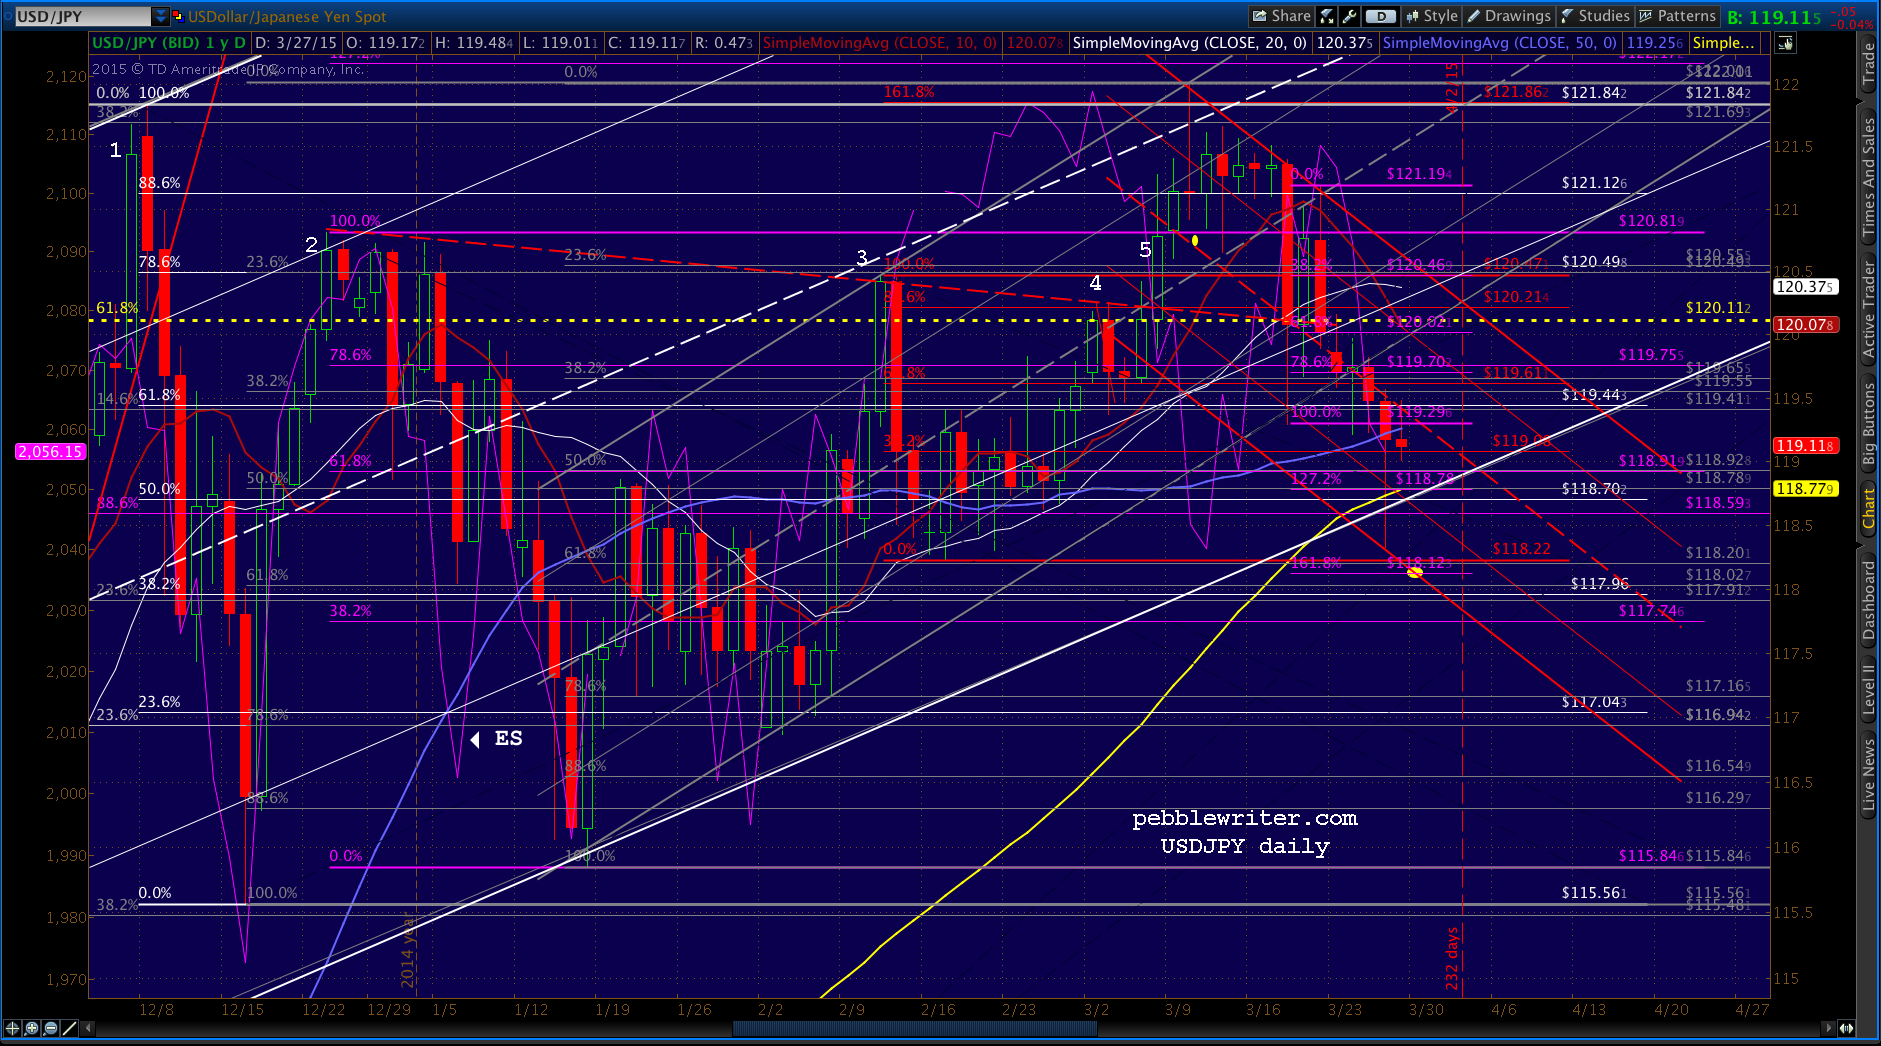
 Yen and euro strength and dollar weakness are accompanying a 20-pt ES sell-off just like the good old days.
  Why? Crude light trading on Globex is closed for Good Friday, so CL is out of commission. DX is free to plunge without igniting CL and, thus, ES.
 Will be fascinating to see whether or not USDJPY can close below its 100-day moving average (yellow) as the analog forecasts…