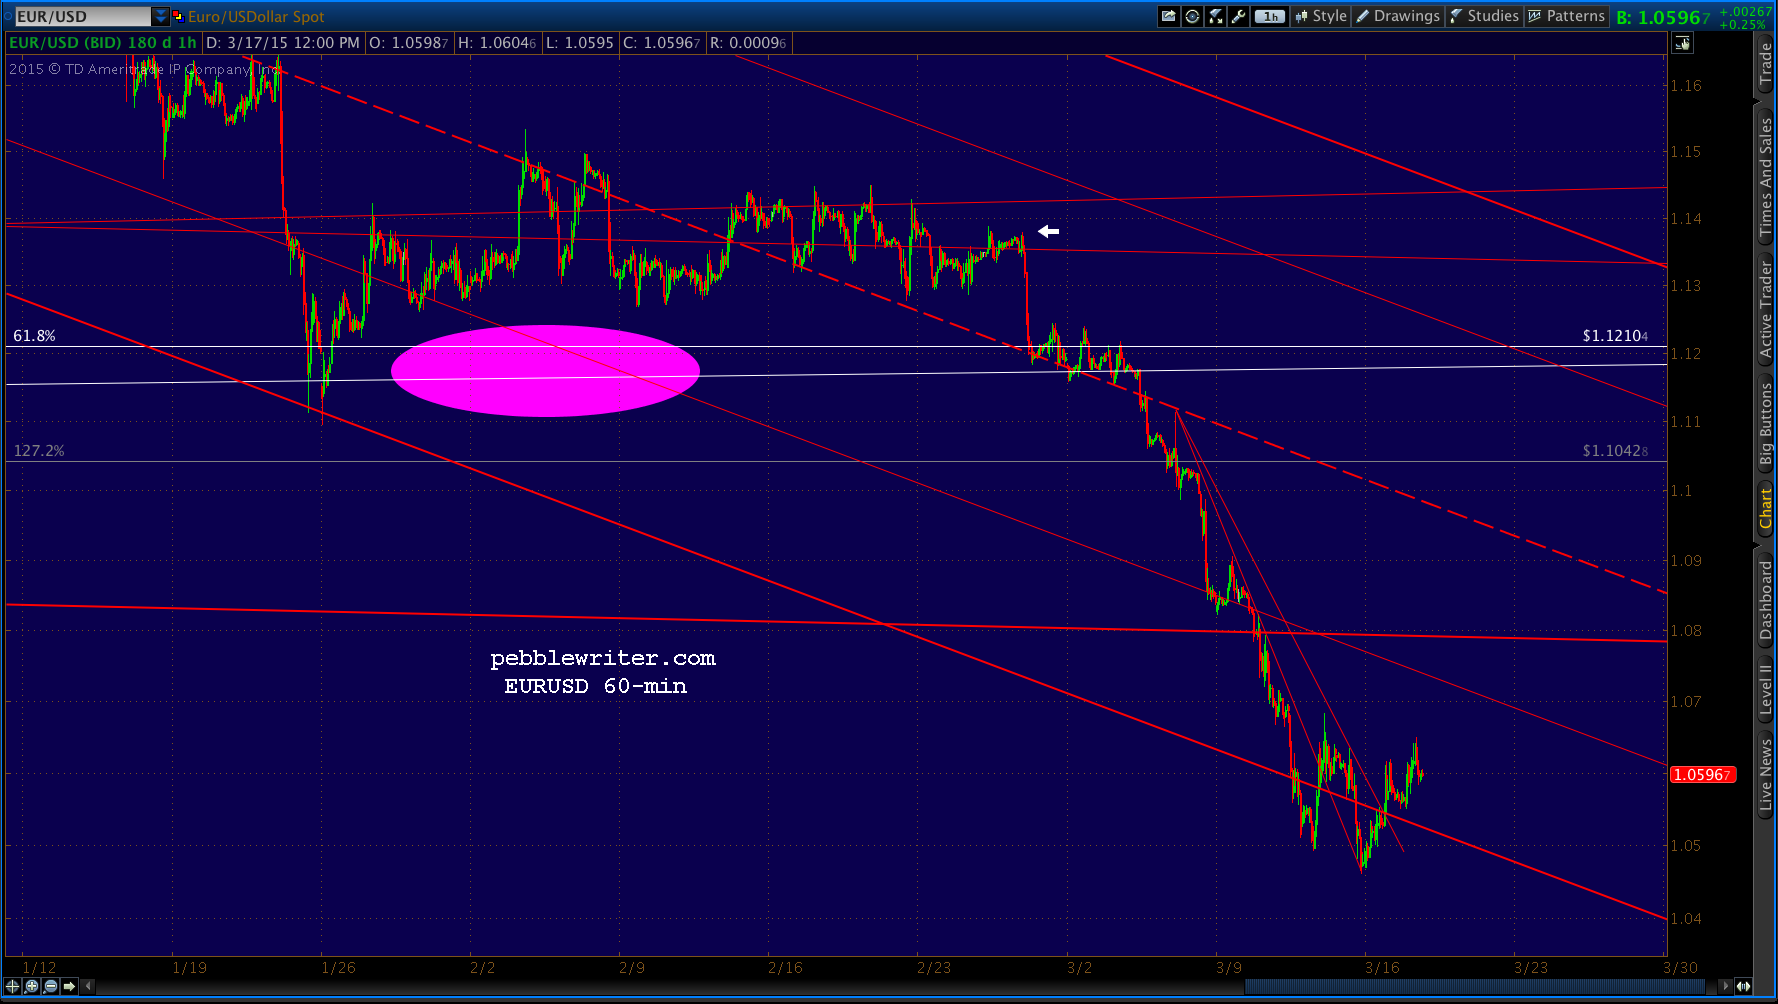
The euromess continues to have everyone on edge. The genius of Mario Draghi is that he trashed the euro and took interest rates below zero without having to do much besides flapping his gums.
 The idiocy of Mario Draghi is that the euro and eurozone interest rates have sunk so low, no one knows whether or how they’re going to stabilize now that QE has finally begun.
The global markets have risen to stratospheric heights on the back of dollar strength and yen/euro weakness, plain and simple. We’ll take a fresh look at the current state of the carry trade in the next few days. But, even the White House admits that dollar strength is becoming a fundamental problem.
And, while some believe the yen will fall further (140 is tossed around quite a lot), there is increasing pushback by the Japanese consumer and businessman alike (see: HERE.) If not for the plunge in the price of oil (which is trying to find support here, by the way) Japan would have way more inflation than it can manage.
 Contrary to Abe’s fairy tale figures, overall inflation reached 4.4% last May, and has since backed off to 2.8% thanks to energy. But, fresh food prices are up 15% since November. And if, as I suspect, oil has bottomed out for now, Japan Inc. will be hard pressed to flog the yen any further without deepening the death spiral in which it already finds itself.
 We’ve speculated as to whether the ECB can (let alone should) accomplish the same results as the BOJ. The eurozone has a definite deflation problem. So, to the (very questionable) extent that QE could solve that problem, buying up €1.1 trillion in bonds might seem like a good thing. The “markets” would certainly appreciate the injection of cash.
But, where to put €1.1 trillion? As the research shows, there just aren’t enough attractive, eligible bonds laying around. And many of them already feature negative yields. Buying them at current prices already guarantees an investor will lose money. Can the fractious eurozone support such an endeavor, especially when voters come to realize they won’t benefit one iota?
Then, there’s the dollar. If the euro and the yen continue getting cheaper, it would obviously continue to rise in value. US consumers are happy as clams pumping cheaper gas into their cheaper Toyotas and Mercedes. But, the handful of exporters still kicking in the US are hurting.
And, there’s that elephant in the room: how to take central bankers’ big, fat feet off the gas without reversing all those carry trades and crashing the global economy (along with stock markets everywhere?)
The last time oil prices plunged like this, stocks reflected the concurrent economic weakness. This time, they haven’t — at least, not yet.
 Is it because economic conditions aren’t all that bad, and the oil price decline is out of sync? Or, perhaps the economy is in big trouble, as oil accurately reflects; and, stocks are being driven higher by unrelated factors.
We think the actual answer involves a little of each. Let’s summarize:
JAPAN
- Japan’s economy is circling the drain. It has gone all-in on QQE in order to stay alive.
- Japan’s plummeting yen has fueled the carry trade, driving stocks everywhere higher.
- Japan’s plummeting yen was crippling consumers and businesses — until oil plunged.
- The BOJ is officially monetizing the Japanese gov’t (and increasingly its stock “market.”)
- If inflation remains under control, the yen could be trashed even further.
EUROZONE
- The EZ’s economy is circling the drain. It just instituted QE in order to stay alive.
- The plunging euro has also helped fuel the carry trade.
- The plunging euro has not impacted consumers yet — again, thanks to low oil prices.
- The ECB is indirectly monetizing eurozone governments.
- Deflation is a huge and real concern.
UNITED STATES
- The US economy has seemed fine on the surface; in reality, it’s faltering badly.
- The soaring dollar has helped fuel the carry trade.
- The soaring dollar has helped consumers due to lower oil and other import prices.
- The Fed has ended QE (for now), but has zero desire to see interest rates rise.
- Inflation is under control (for now), but could soar if the dollar plunged in value.
How do all these factors explain the current state of affairs? Let’s put it all together.
The driving force is the US, which desperately needs inflation and interest rates to remain under control. Otherwise, the nation’s debt service payments would get out of hand, the bond bubble would burst and equities would plummet. It also needs consumers to increase borrowing and spending.
One key element is lower oil prices, which are largely a factor of a strong dollar and increased domestic production.
While oil and gas capital expenditures total about 10% of US CAPEX, they represent only about 1% of US GDP. In other words, the US can weather the price decline without much damage to the average American or to GDP (employment is another matter.)
Keeping oil prices low allows Japan to maintain its QQE and incentivizes the ECB to increase its QE — thus supporting the carry trade and continuing stock “market” expansion. It also offers the side “benefit” of punishing Russia for its actions in the Ukraine.
If oil prices were to rise and/or the yen fall much further, Japan’s will to support the carry trade might falter. The eurozone, on the other hand, is ostensibly open to higher oil prices in order to increase inflation. It’s an idiotic bold experiment that is likely to end in failure as it did in Japan. But, that’s a crisis the next crop of kleptocrats can deal with.
How about our Middle East “friends” and the good folks at Big Oil? OPEC doesn’t seem too alarmed by falling oil prices. It’s the (temporary) cost of stifling shale oil & gas production in the US, not to mention chipping away at ISIS oil revenues which have been estimated at $3 million/day.
And, Big Oil — while taking a beating on last quarter’s earnings — is likely licking its chops at the cheap reserves that will come available as more highly leveraged and less stable companies go belly up. We wouldn’t be surprised if the majors were not only well aware of the decline, but helped orchestrate it, too.
So, yes (in case you were wondering), we suspect oil’s abrupt decline was scripted — engineered in order to meet the otherwise conflicting needs of the G7 for low interest rates, low inflation and rising stock prices in the face of a global economic slowdown.
Will it work? Absolutely! *
(* until it doesn’t)


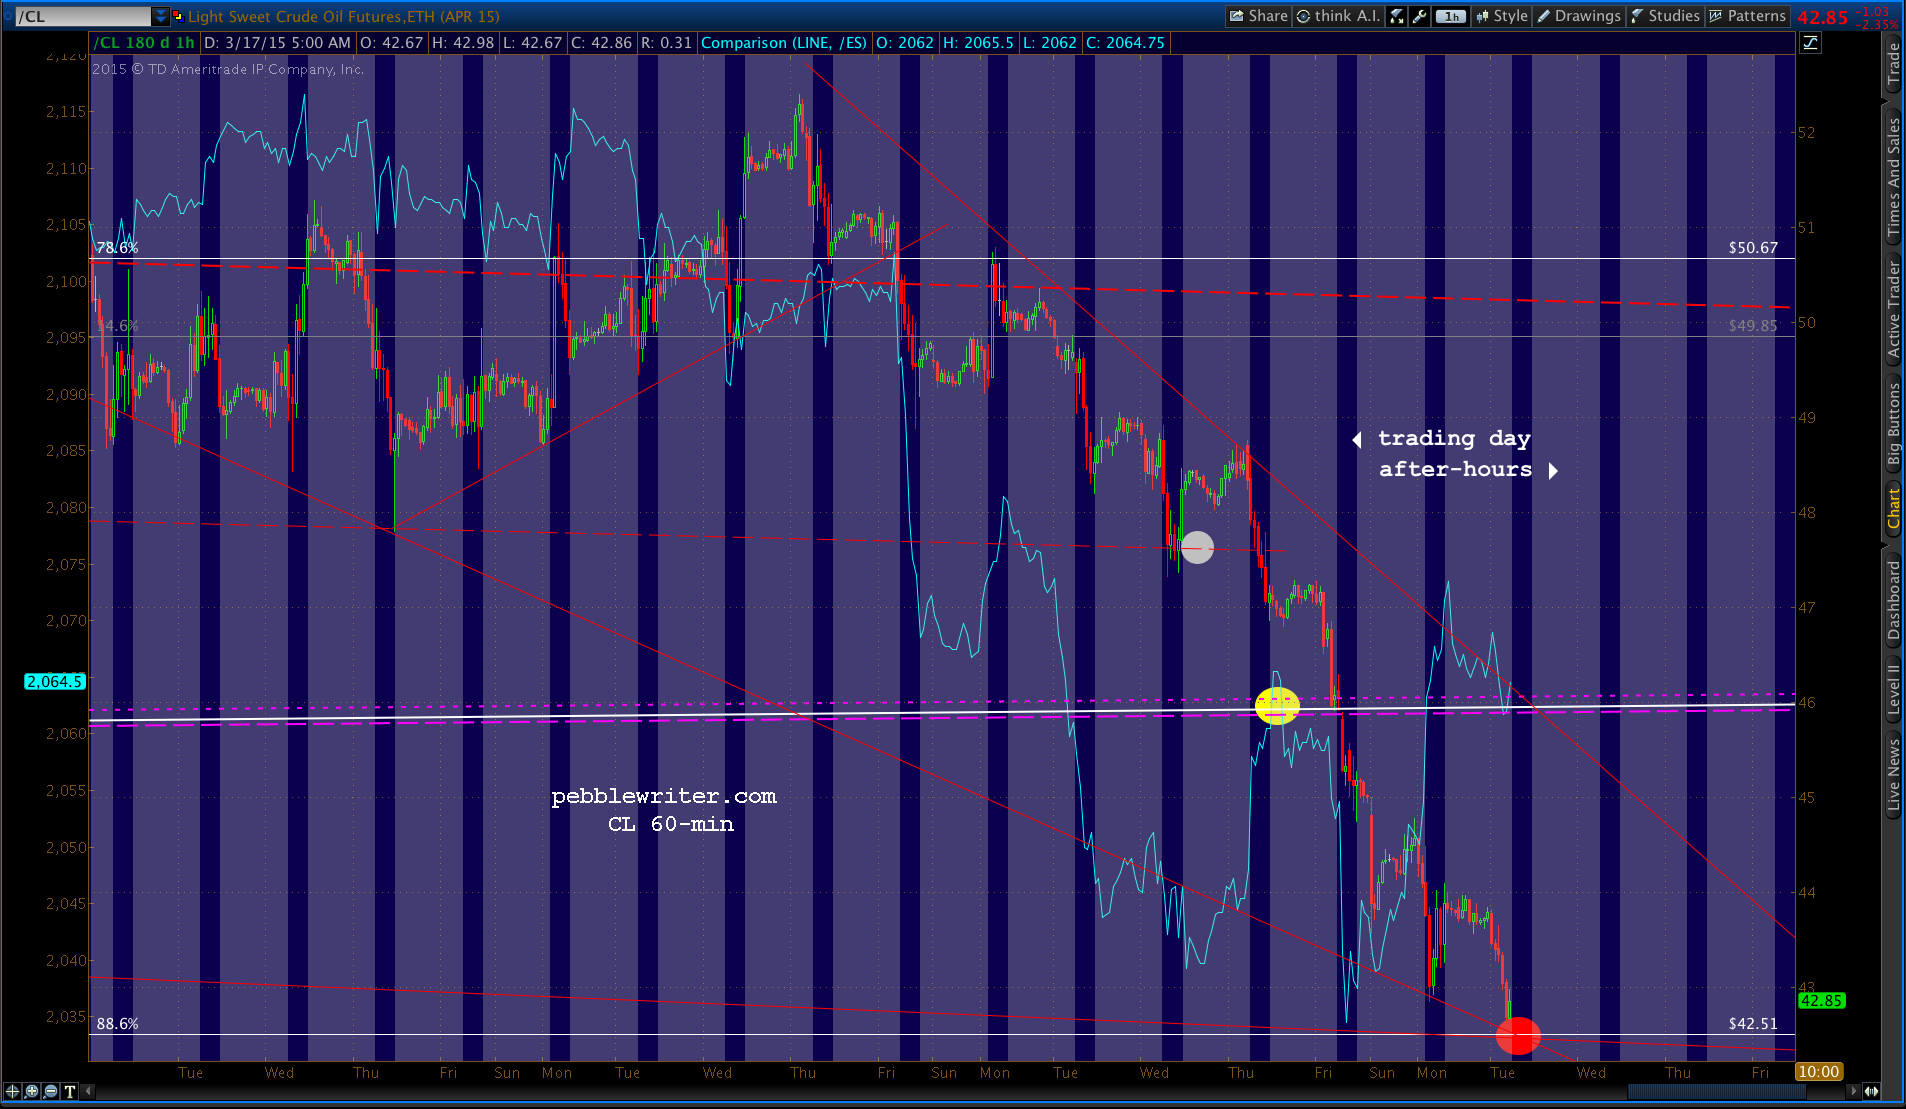
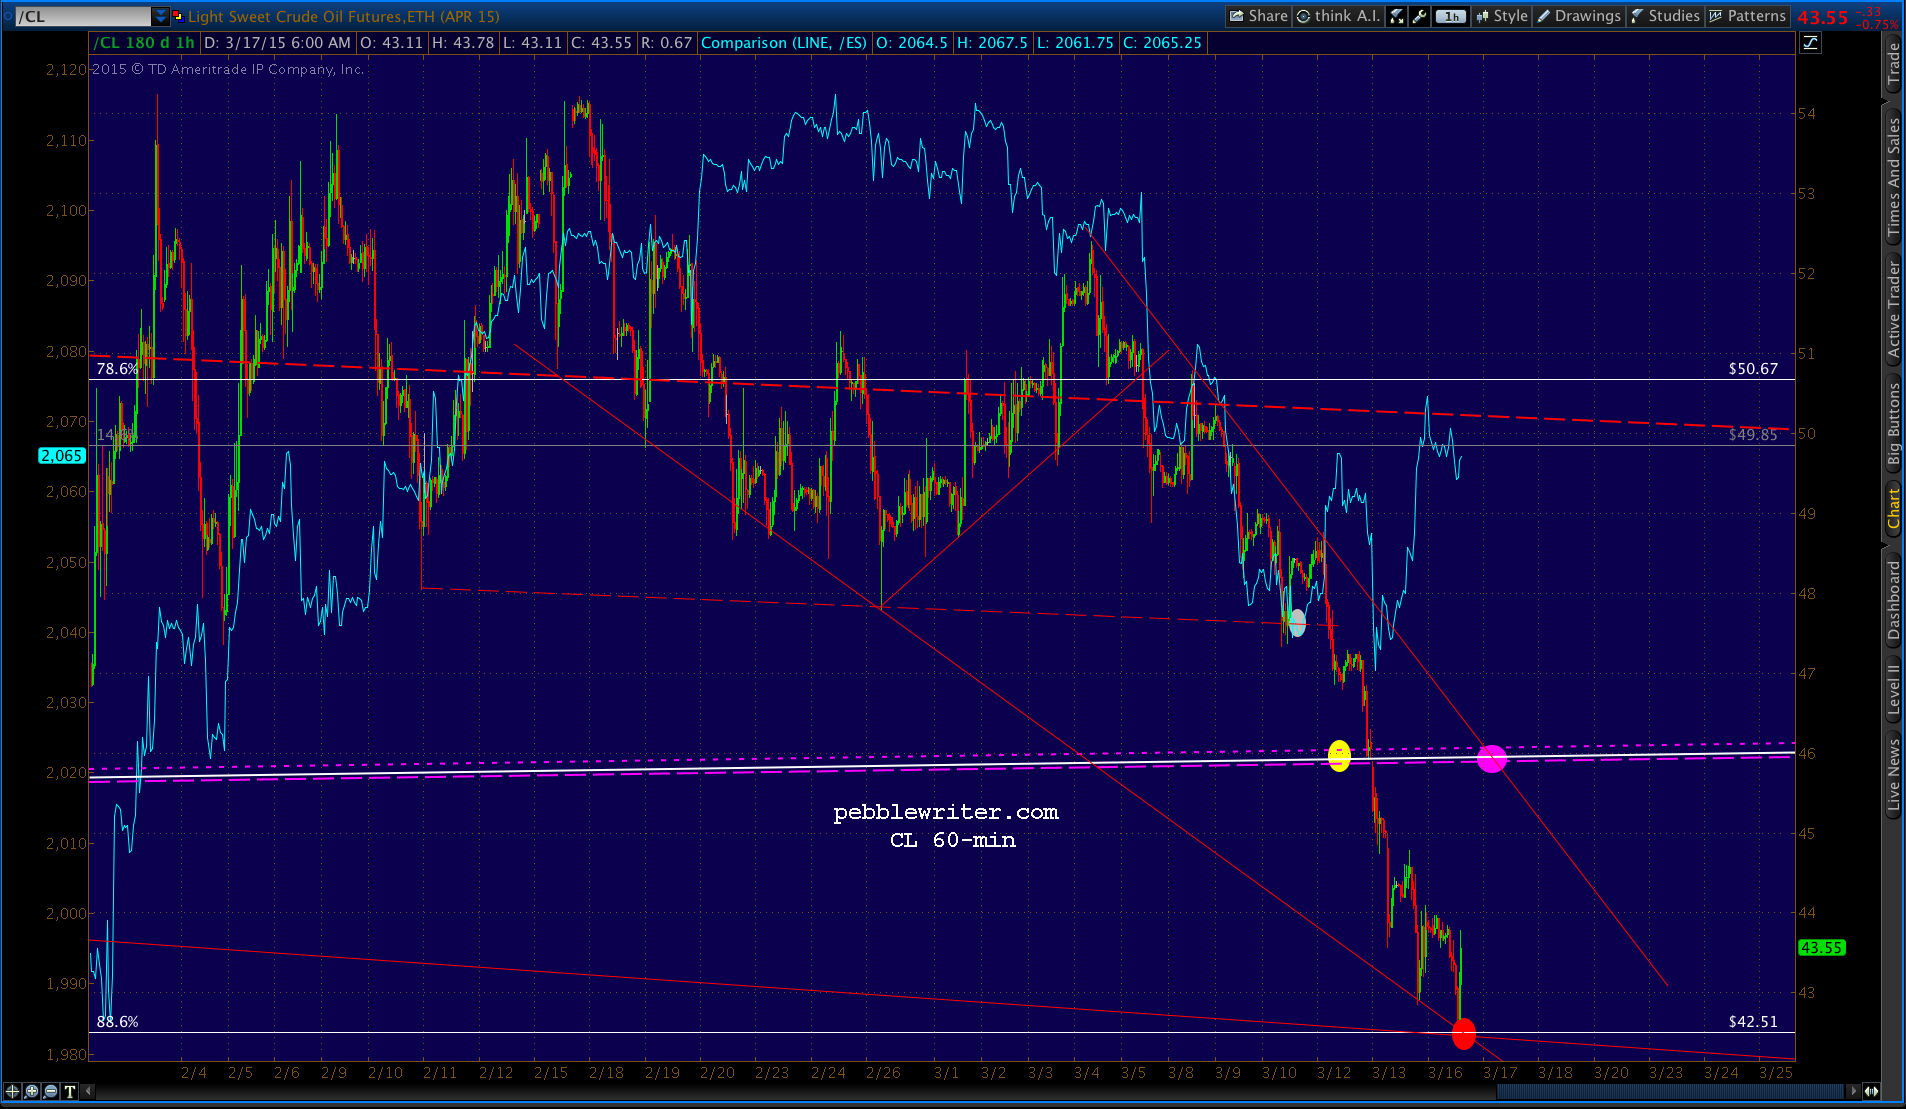
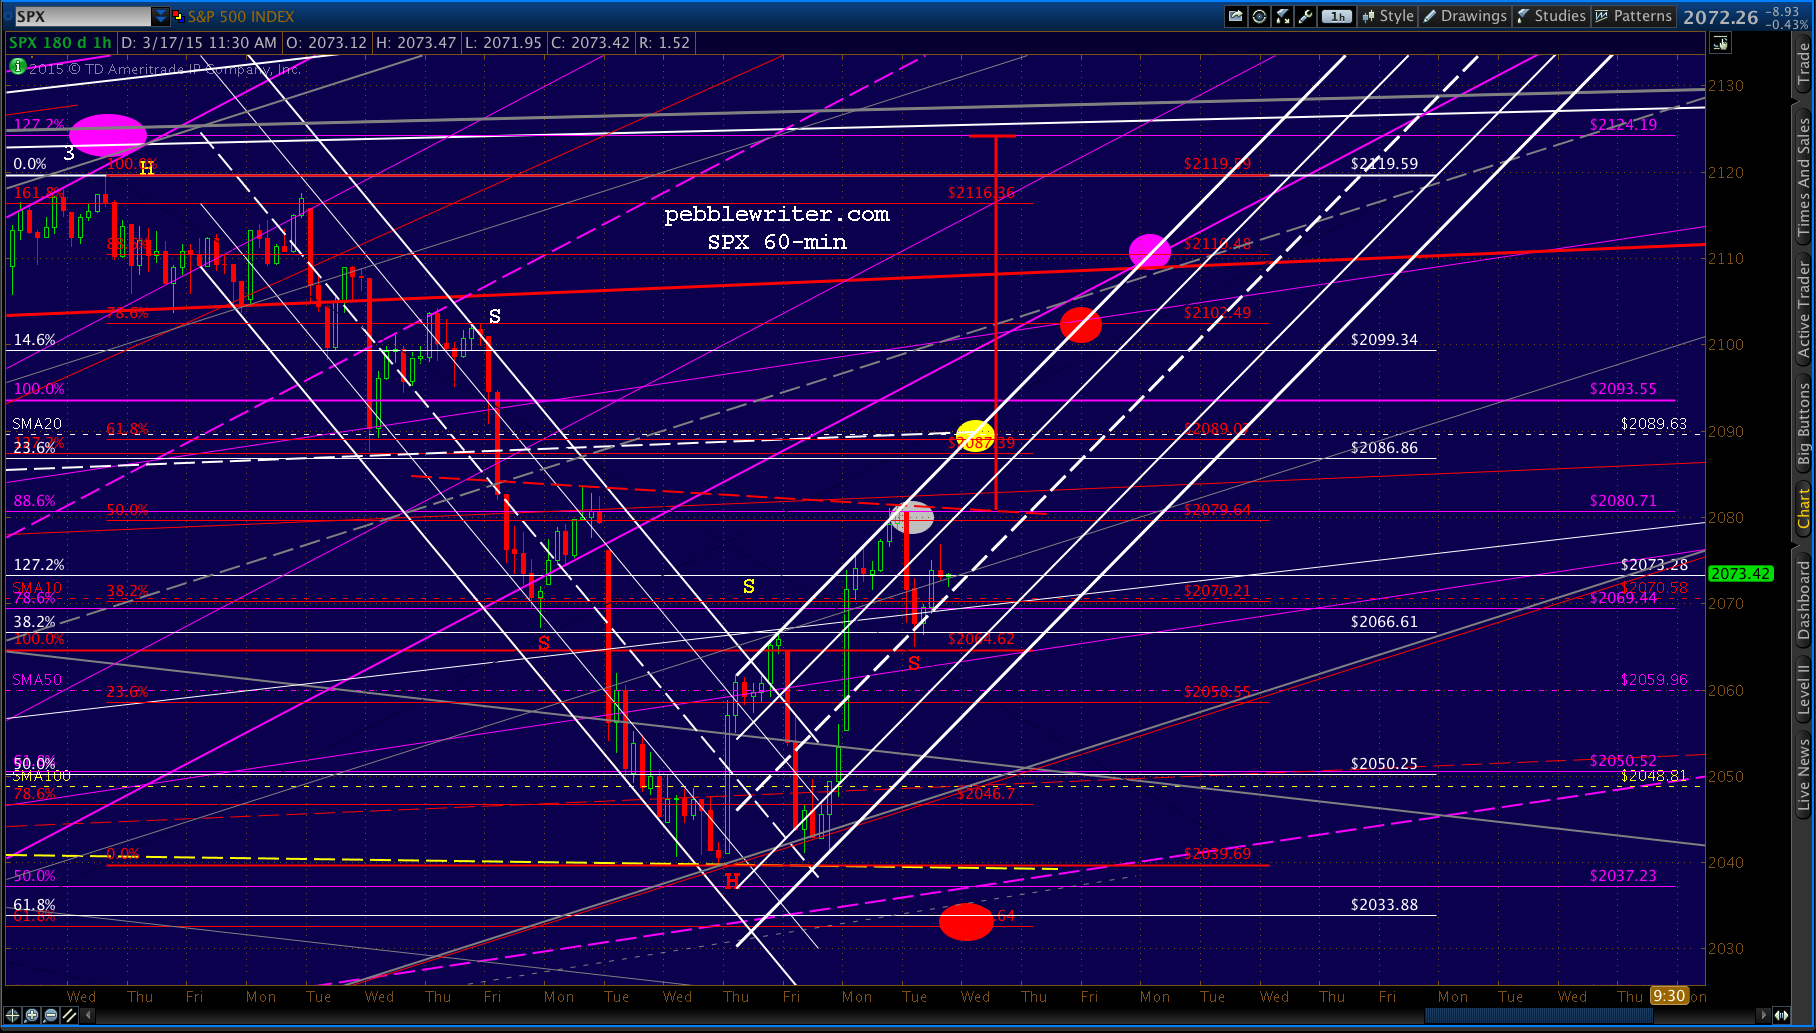
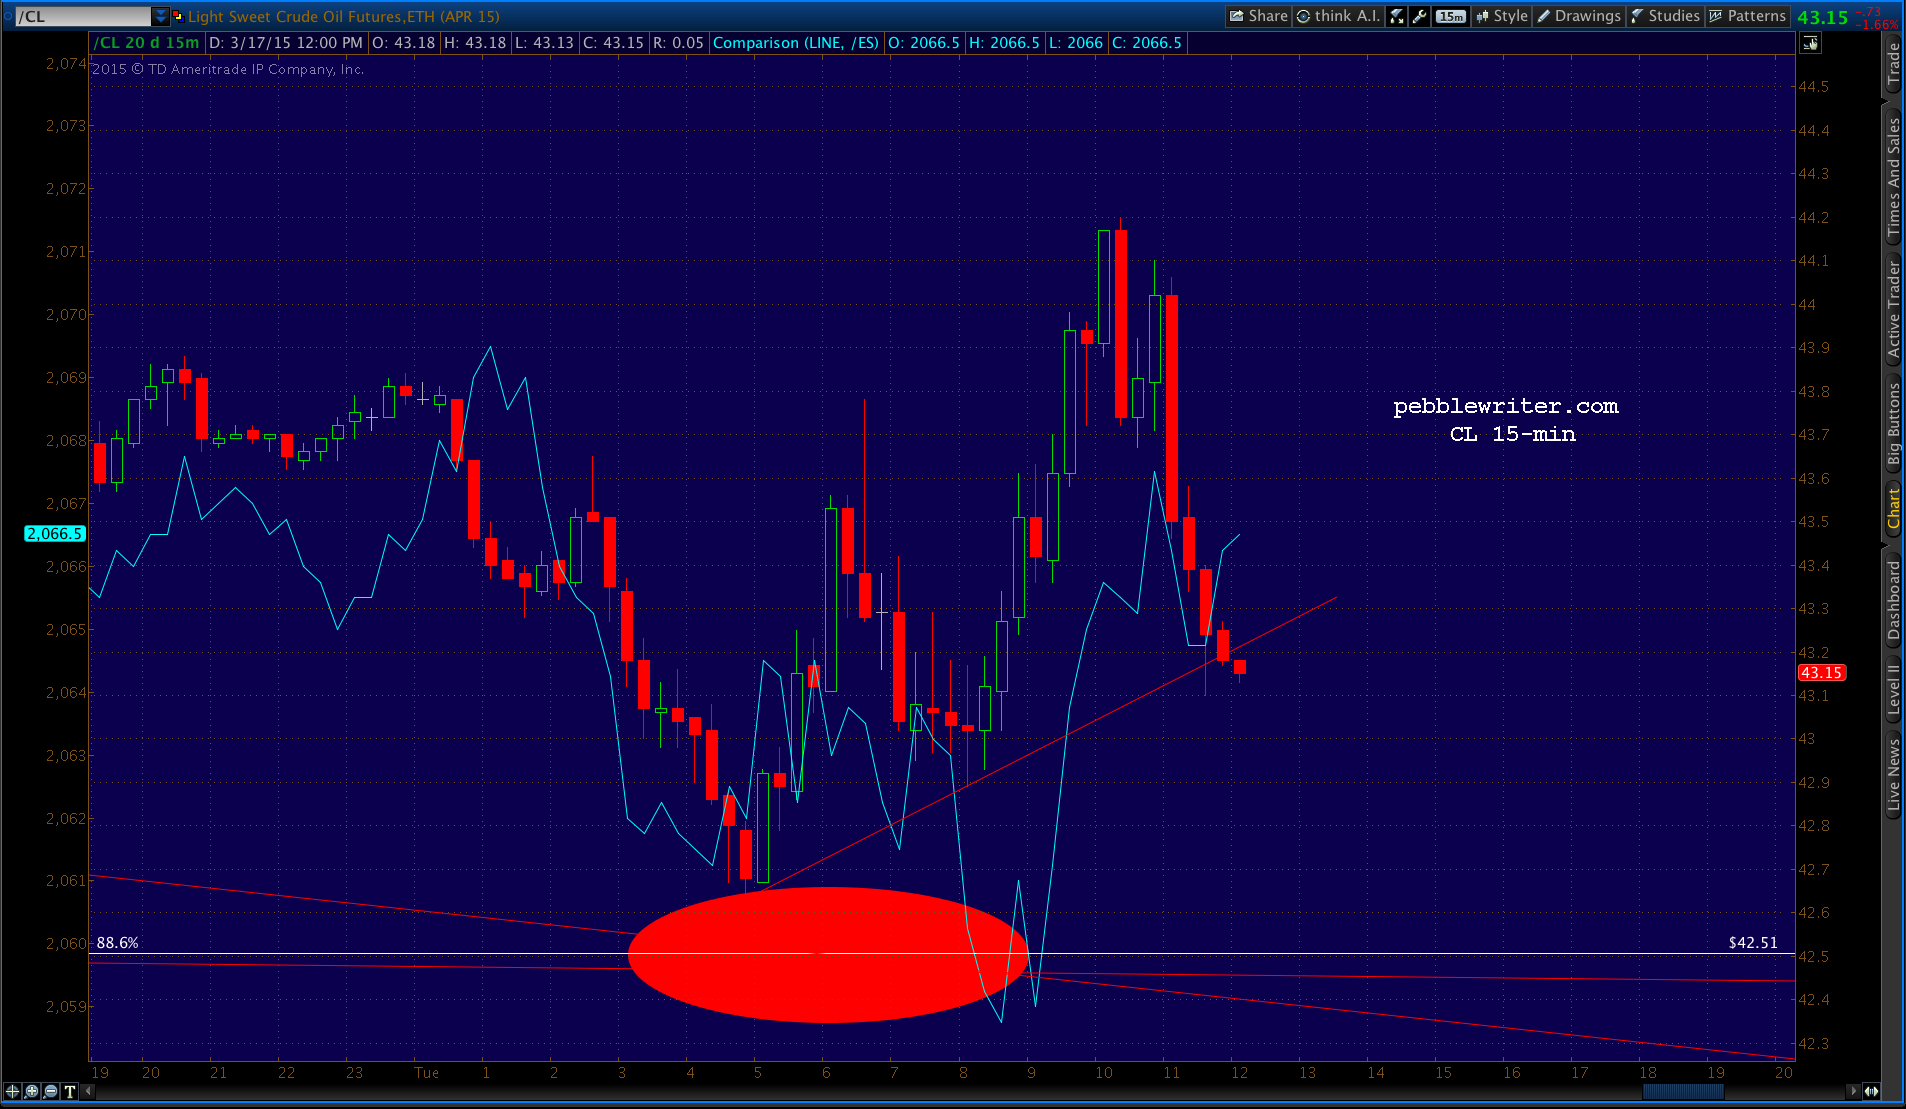
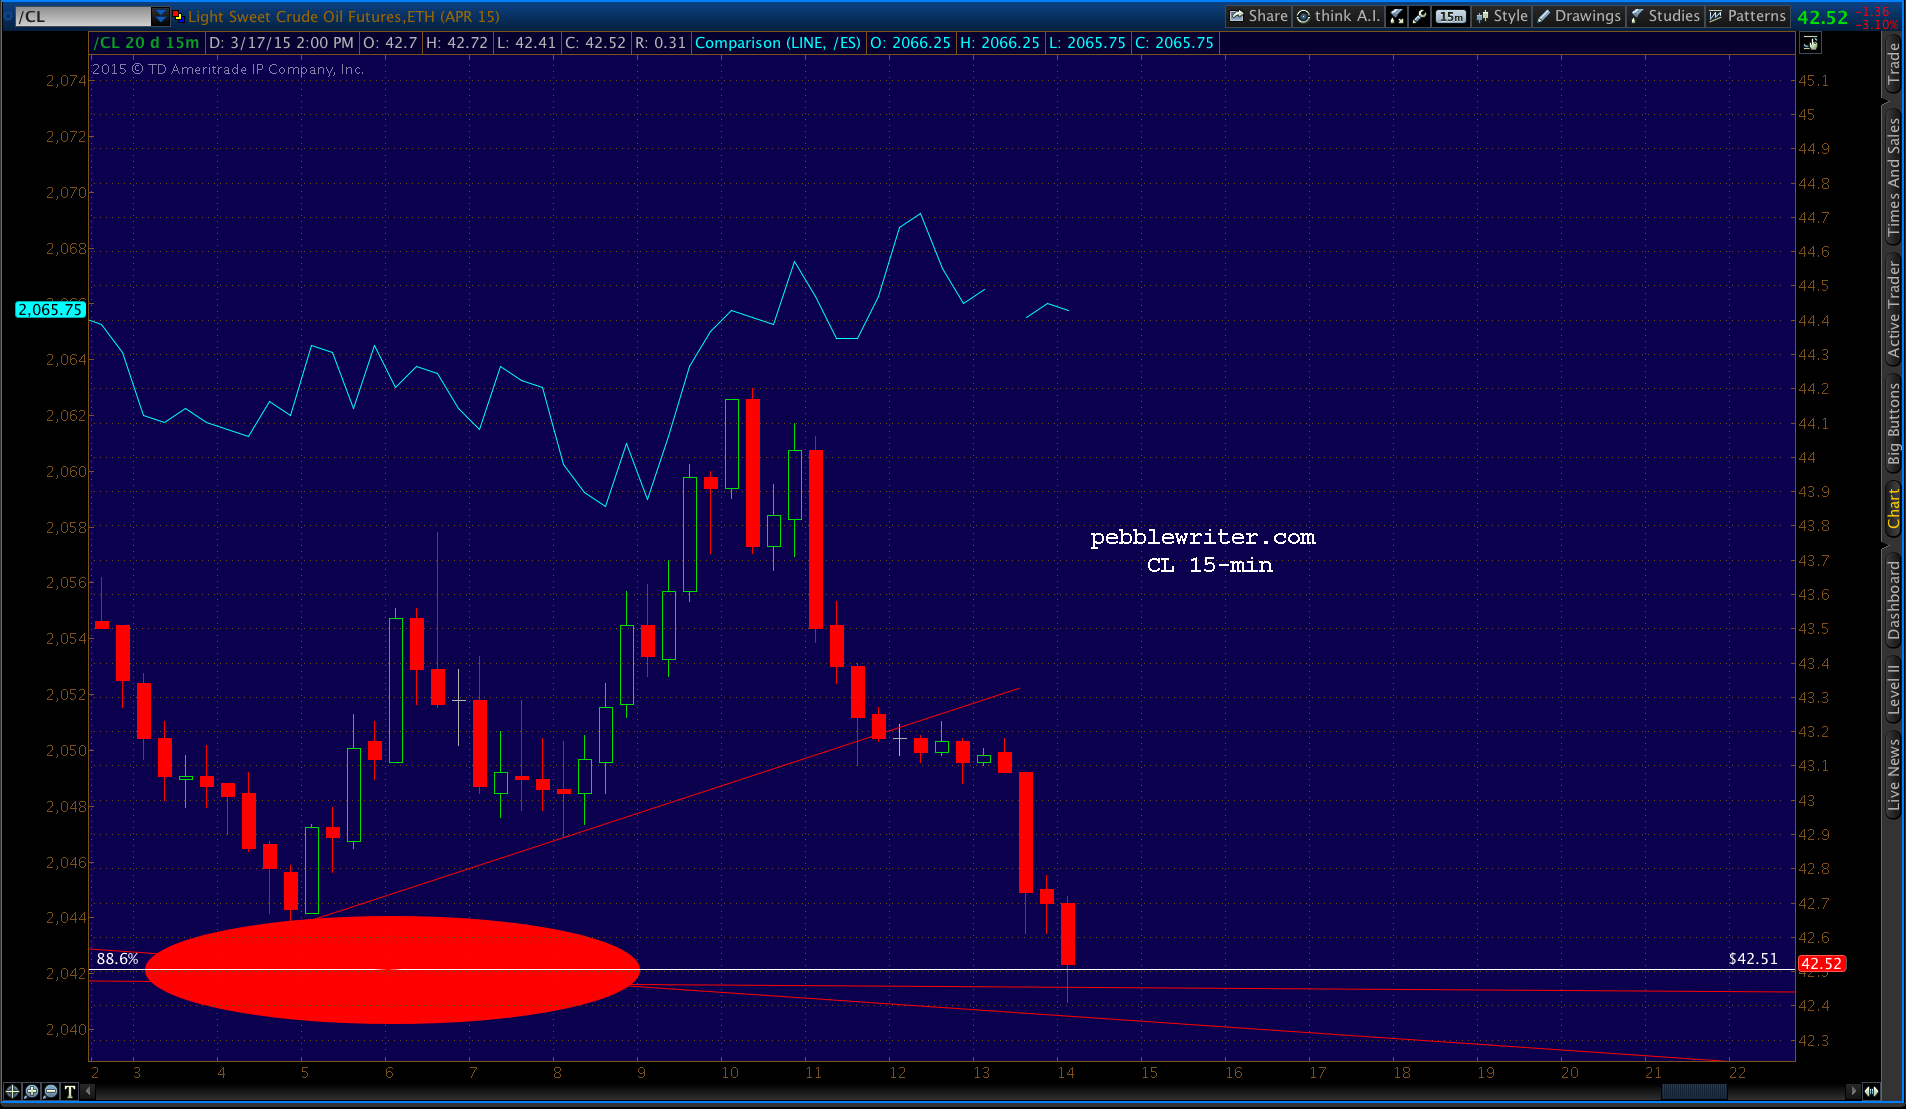
 CL did post another leg down. And, it happened right after the close — passing through 42.51 in the very minute before the futures also closed. The 60-min chart:
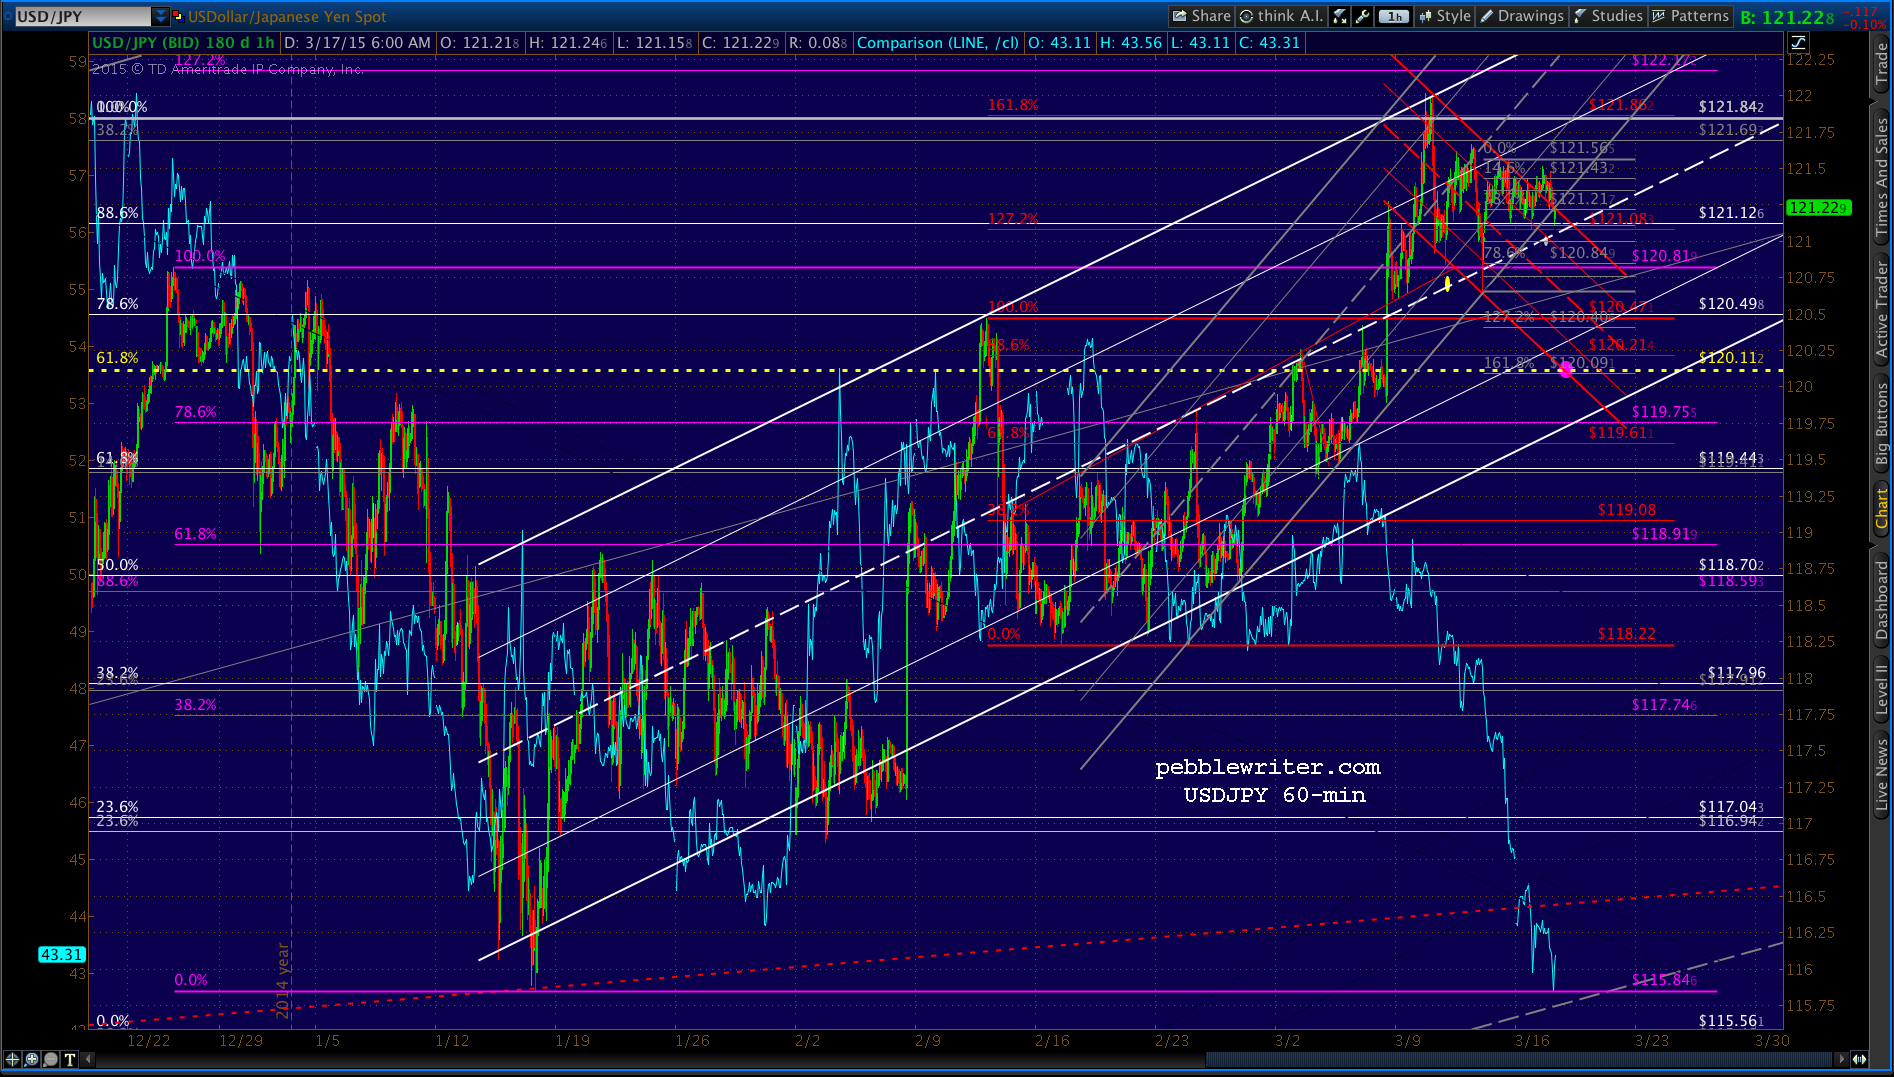
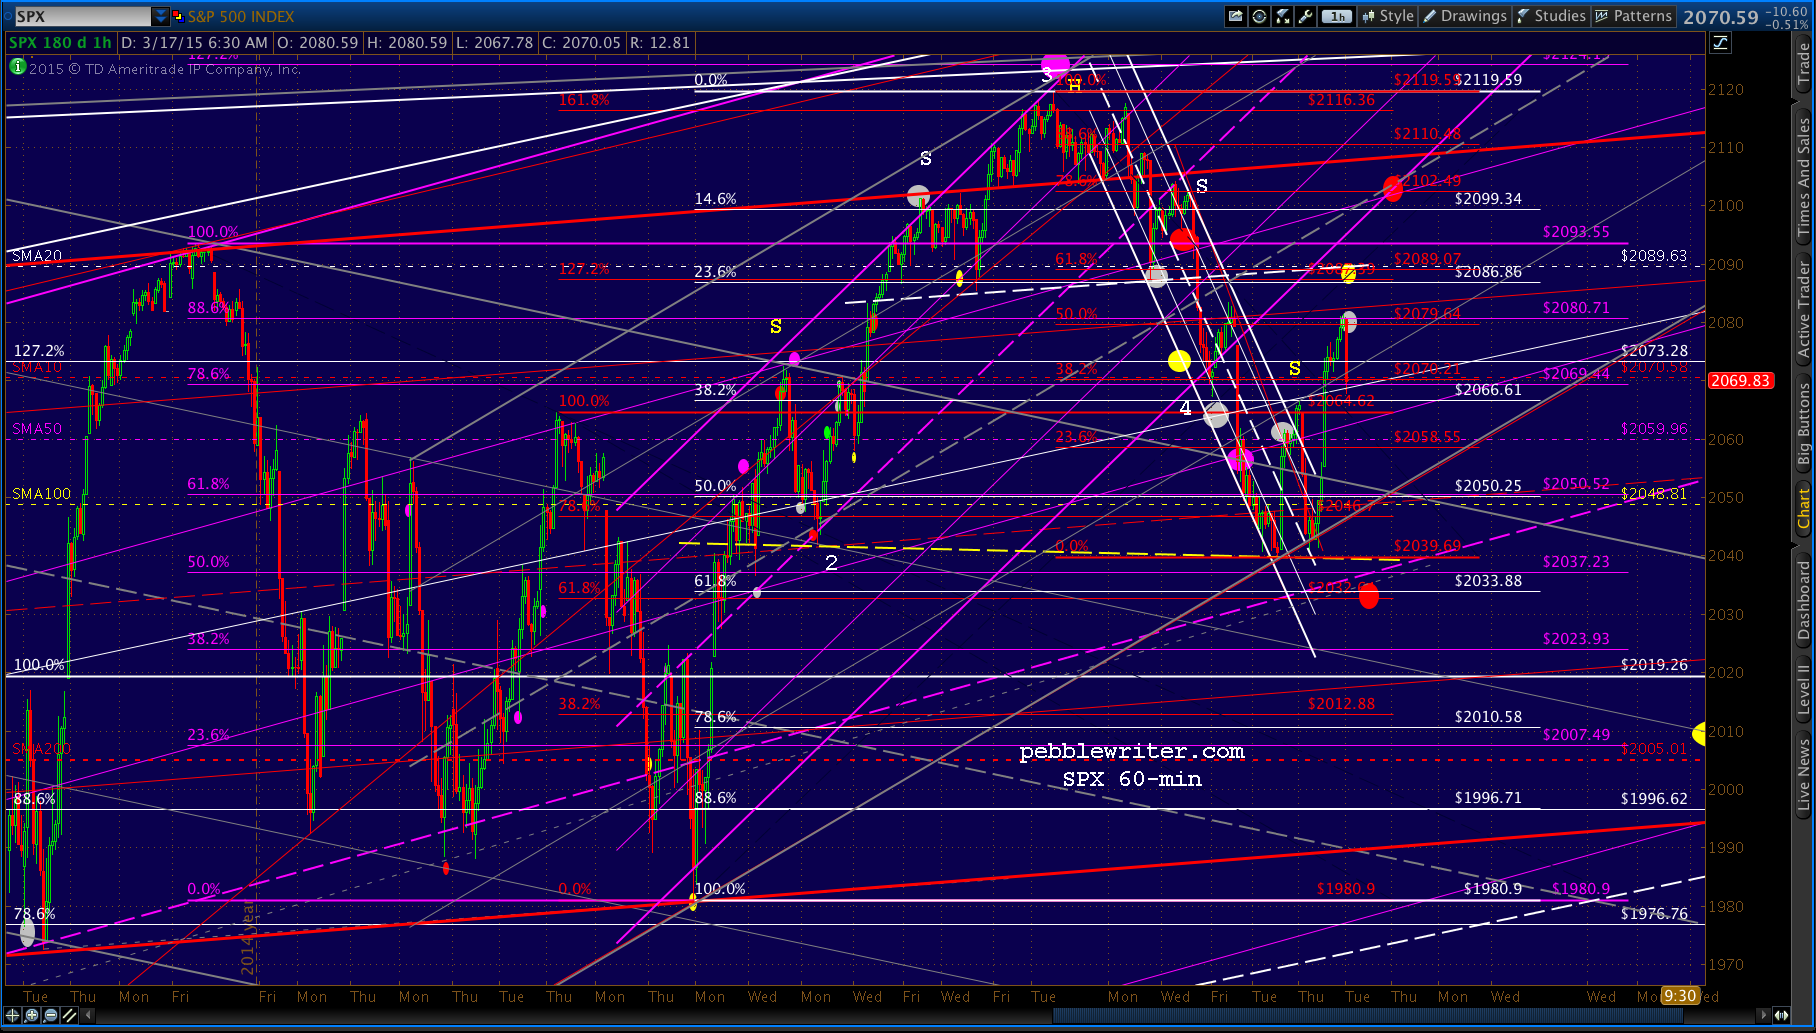
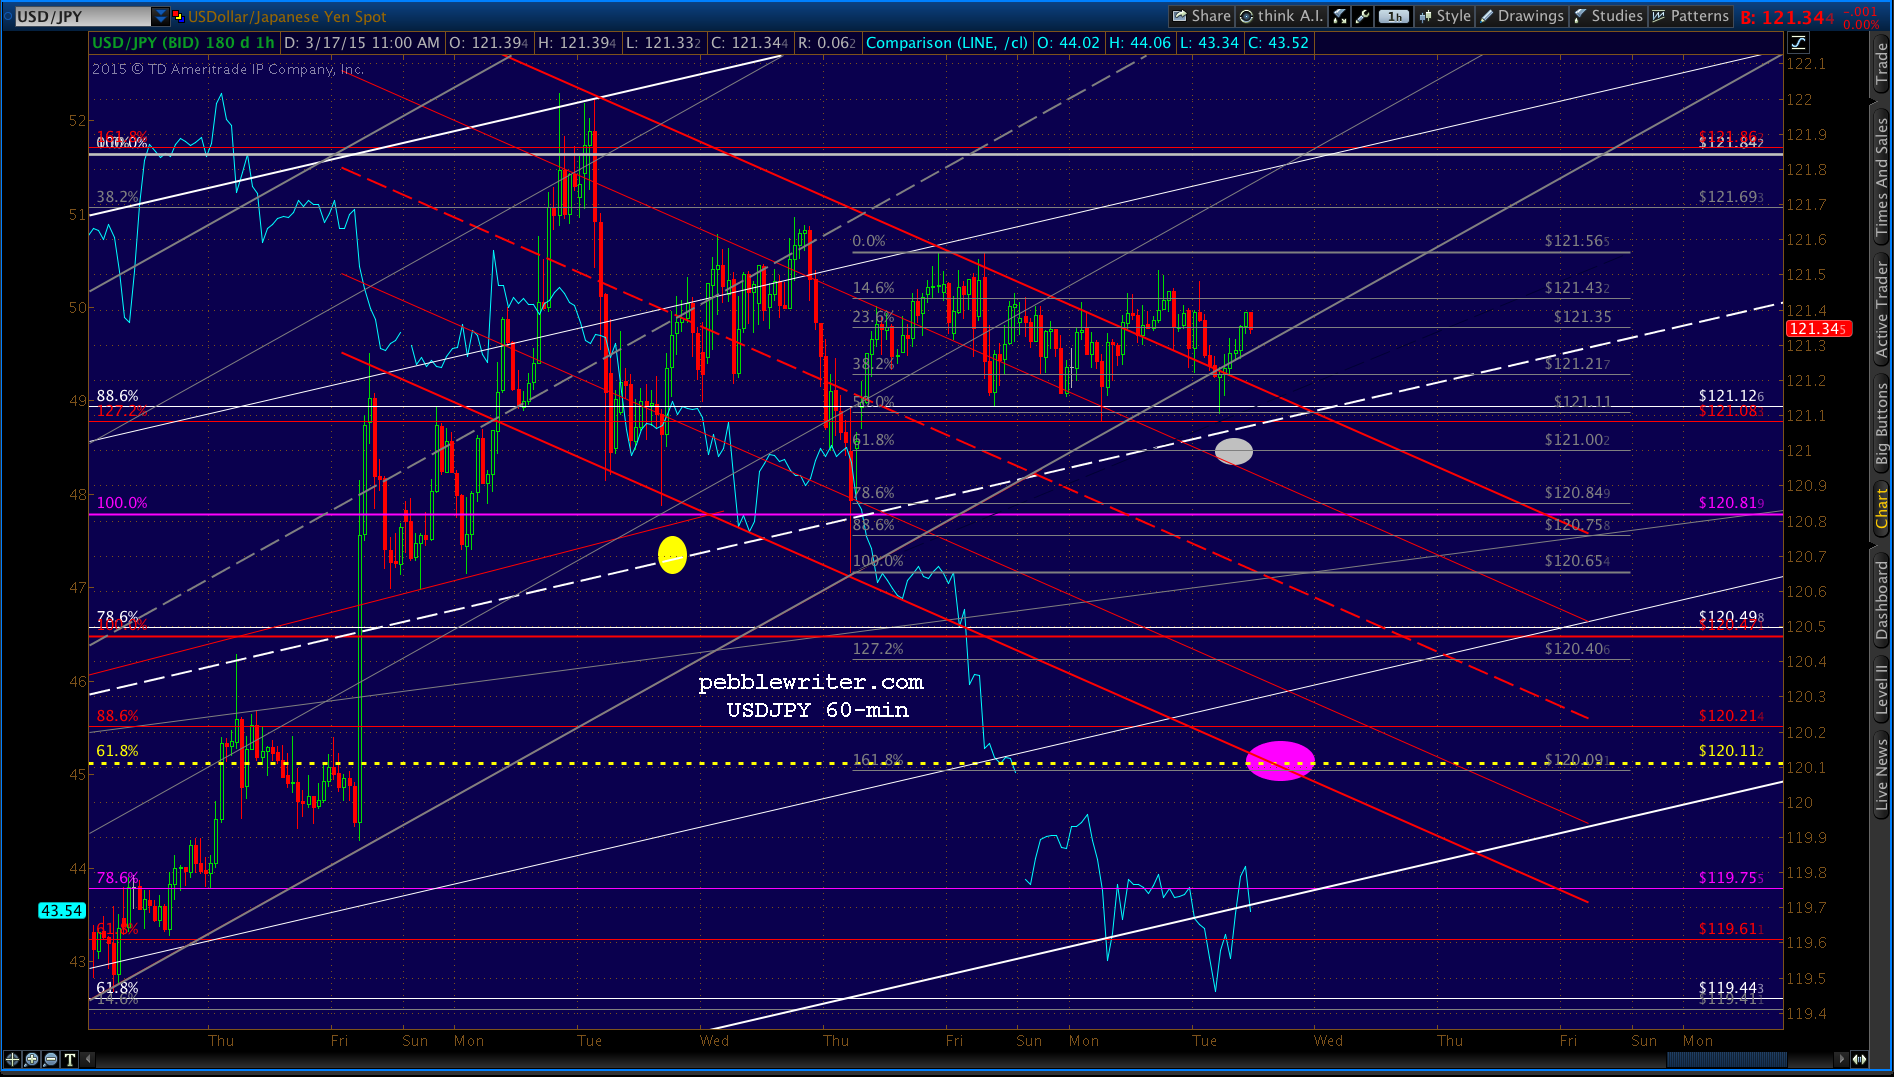
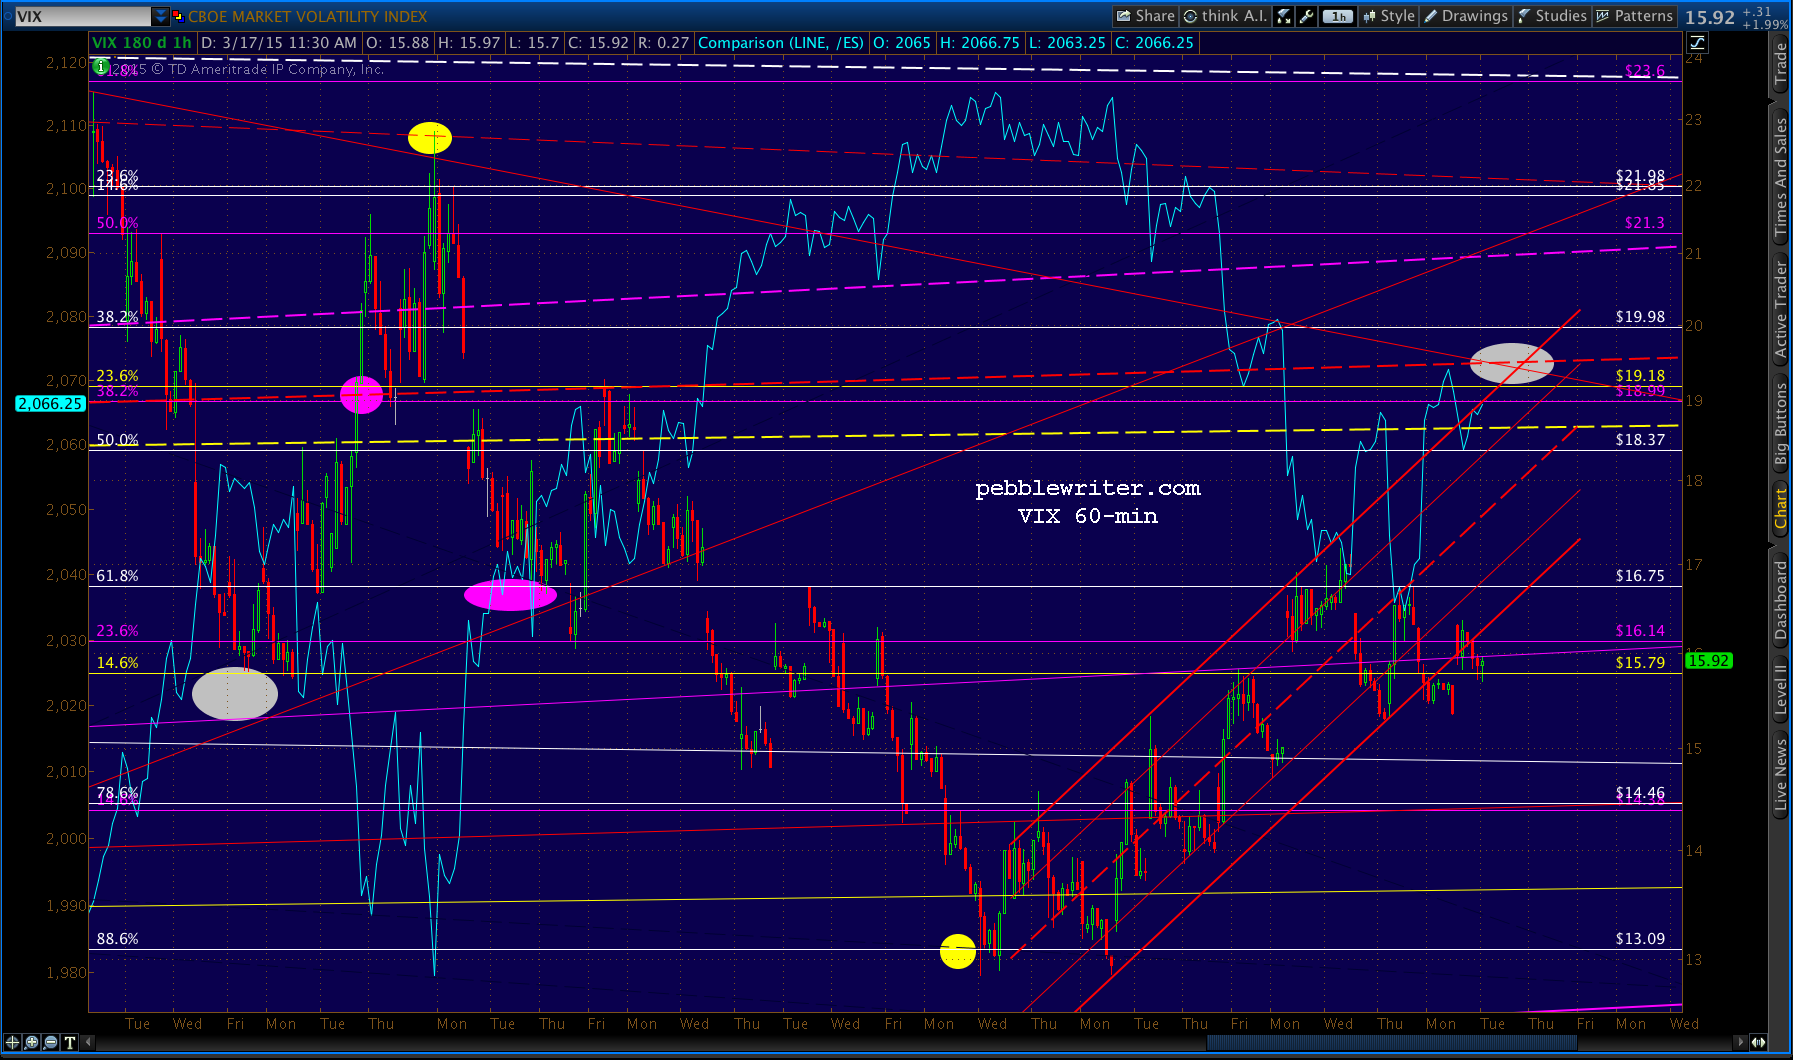
 We also noted as the market opened that USDJPY had dipped below the gray channel bottom for the first time since Feb 26. The degree to which is was allowed to reset would depend on how stocks reacted to CL’s decline and subsequent bounce.
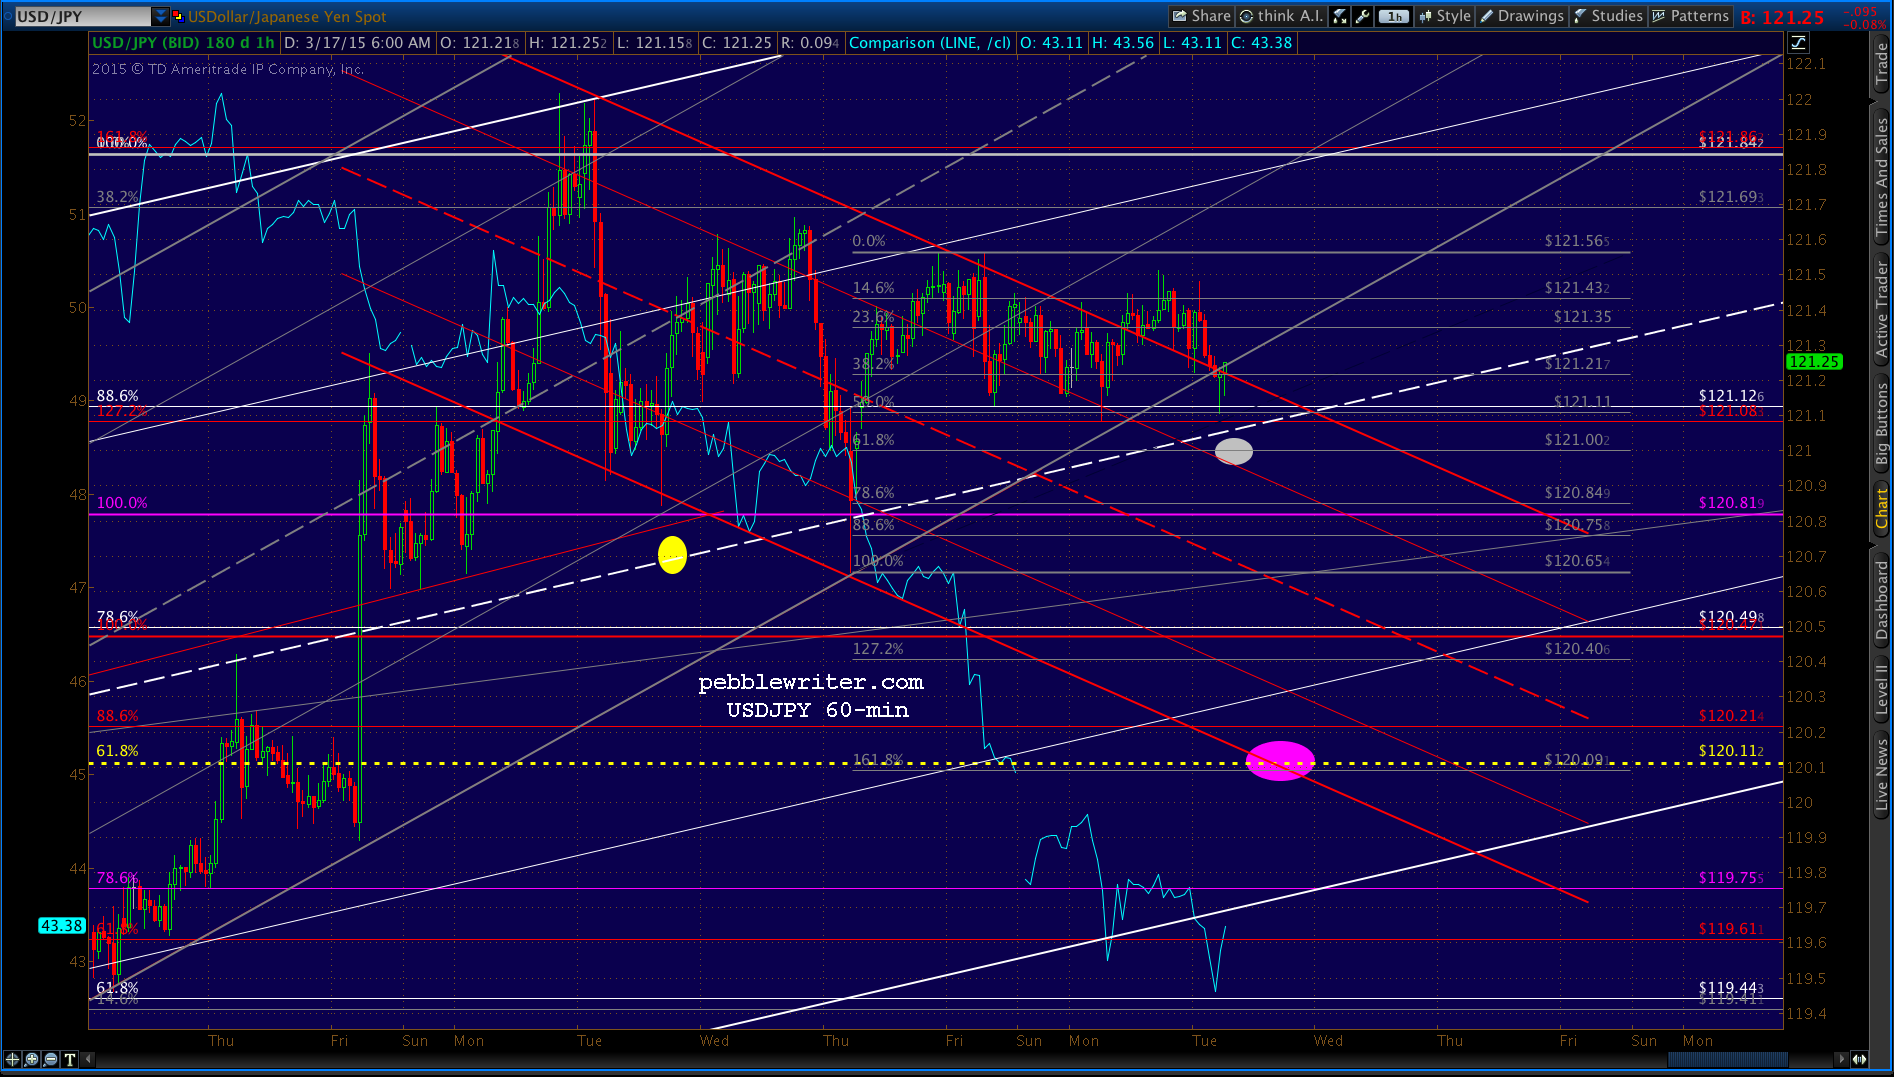
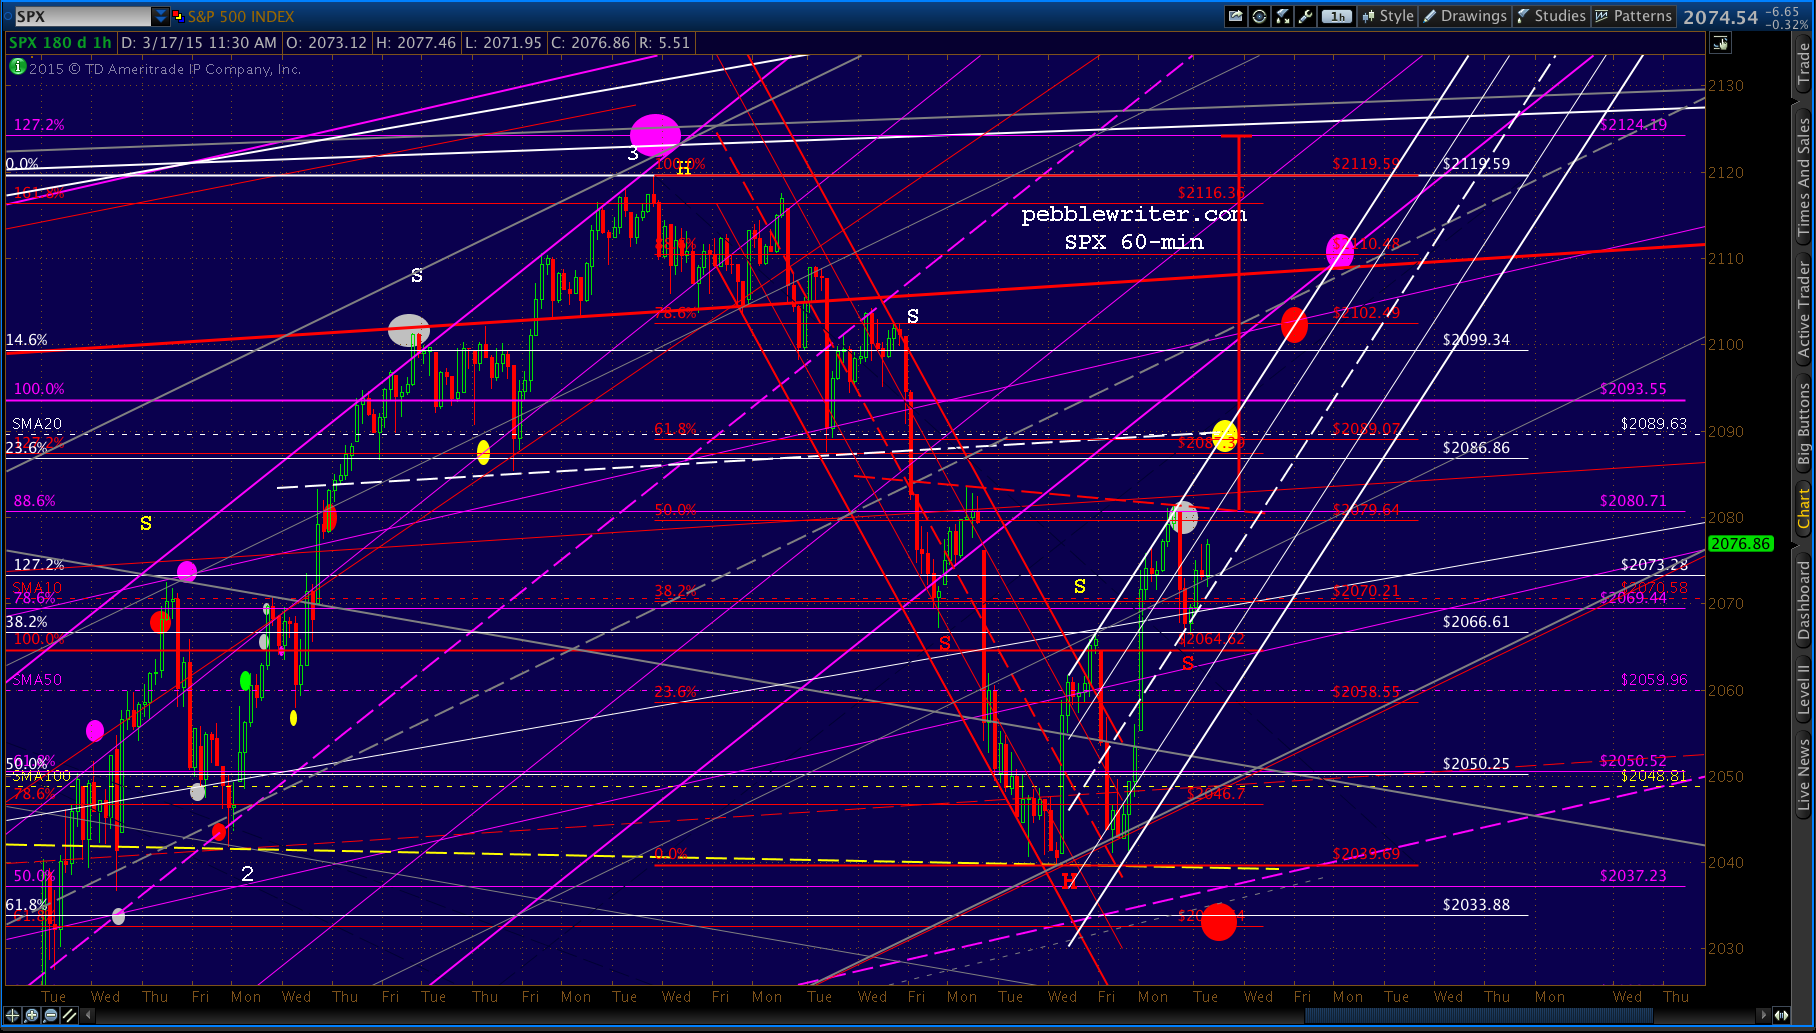
 Stocks started to falter, so USDJPY was brought right back into the gray channel — and, the falling red channel was broken — for the remainder of the cash session. USDJPY was not allowed to decline to the white channel midline until after stocks had closed for the day.
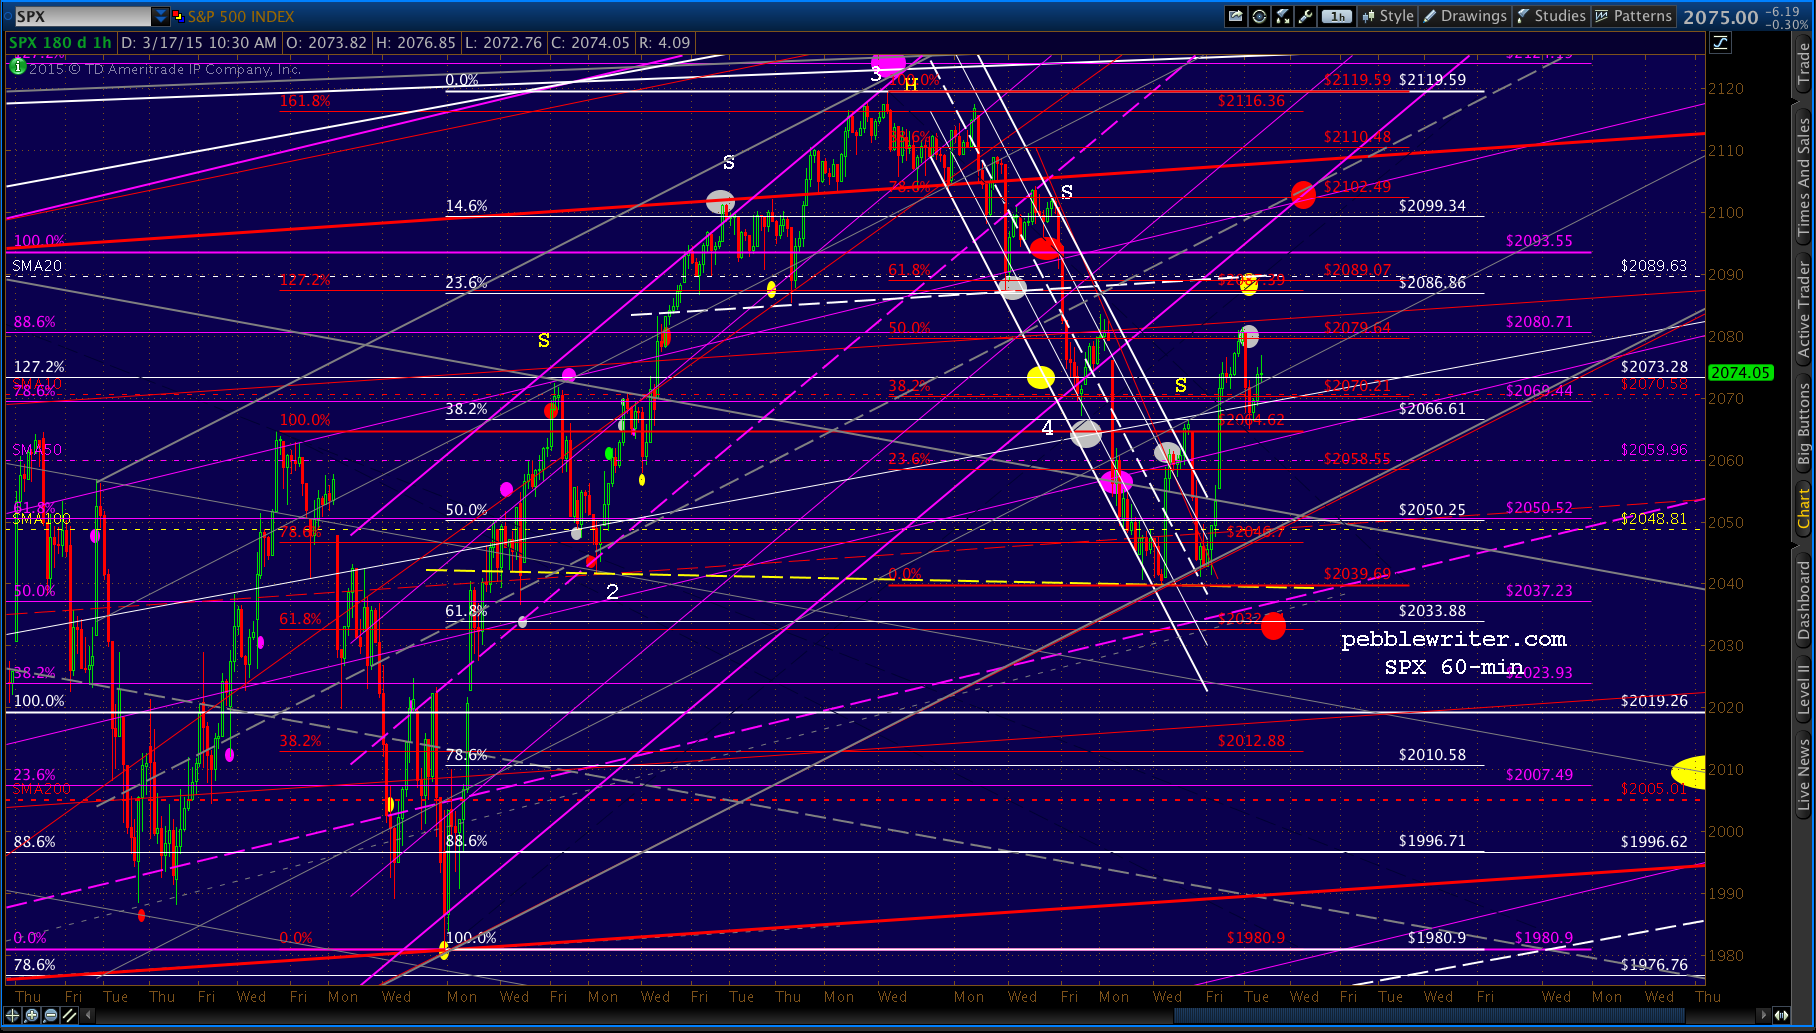
 It broke the perfect little rising red channel, sending a loud and clear message that significant declines would not be tolerated. Not today, with the Fed release coming up at 2pm.
 Oil’s decline has been a godsend for the Fed, which has been struggling to find a way to keep inflation and thus interest rates low in the face of improving headlines. But, it isn’t without repercussions.