

The big picture shows several very significant features. First, the drop from 1998 followed a fairly well-formed channel that was interrupted in October 2011 by a massive QQE expansion. The subsequent yen devaluation (USDJPY increase) sent the pair screaming higher where it barely reacted at the yellow .382 — not even dropping to the next lower Fib level. Another QQE expansion sent it spiking out of the huge channel and up to the yellow .618 at 120.11 where it was quite overdue for a retracement. However, since the pair is carefully managed by the BoJ, and any decline is instantly translated into falling equity prices (thanks to the yen carry trade), it was, again, not really permitted to react.
It has occasionally drifted lower, but as soon as equities start sagging it is immediately brought right back up to that key Fib level. Finally, this past May, it broke out. But, it ran into the rising purple channel that broke down back in 2008.
This backtest has proven problematic for USDJPY’s continued upside, as has the BoJ’s pause in announcing additional QQE. USDJPY dropped back down and backtested the .618 (well, almost…stocks had a hissy fit) before zipping back up to retrace .886 of that particular drop on Aug 12.
That’s when the wheels came off the bus. China and nearly all of SE Asia was in trouble, and all that hot money was flooding back into and strengthening the yen (weakening USDJPY.)
continued for members…
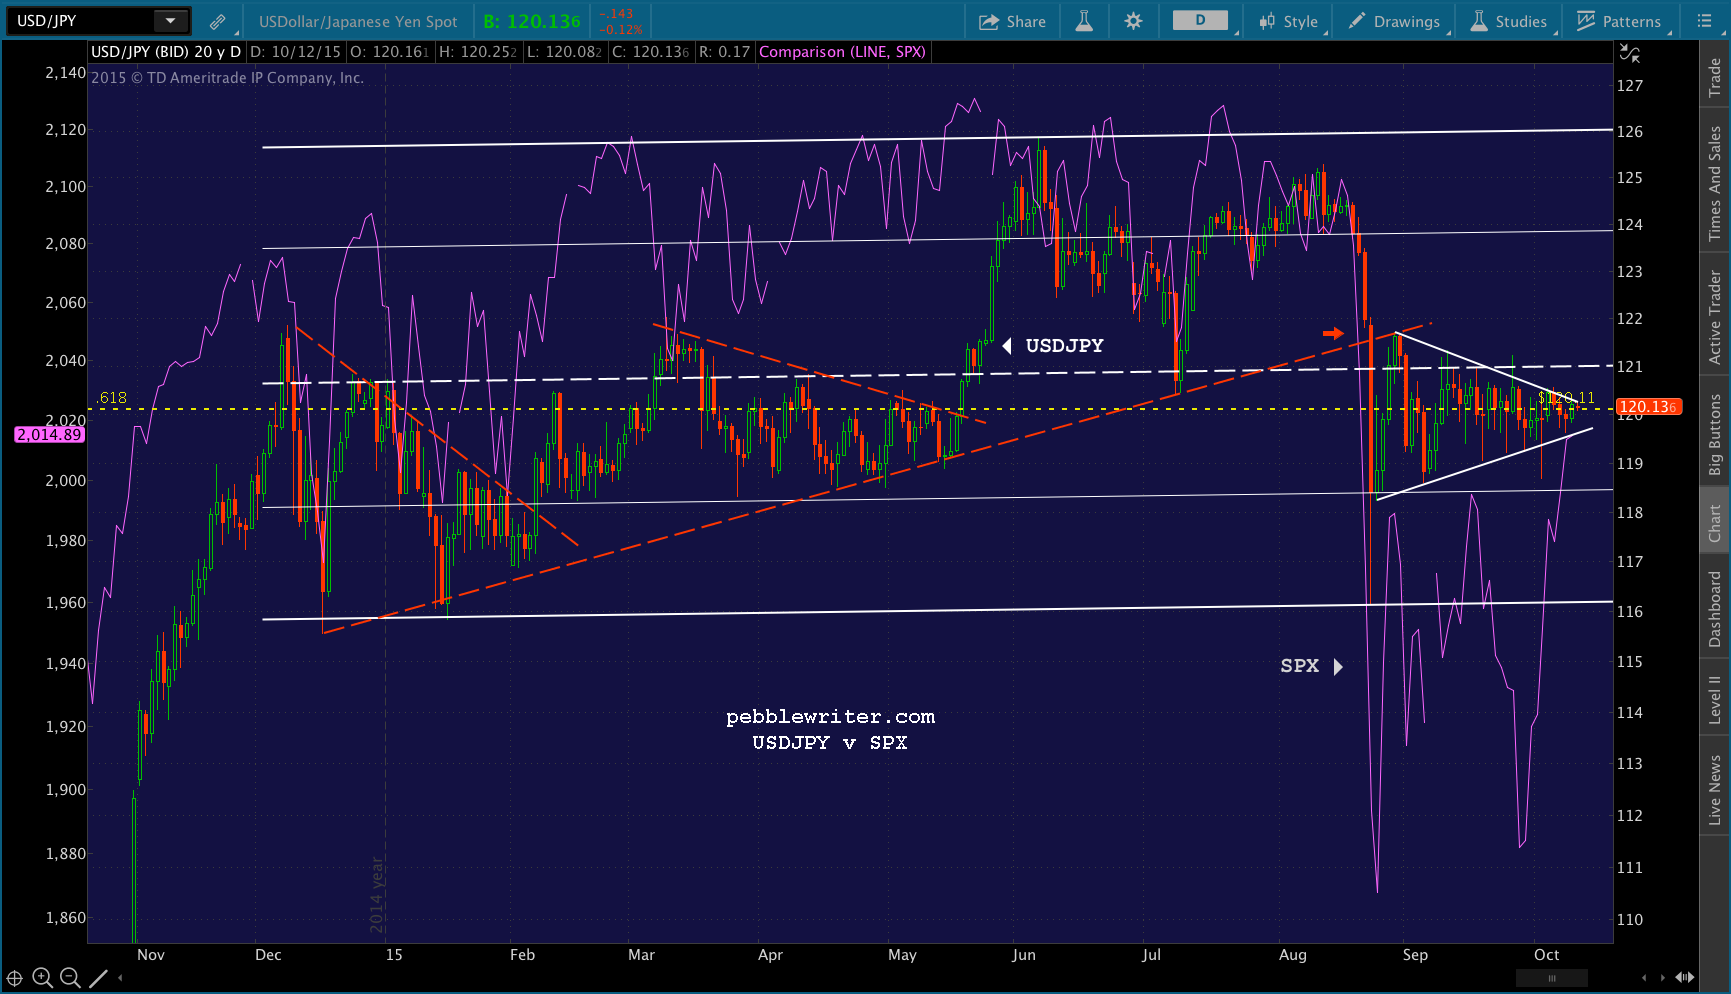 When the red TL from December was broken, the impact on stocks was dramatic. SPX, shown above in purple, fell 238 points (11.3%.)
However, central bankers were able to stem the tide — holding USDJPY to a decline that remained above last December’s lows and kept the uptrend (barely) intact.
Putting it all together, we get a picture of a tightly-controlled experiment that came very close to a very messy implosion. In the 6 weeks since Aug 24, however, central bankers have done a pretty good job of glossing over the economic turmoil underlying global equity valuations.
But, they haven’t yet answered the most important questions: will they further expand quantitative easing? And, whether or not there’s additional easing, will they continue to devalue the yen? In my opinion, they have no choice [see: An Offer Japan Can’t Refuse.] The question is “when?”
Since Aug 24, USDJPY has established a well-defined pennant pattern that is coming to a head in the very near future.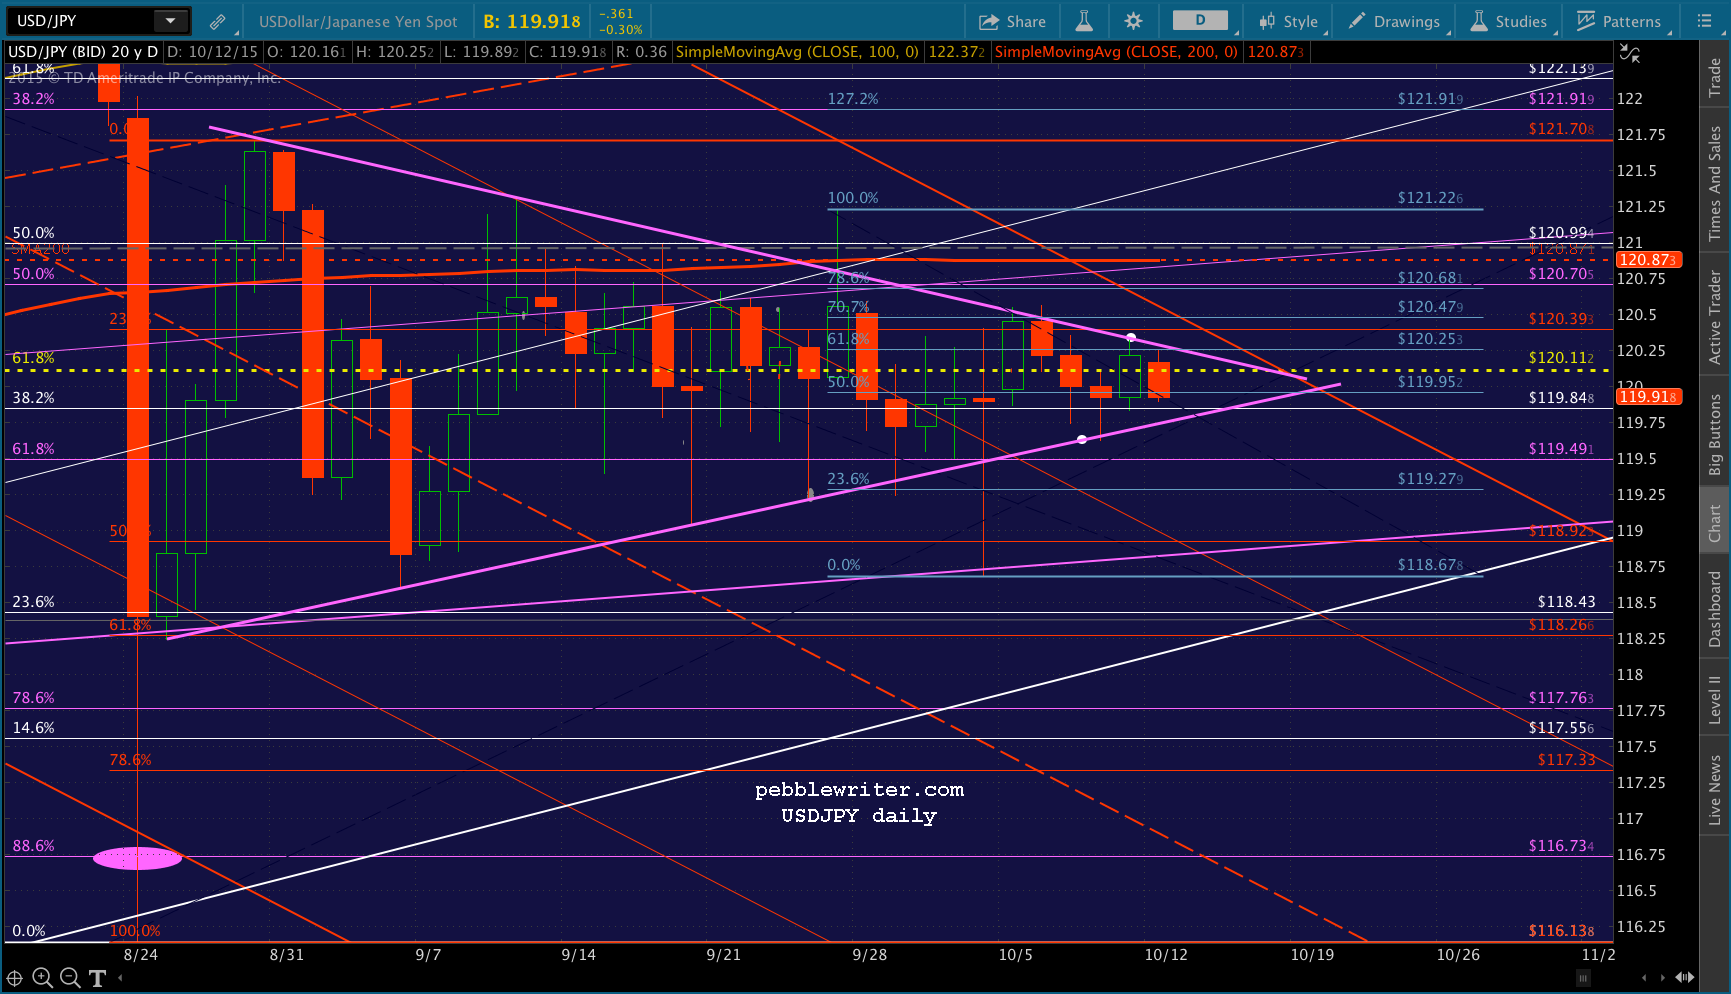 Pennants are consolidation patterns that almost always precede breakouts or break downs. This one is no different. I’ve written much [see: The Big Picture] about the reasons why BoJ might or might not expand QQE, but there are no guarantees. If there were, USDJPY would have made a move by now.
The next BoJ Monetary Policy Meeting is on Oct 30. Hopefully, we’ll have more clarity about their intentions by then.