NKD finally tagged our next downside target yesterday, enjoying a huge 5.3% bounce afterwards. It was made possible by USDJPY. It’s been a month since USDJPY began forming the triangle that has whipsawed markets on a daily basis. Yesterday, after the US close, it broke out. But, it’s not out of the woods just yet.
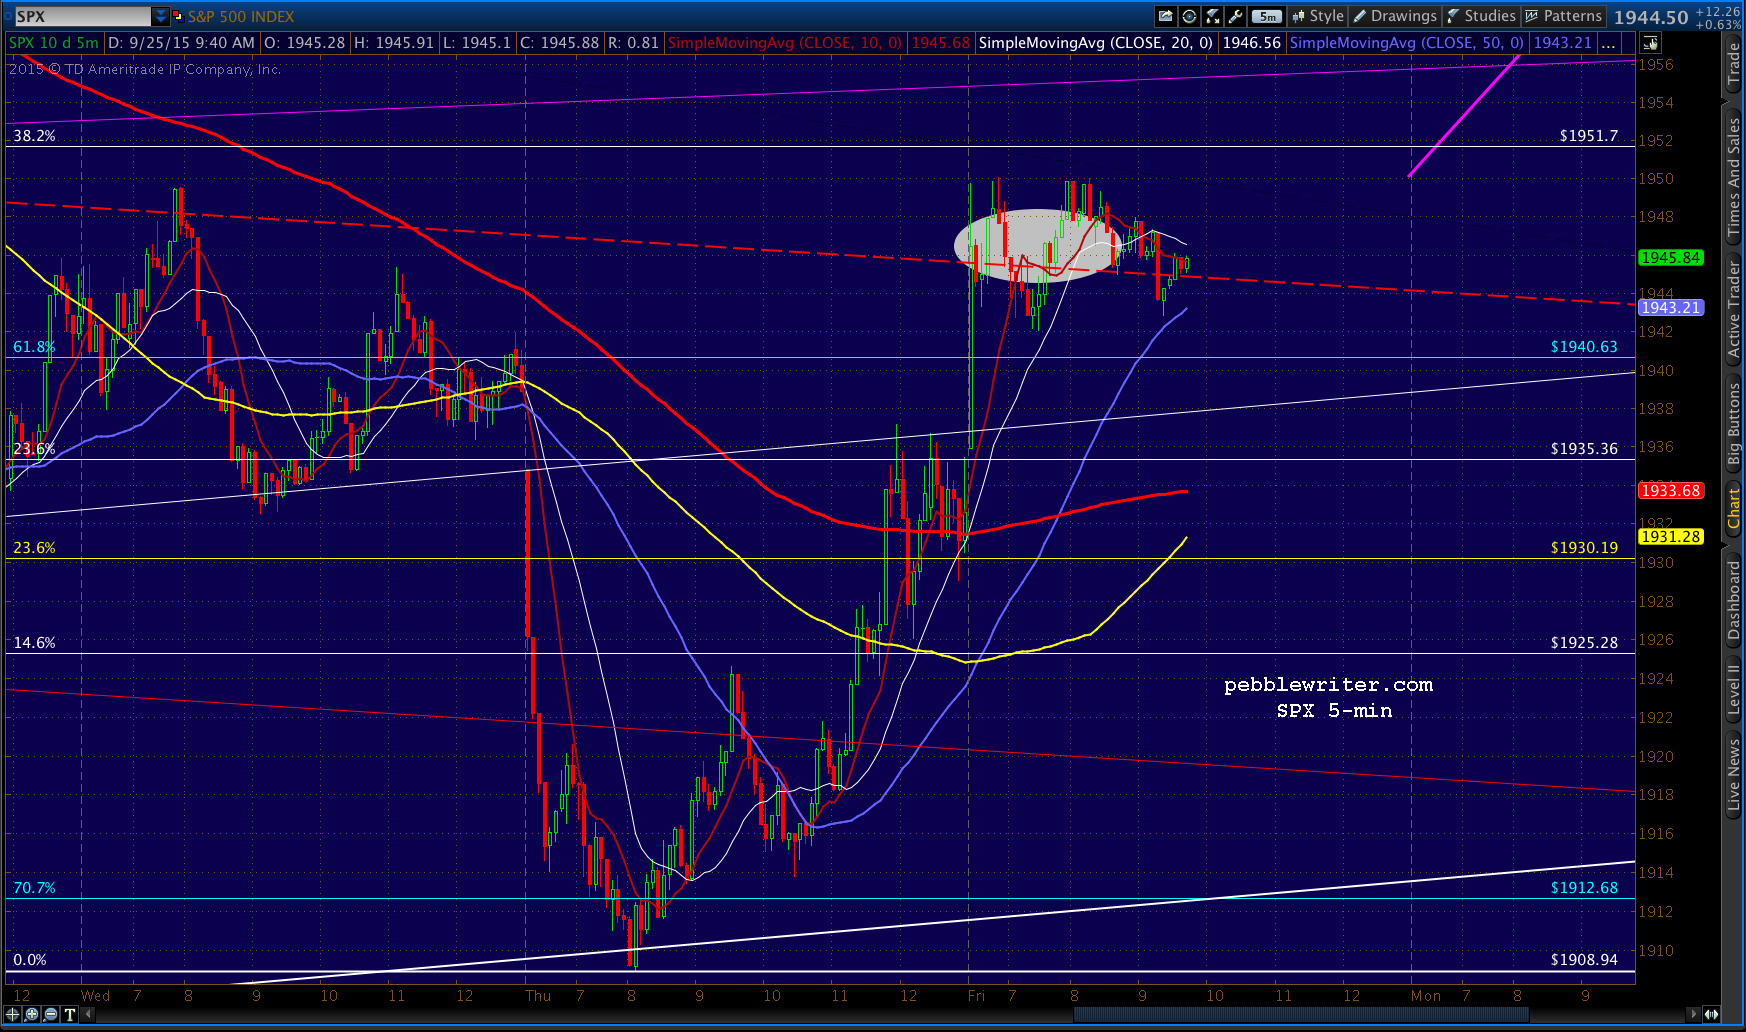
Note that it’s still being constrained by the SMA200 — which means SPX might not go anywhere after this morning’s initial pop.
continued for members…
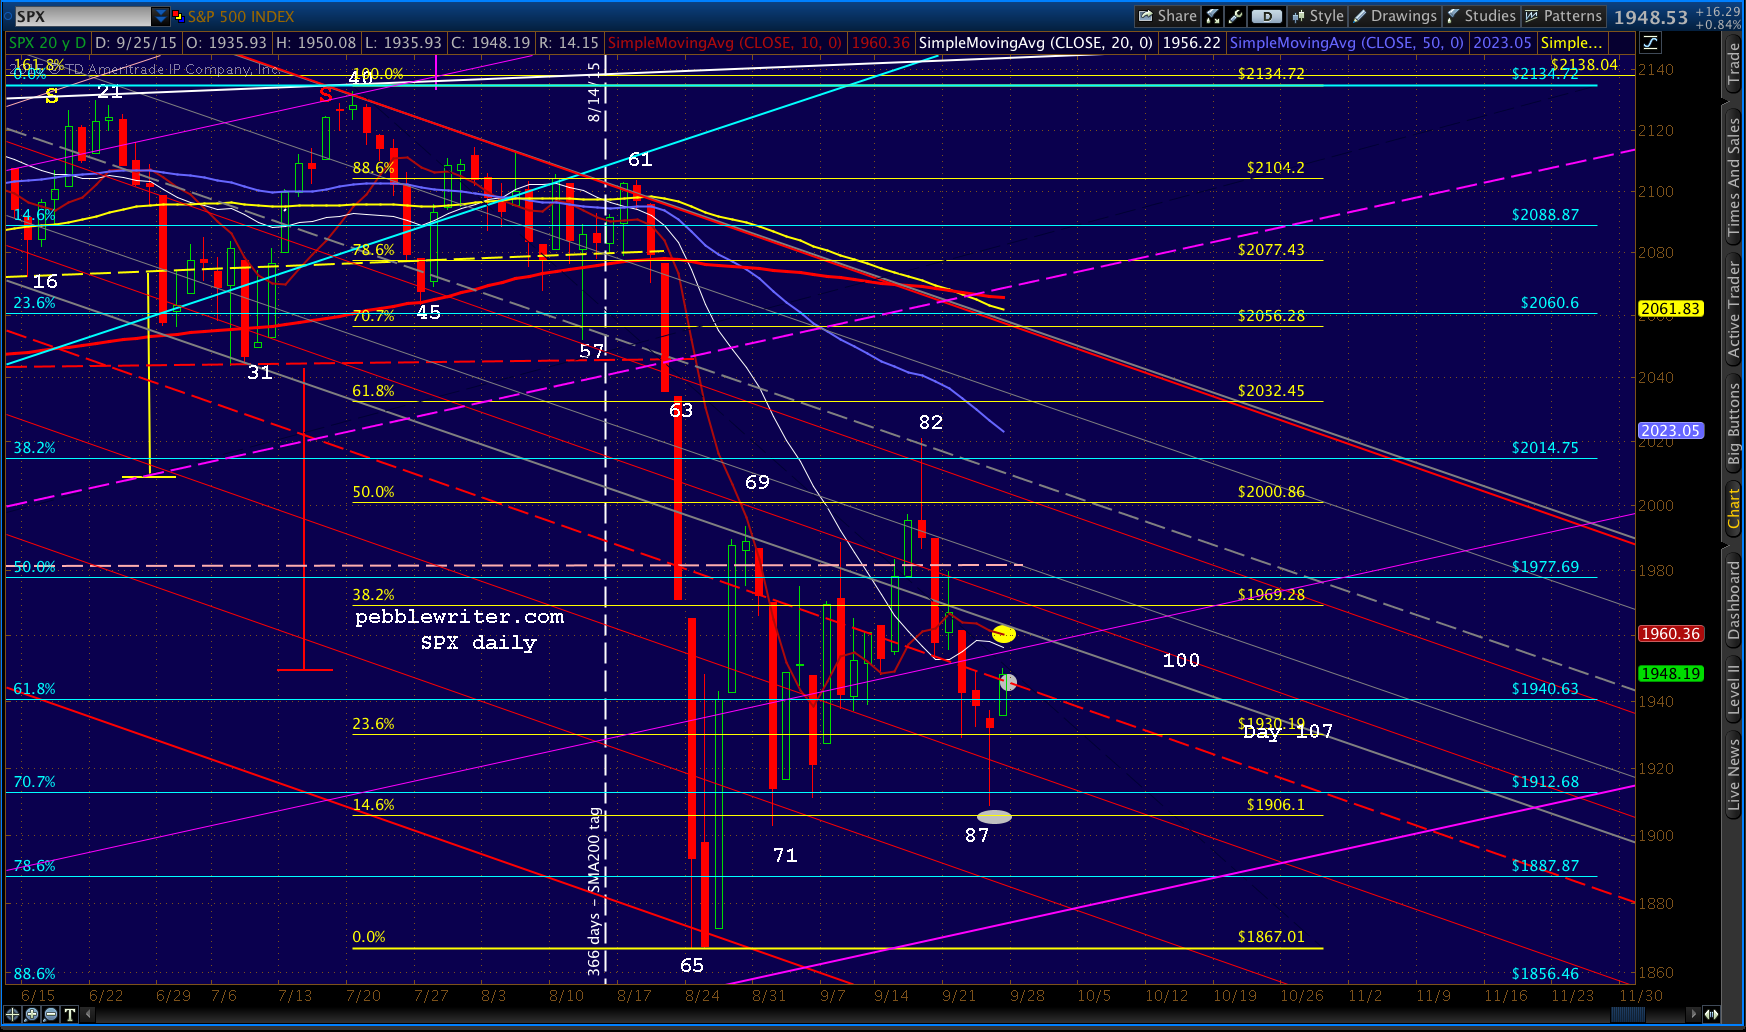
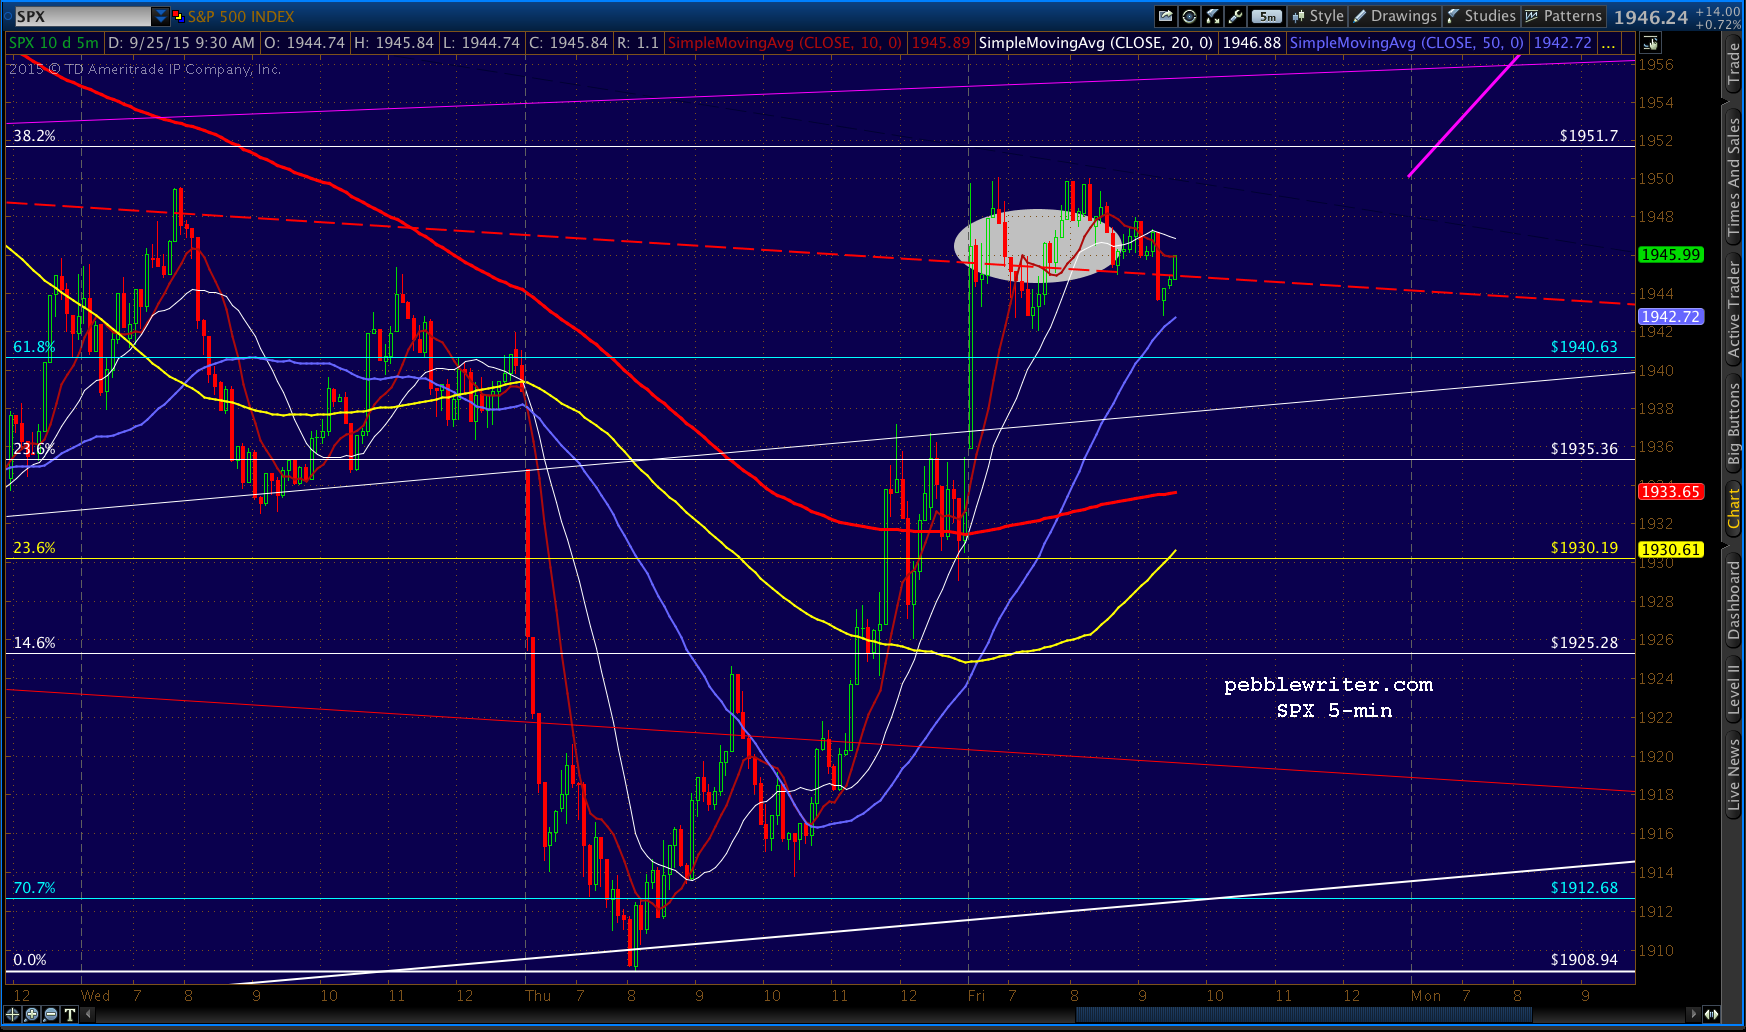
 Nevertheless, it should be enough to get SPX up to the red midline (1945) and, if it passes that, the SMA20/10 at 1958-1960.
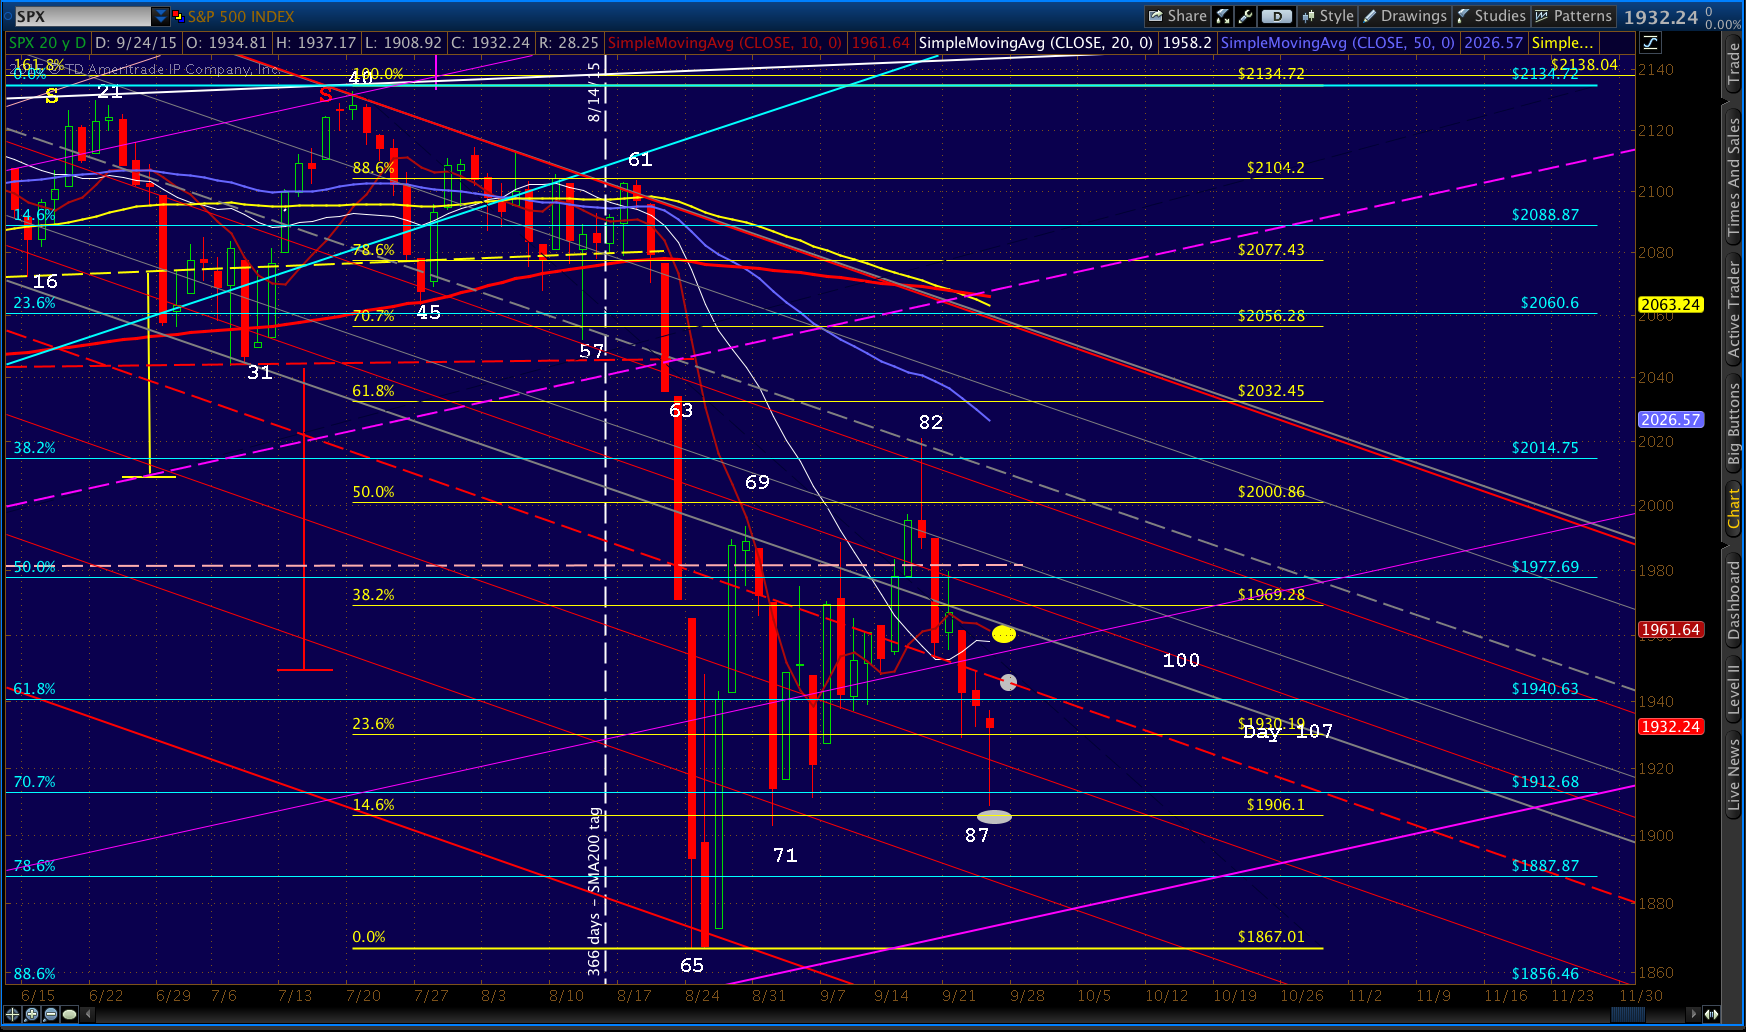 UPDATE: 9:32 AM
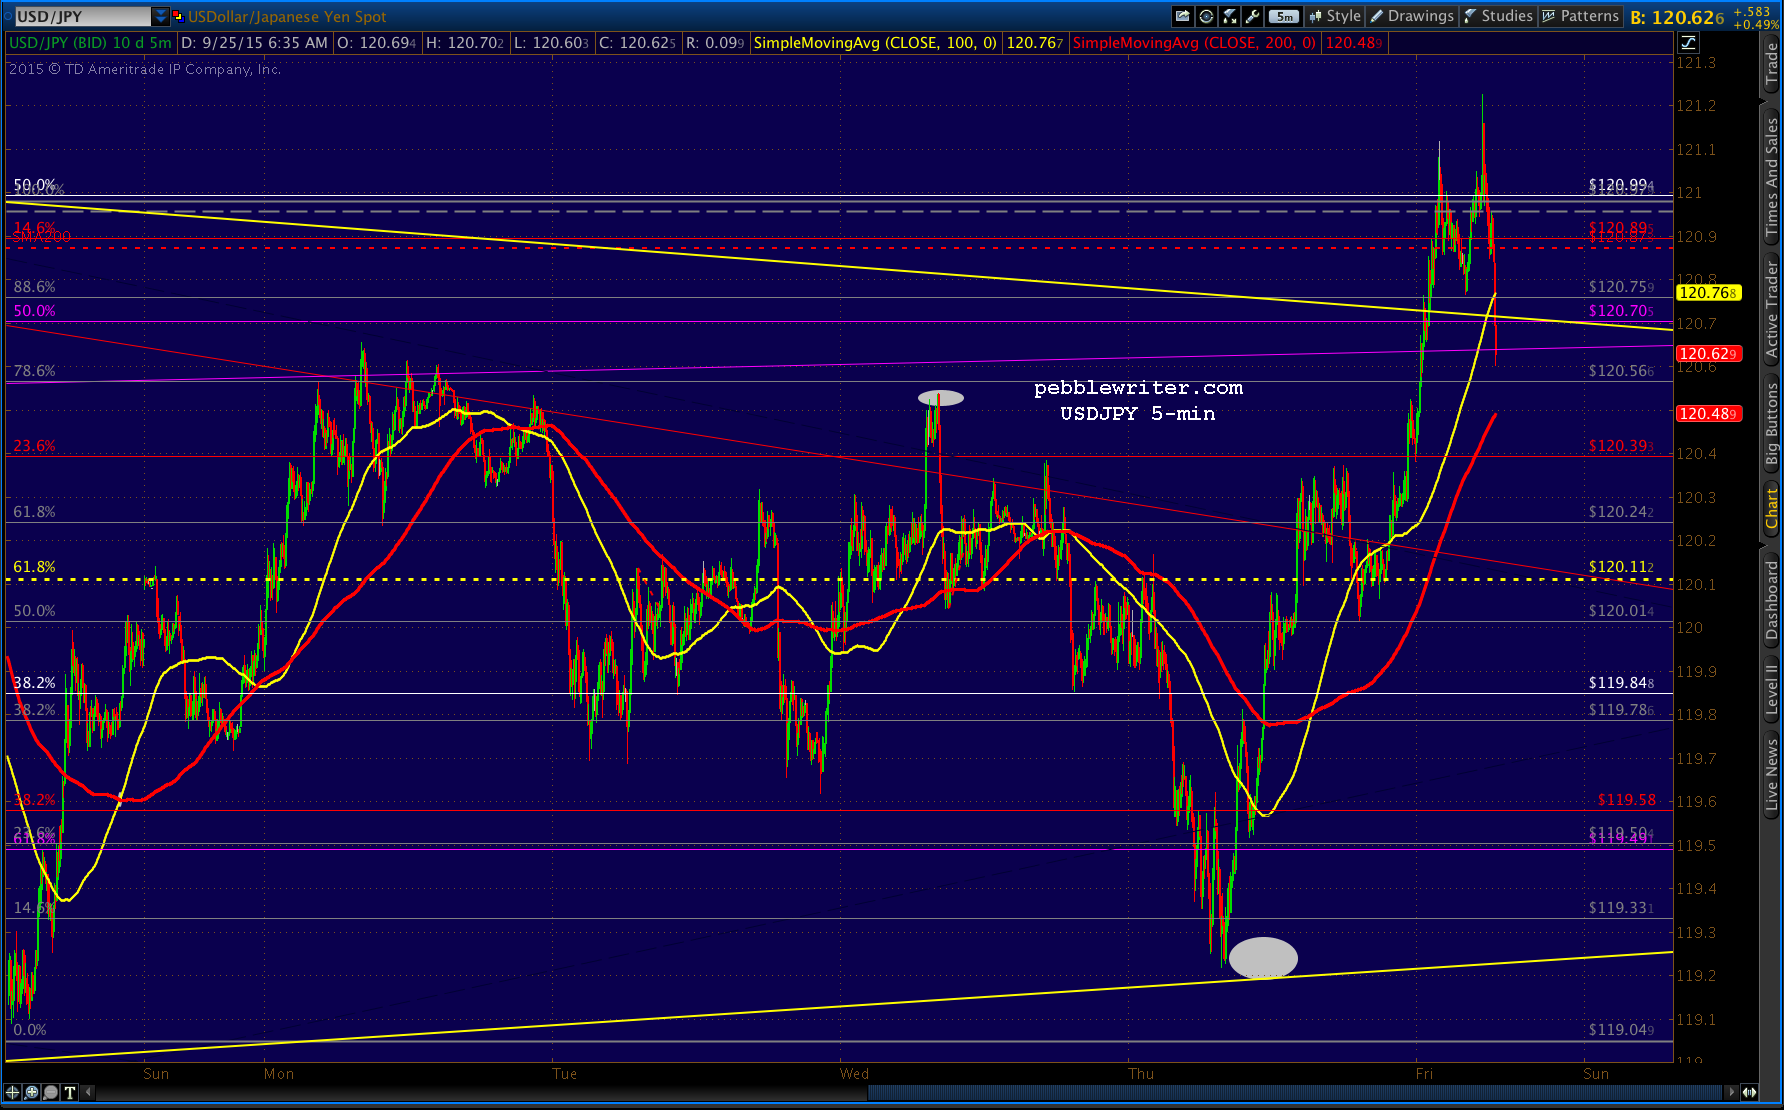 Abe and Kuroda met this morning, supposedly to discuss ways to boost the economy. It was seen as a planning session for more QQE. But, a ramp that immediately falls back below a month-long triangle is not a very good sign.
If it pops back above the SMA200, then fine, I’d go long — though how long it lasts would be very much in doubt. This is lame, lame, lame.
UDPATE: 9:55 AM
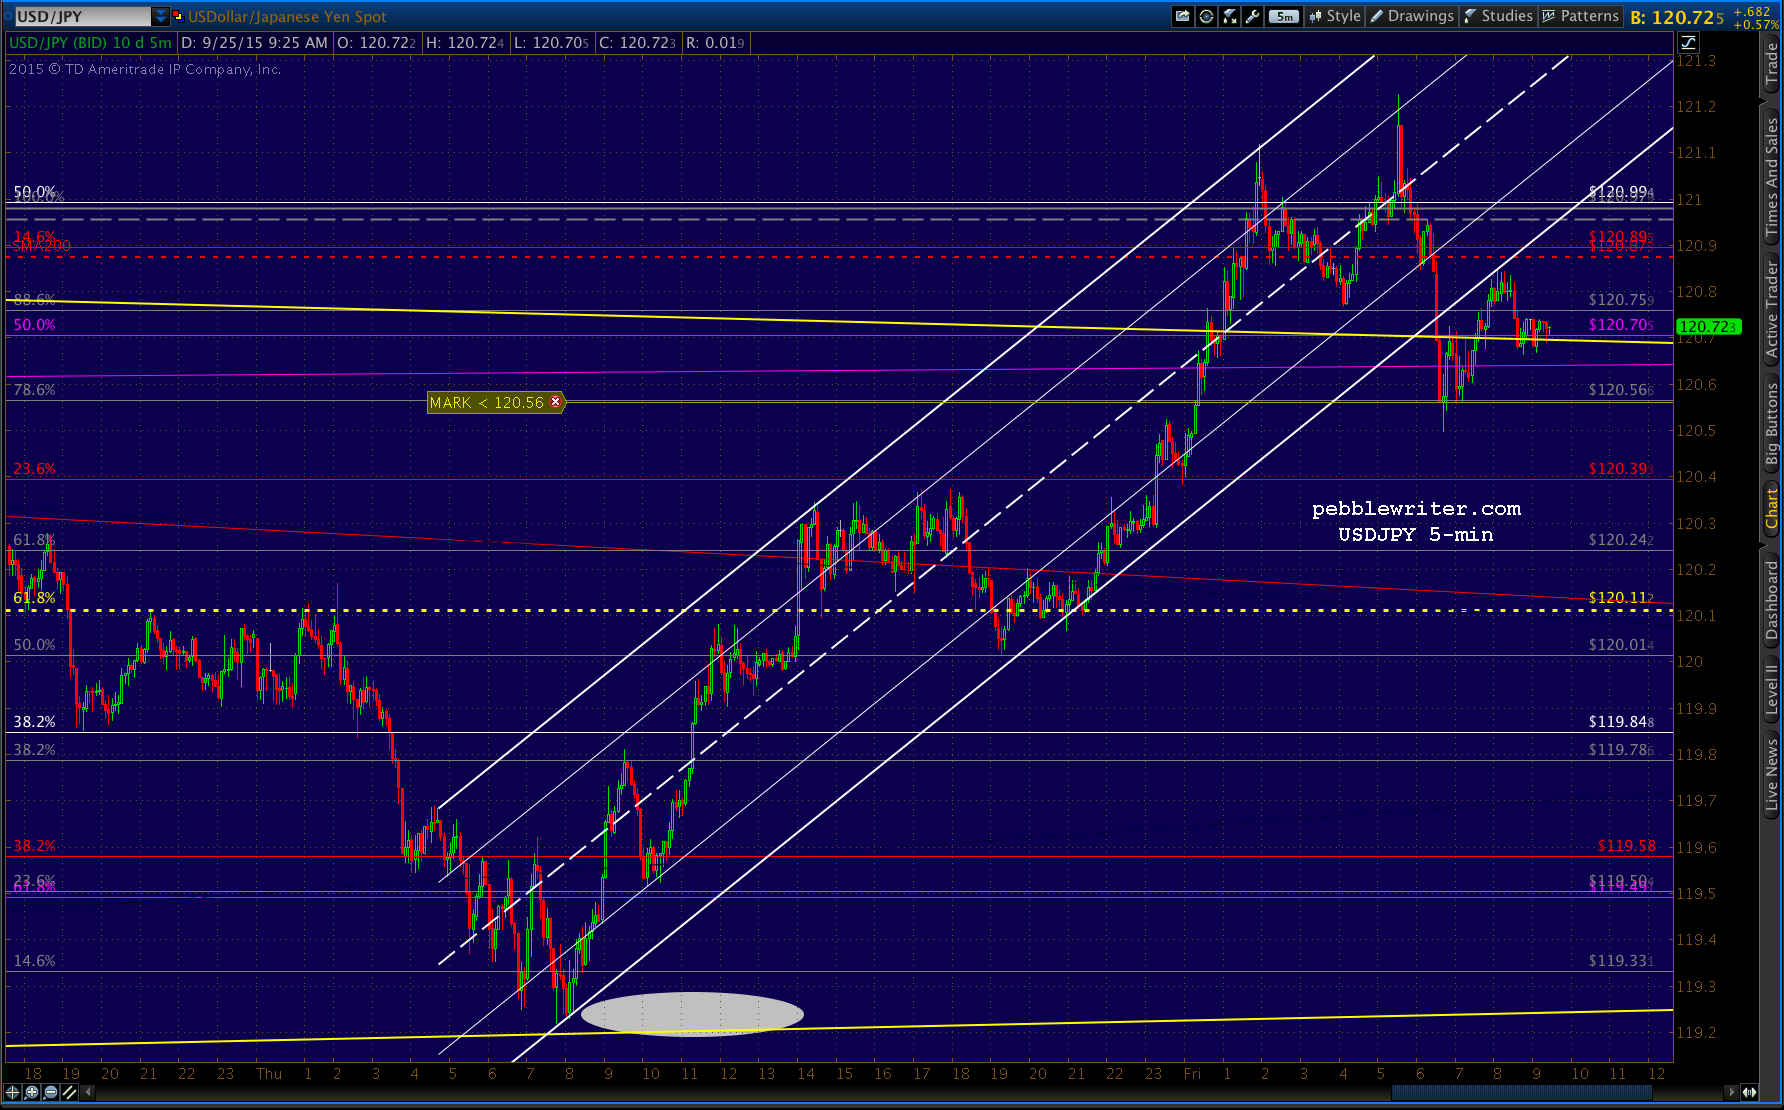
USDJPY has rebounded to the triangle top, which is backtesting along with a broken TL of support (white.) 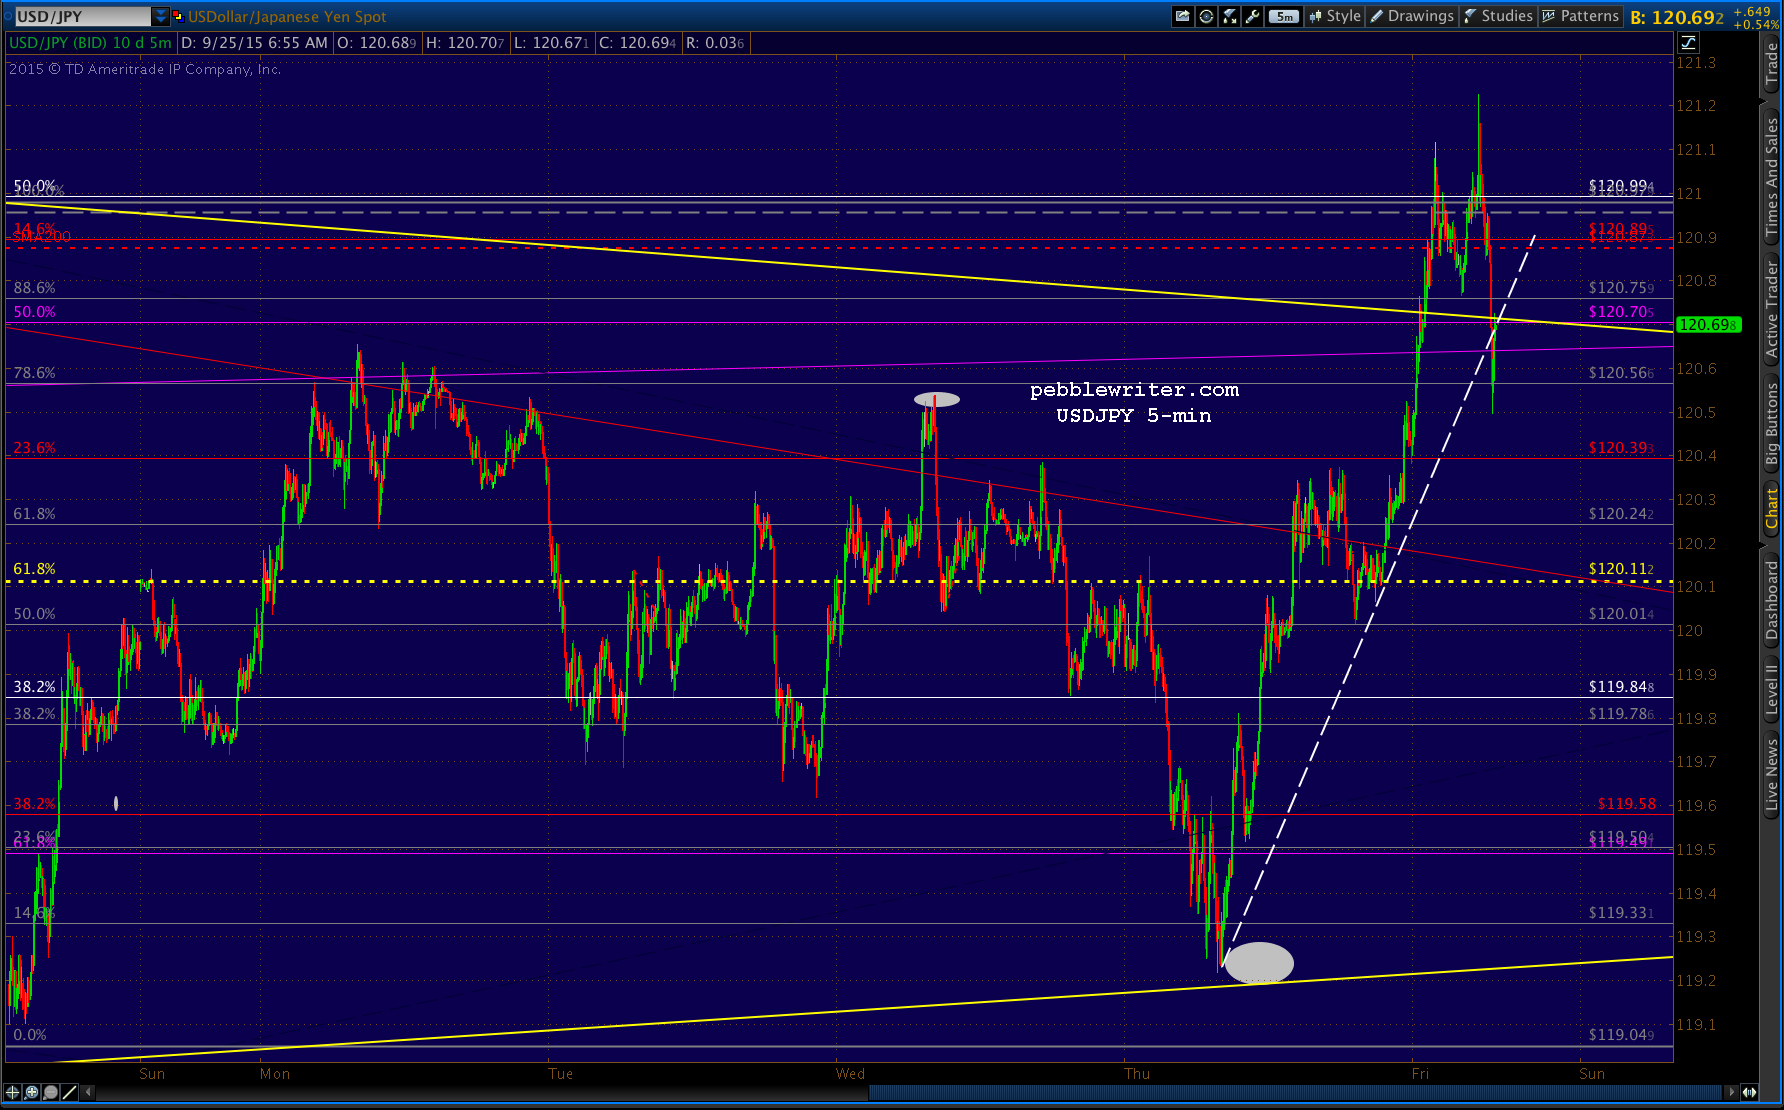 Following its failed (so far) breakout, the algos got CL into action — breaking above a recent TL and up almost 3% on the day (Japan’s punishment for no follow-through?)
The problem for bulls is the substantial overhead resistance in the form of the purple channel and other midlines, as well as a solid TL that has capped off previous rallies.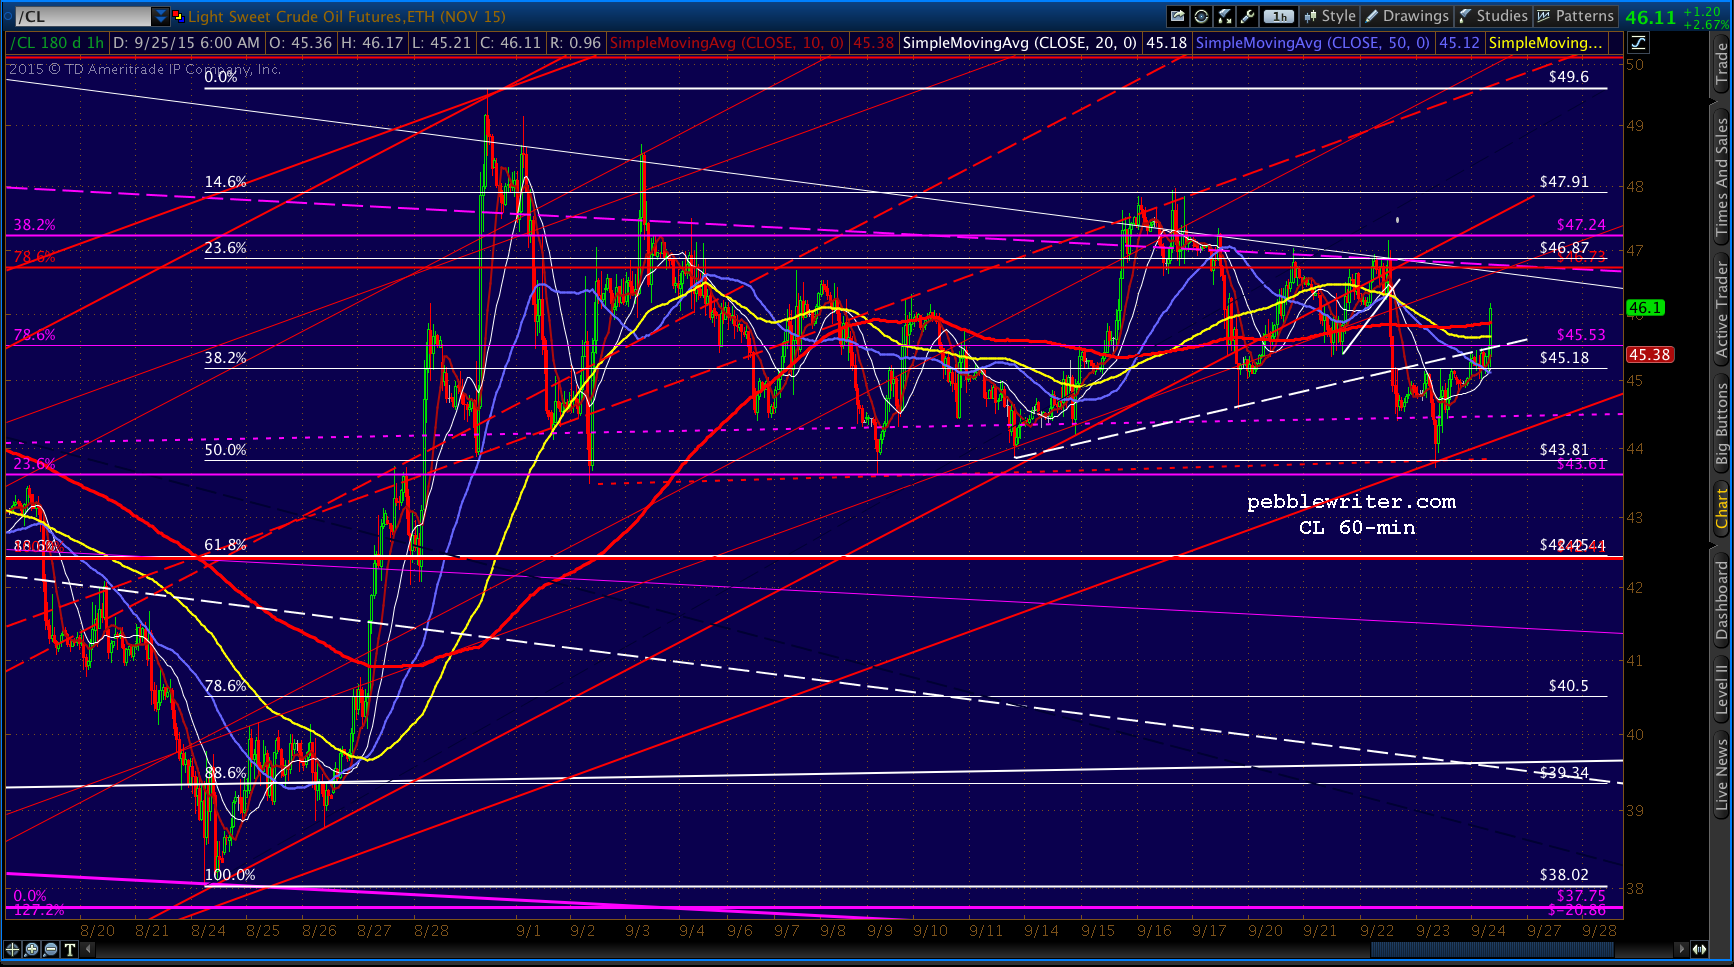 Doesn’t matter, as it’s enough to prop SPX back up at 1950ish. Watch your stops here, folks. This is getting very squirrely. Probably better to stand aside and see what happens, especially with this being Friday.
UPDATE: 11:13 AM
 I’d only reopen it if one of two things happens — USDJPY retreats back below the triangle upper bound…
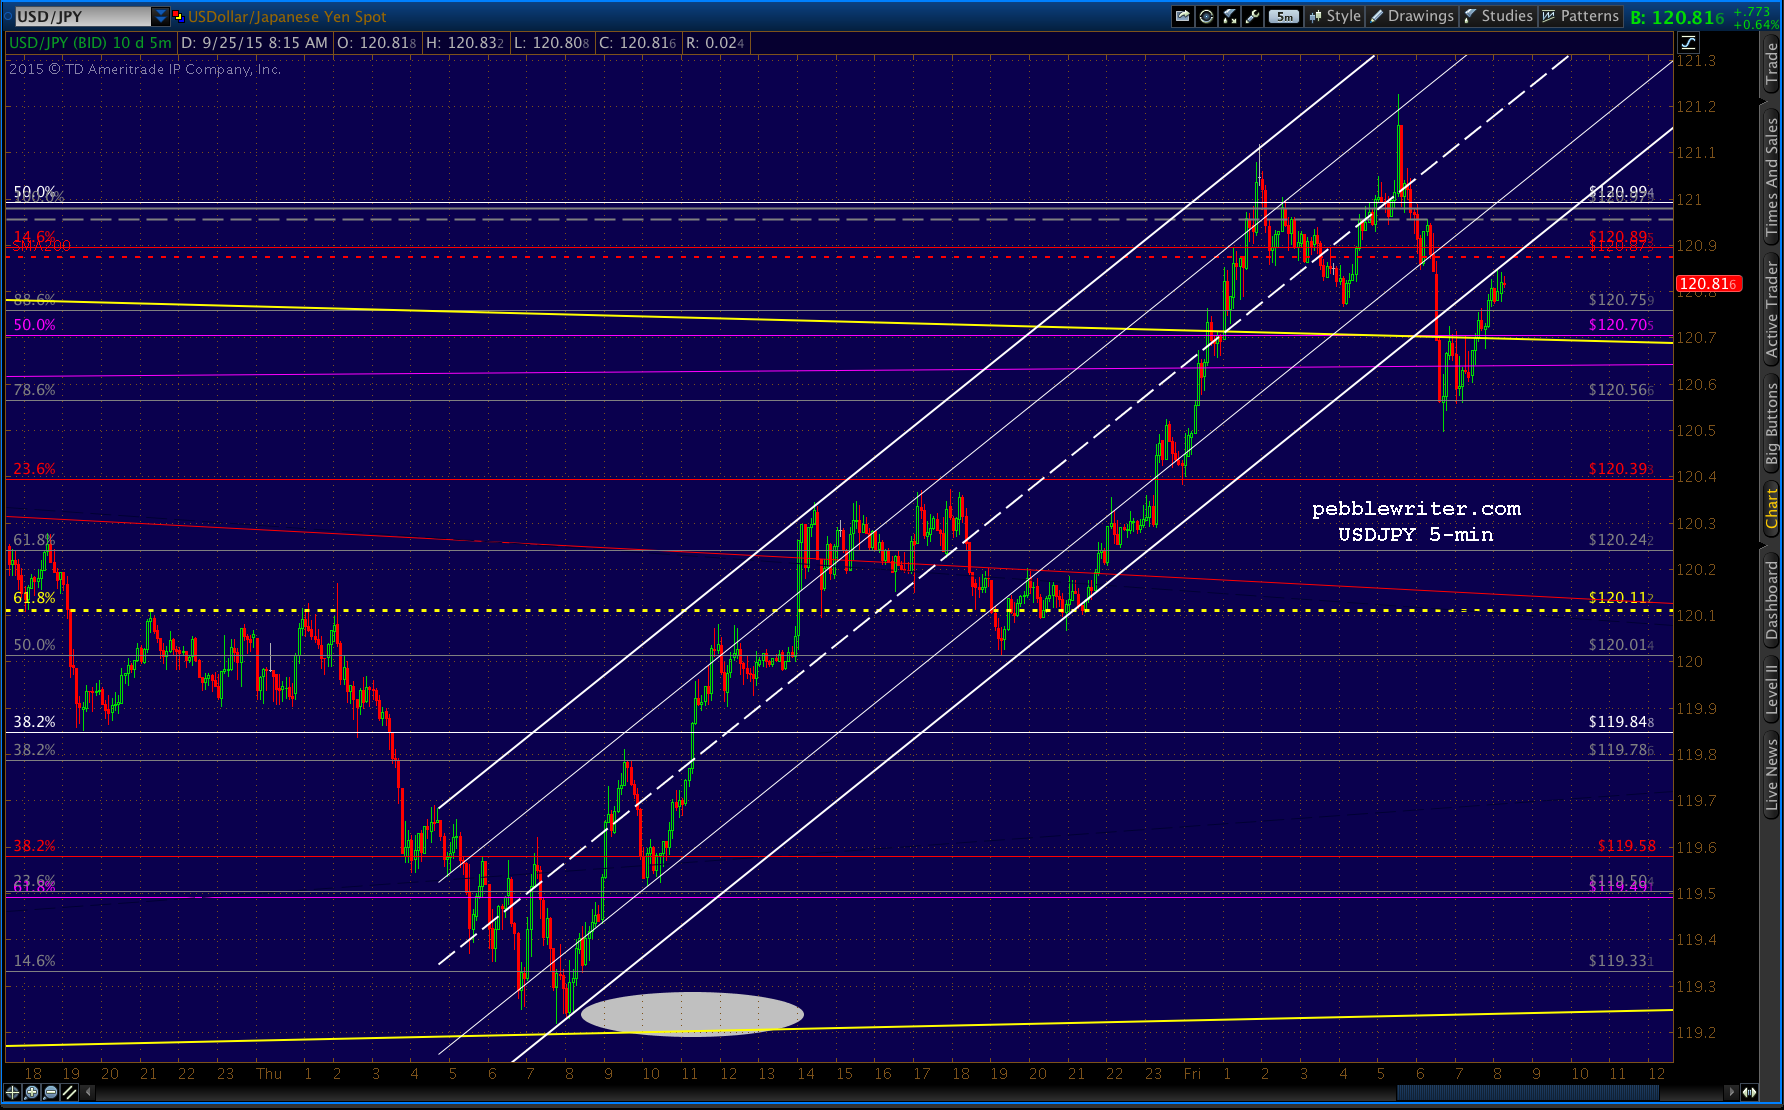 …or, VIX tops the lid they’ve put on it today.
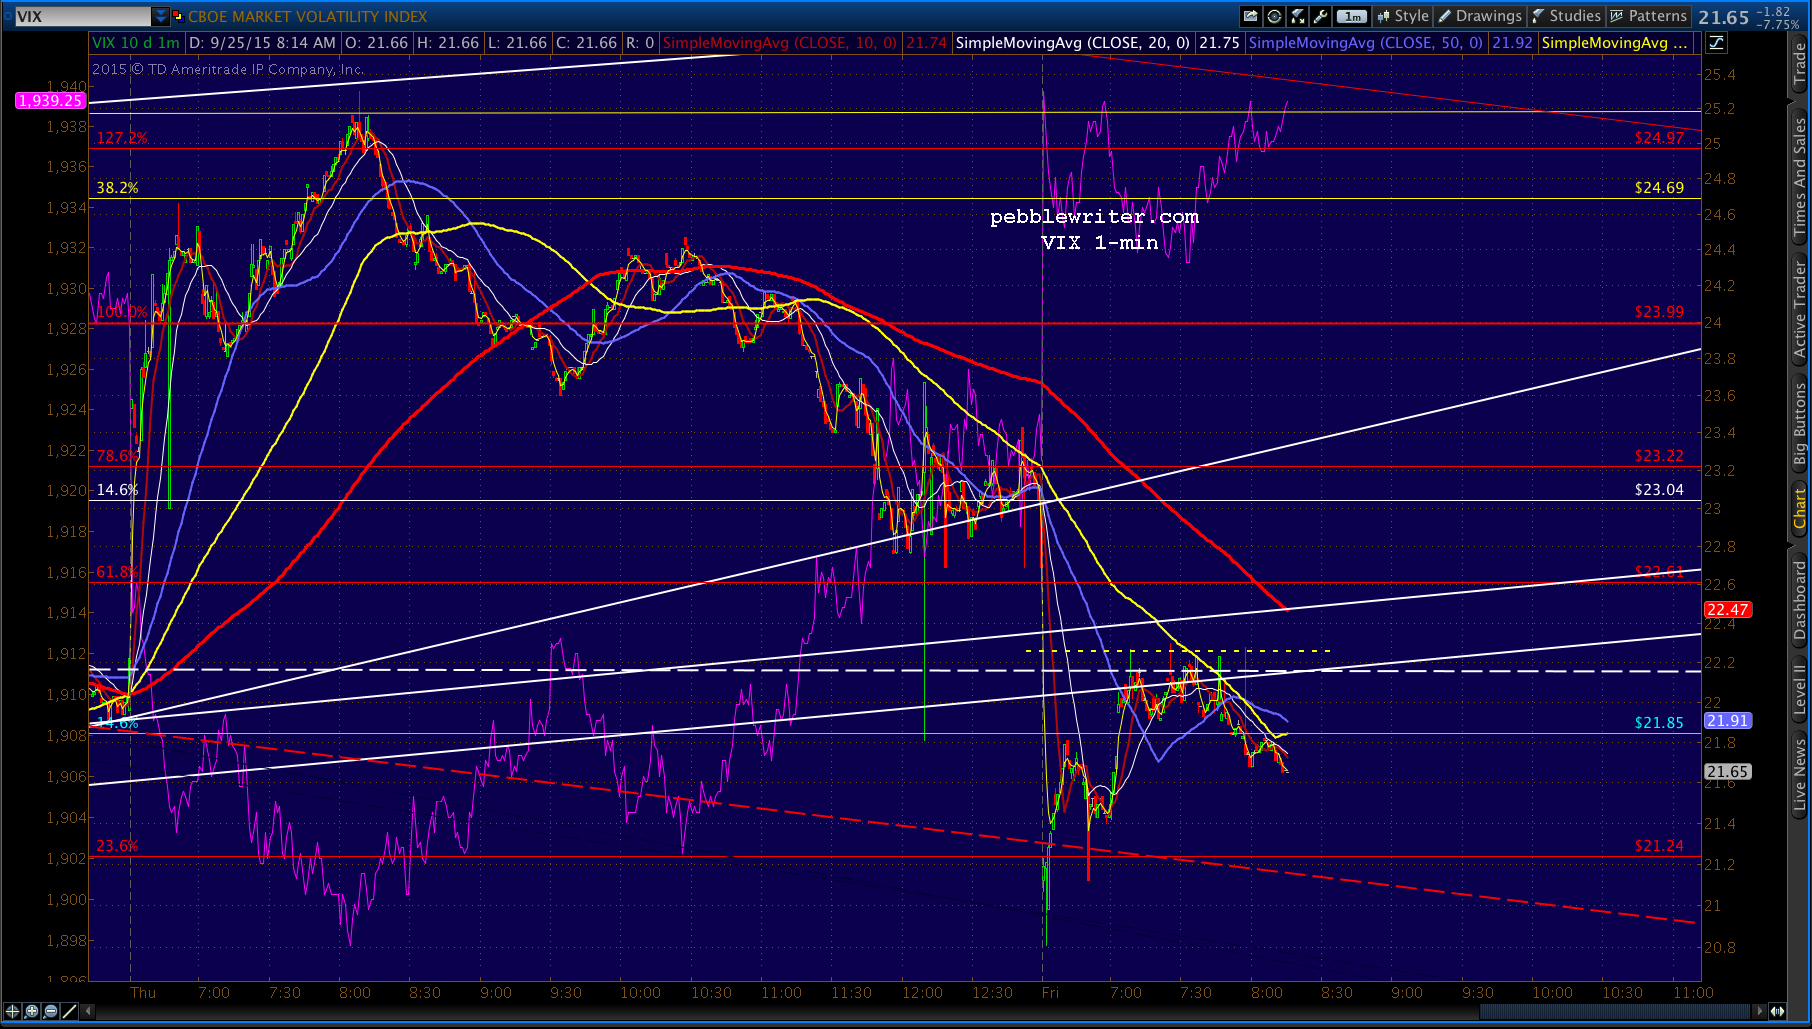 It’s not that I think the market doesn’t have downside potential. It does. But, clearly TPTB have decided it’s going to be propped up by hook or by crook at these levels — perhaps resulting in a big drop or a big ramp job over the weekend.
I don’t know which, so I’ll step aside for the moment. Again, one of those 2 things happens and I’d be happy to be short for the rest of they day. If you feel like playing along, set an alert for 120.87 on USDJPY and 22.28 on VIX.
UPDATE: 12:32 PM
 UPDATE: 12:42 PM
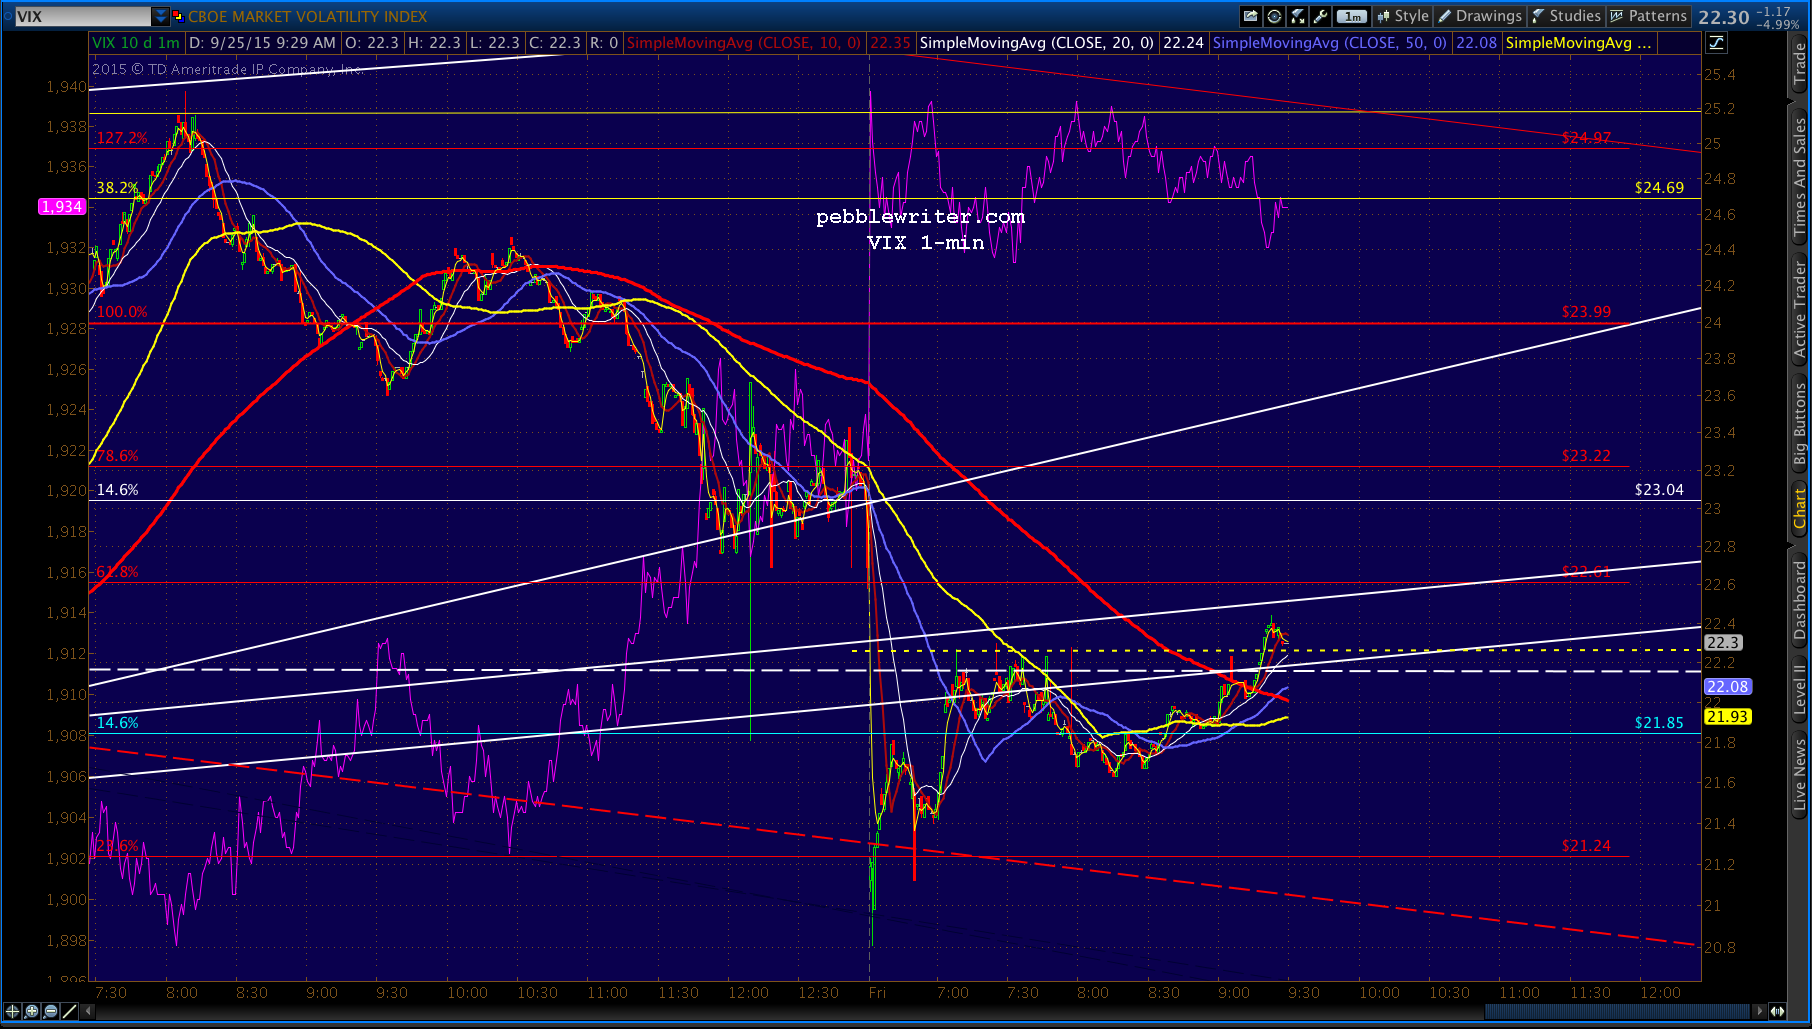
 Here’s the VIX chart. Note the white TL break a few minutes ago.
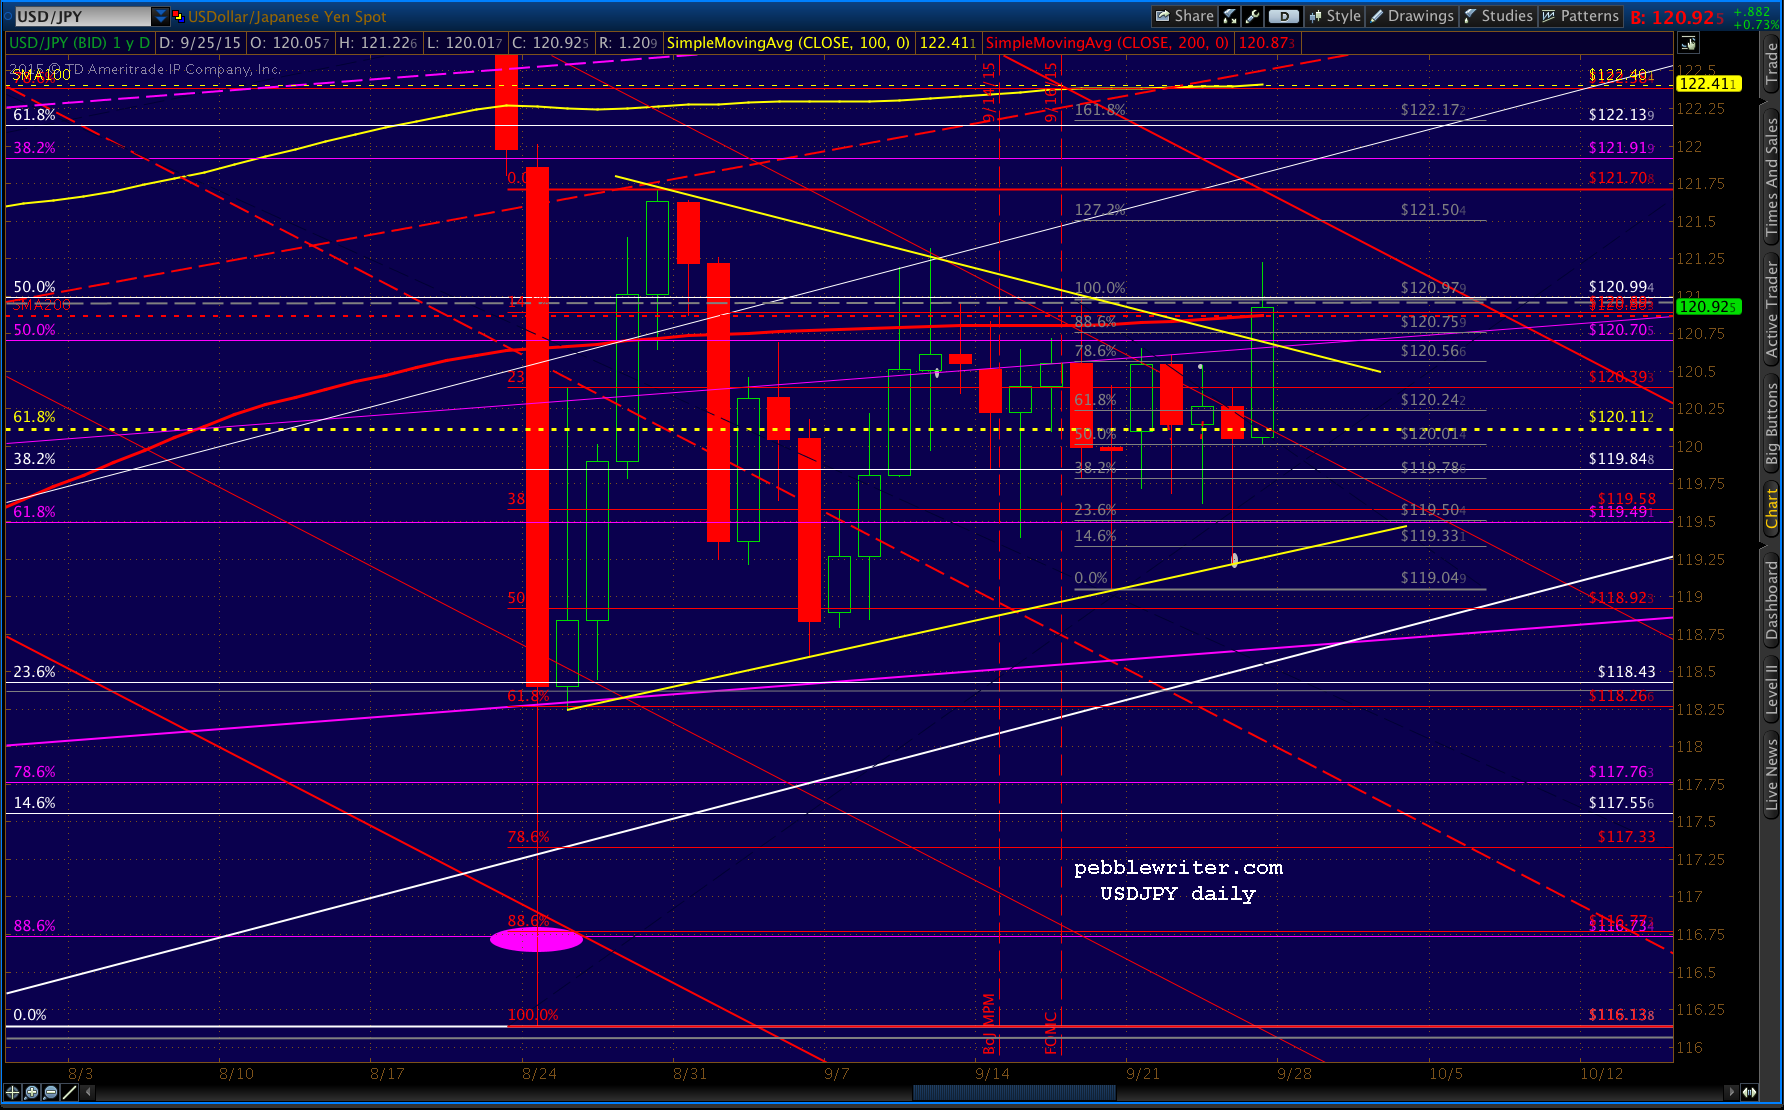
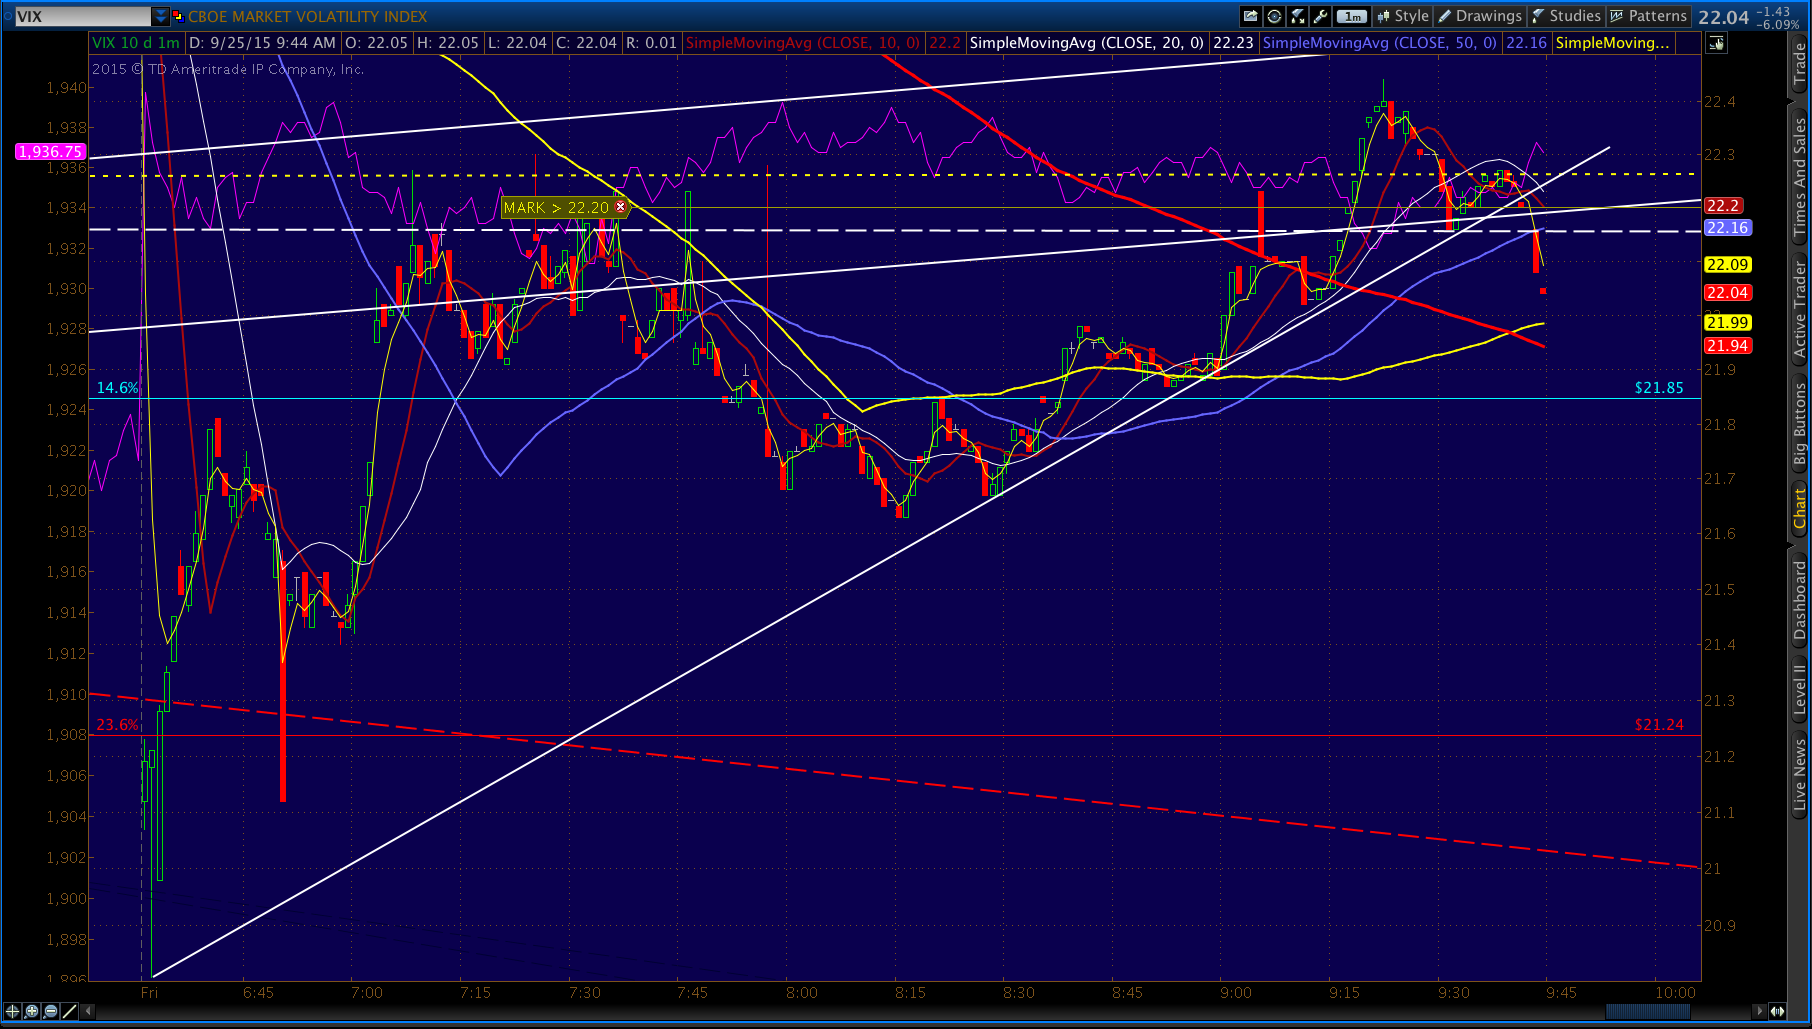 USDJPY just keeps going sideways, trying to convince everyone that the triangle breakout is for real. It’s now been a month since USDJPY first plunged back below 120.11. Since then, it has deviated only about 1.10 above and 1.50 below the Fib. It has crossed its SMA200 nine times — usually when SPX needs a push one way or the other.
We saw USDJPY get within 43 points of its 1.272 at 1823 one month ago today. Clearly, it wouldn’t take much of a plunge in USDJPY to accommodate another few points on the downside. The fact that it’s going sideways doesn’t mean it won’t happen, only that it’s not time just yet. 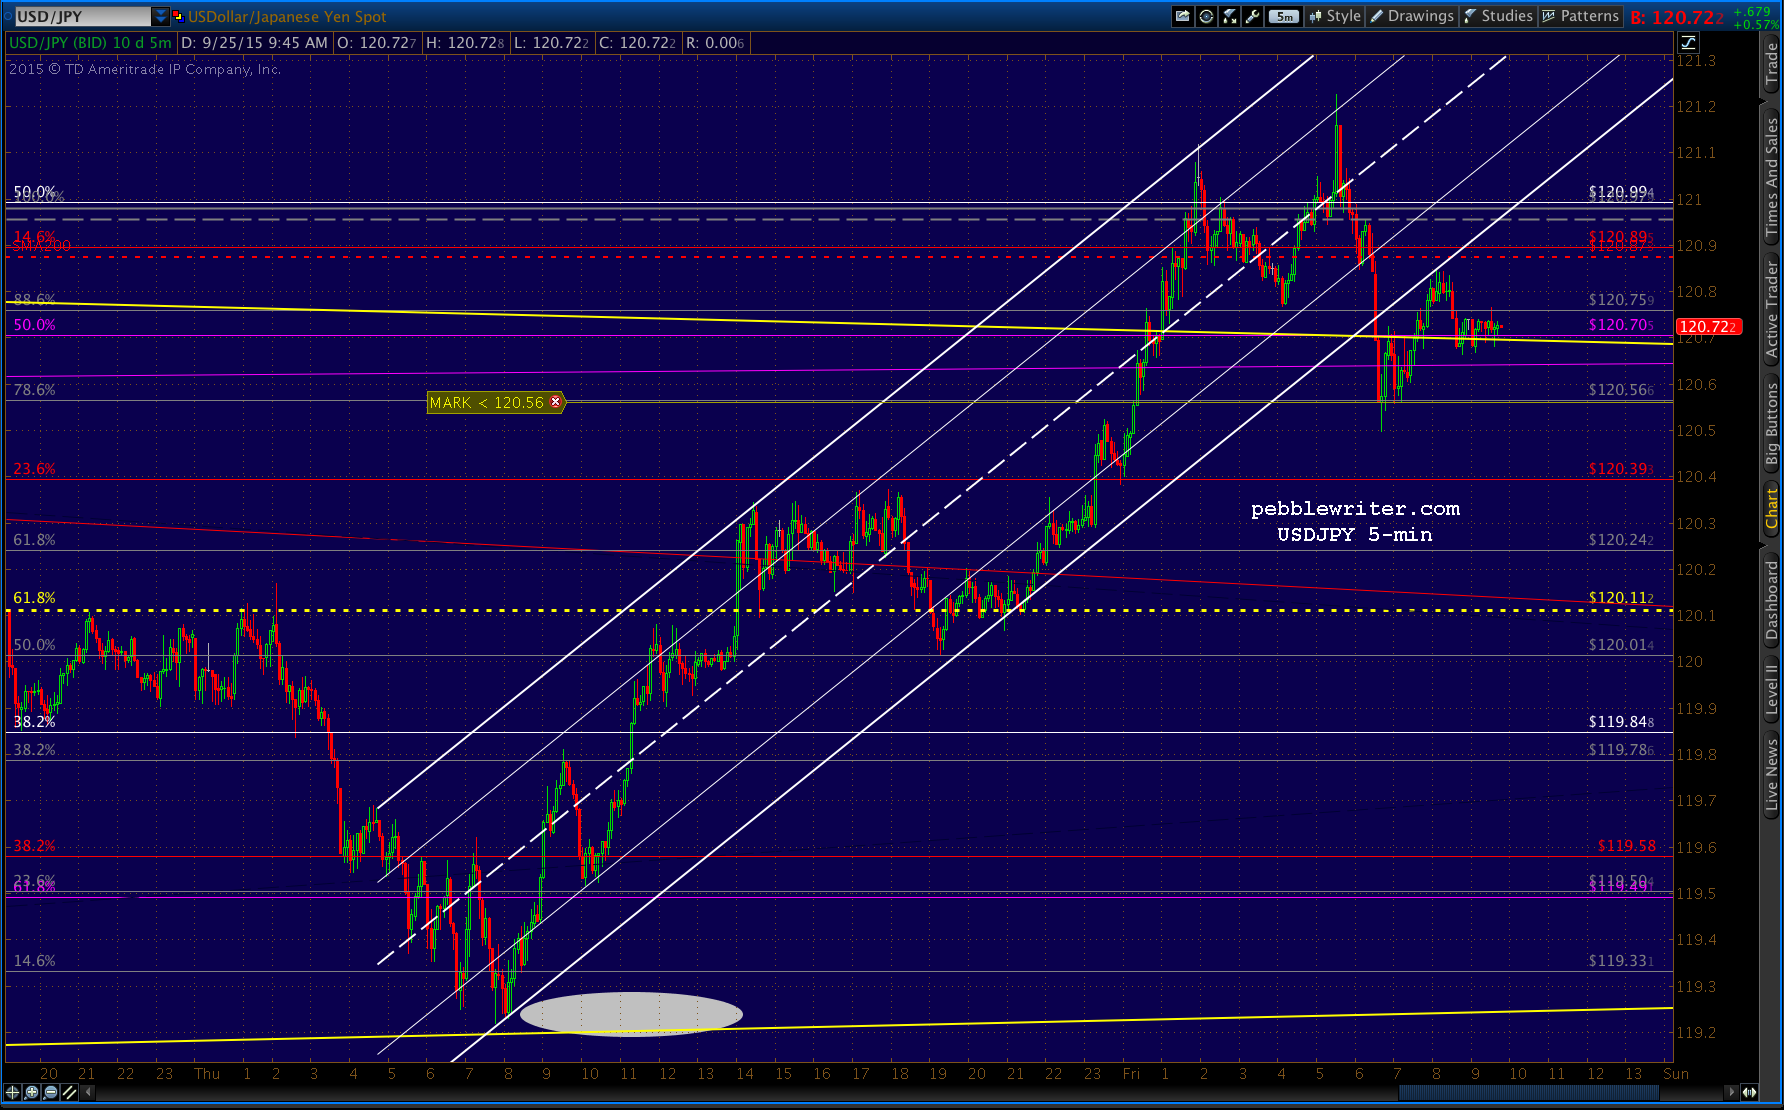
The closer we get to the end of the year, the more likely it is to postpone the eventual plunge. Bottom line, I’d be very cautious about shorting the pair. Every single dip since Aug 24 has been bought.UPDATE: 2:29 PM
 UPDATE: 3:11 PM
Obviously stopped out a while ago. I’m working on another analog that might be helpful over the next few weeks, so am not watching the short-term moves very closely. I’ll have it posted shortly.
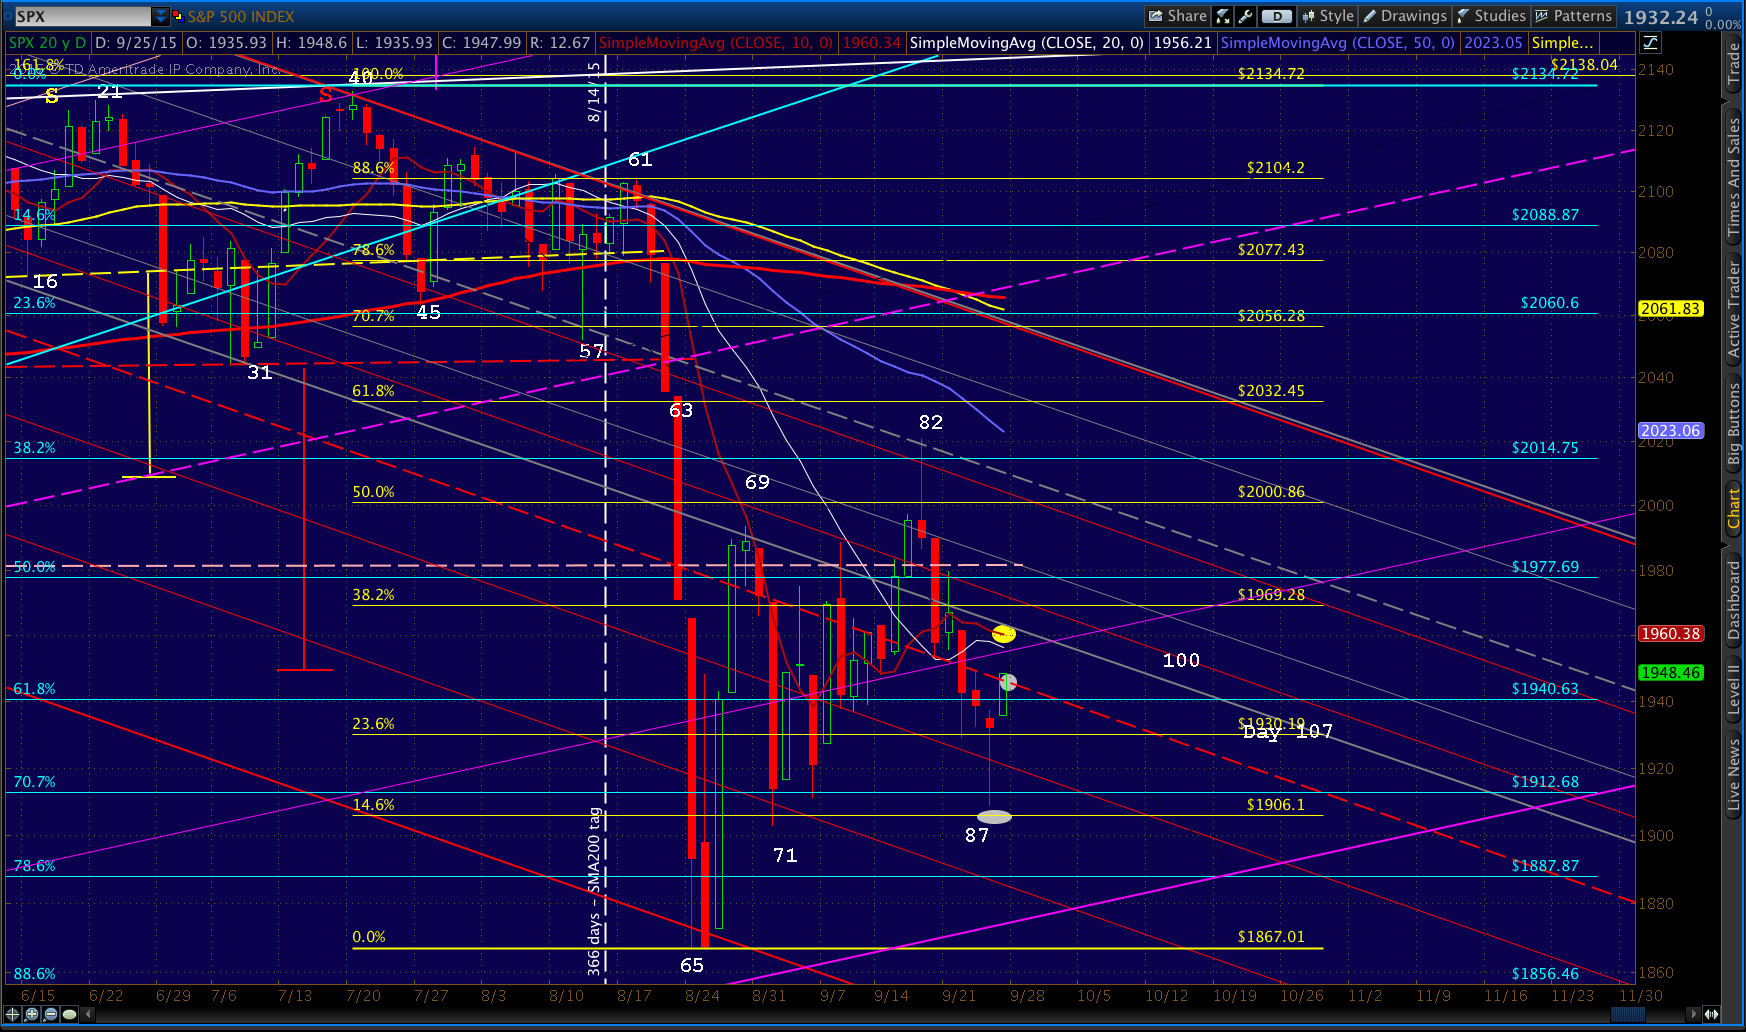
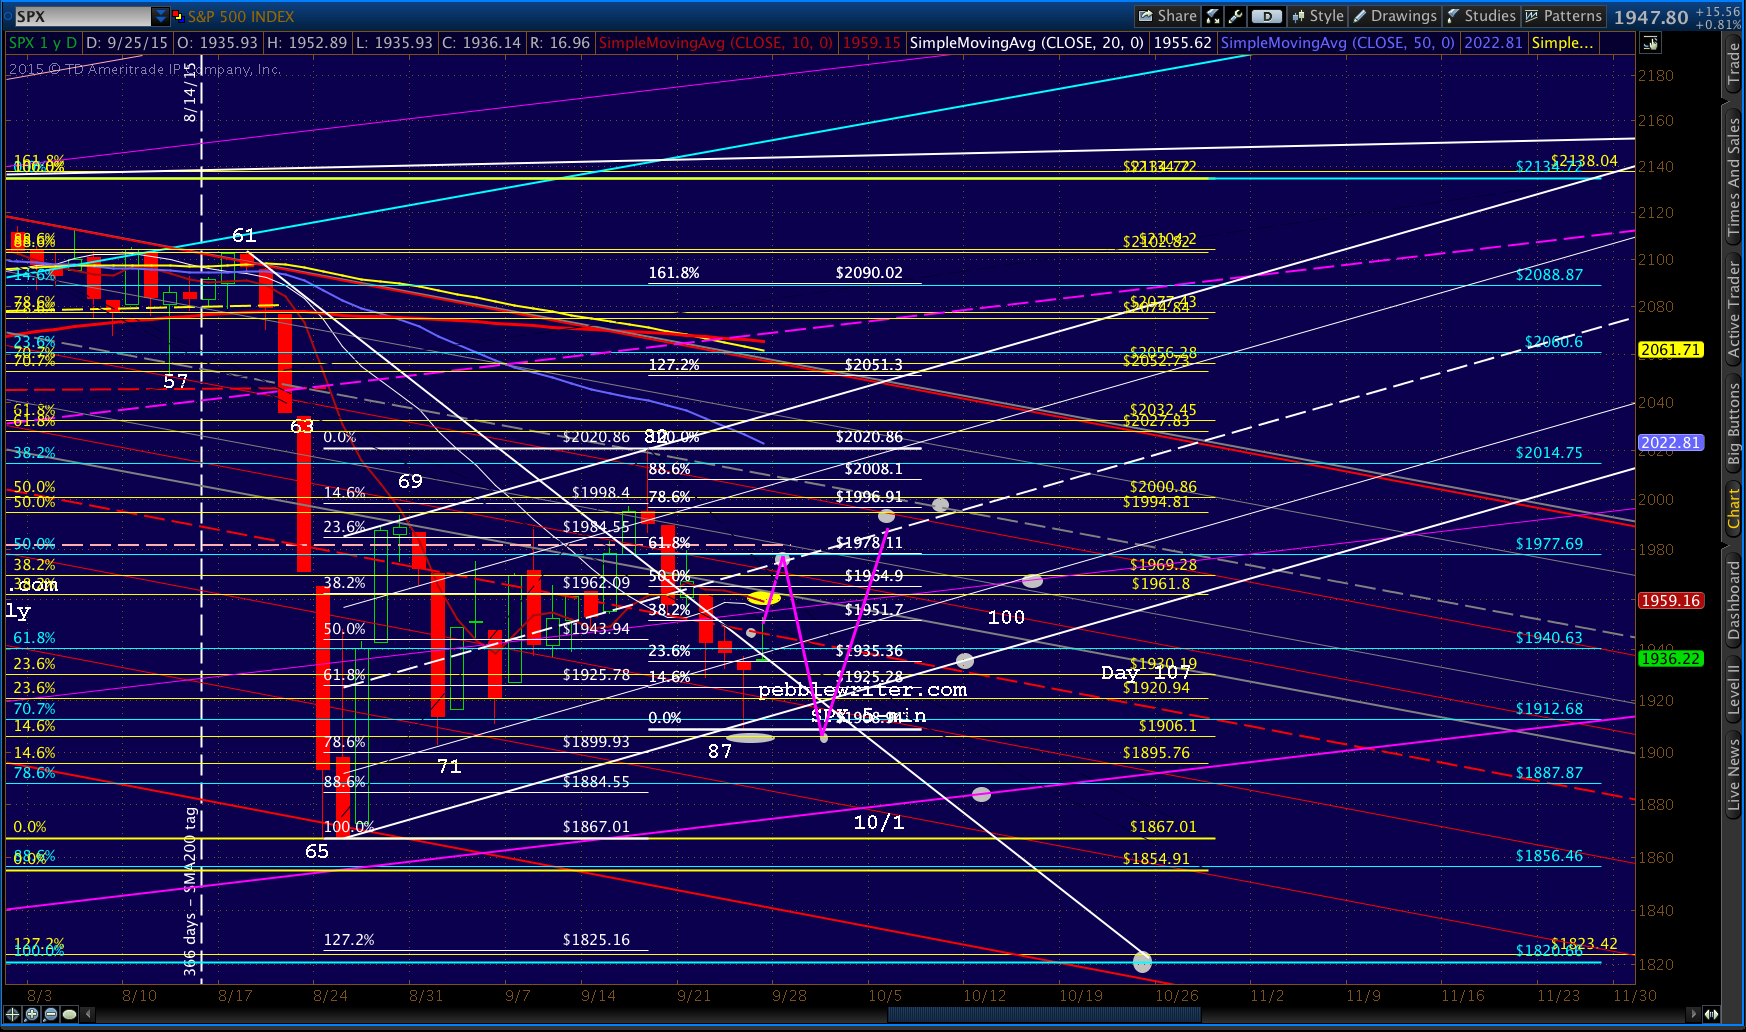
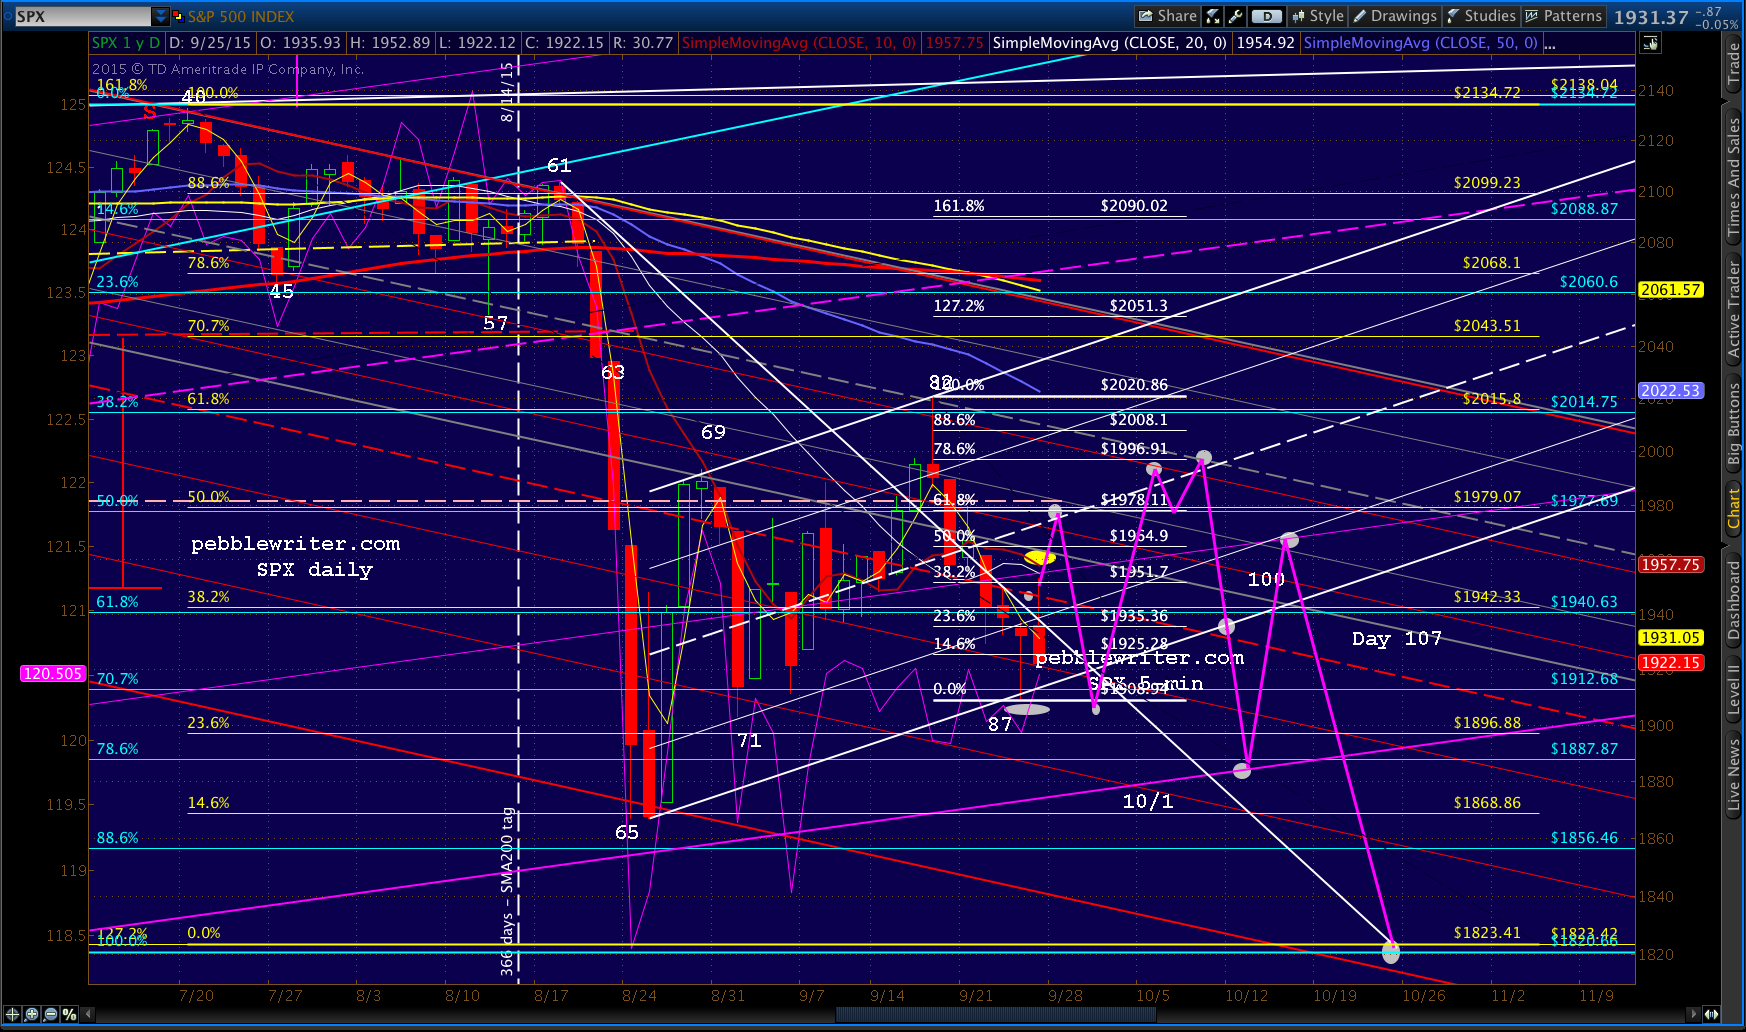 Here’s a cleaner look at it. You can ignore the numbers. They’re just to help me keep track of things. I have it ending in late October, knowing that the BoJ is prone to announcing QQE on Oct 31 (2011 and 2014.) We’ll see what happens over the next week or so.
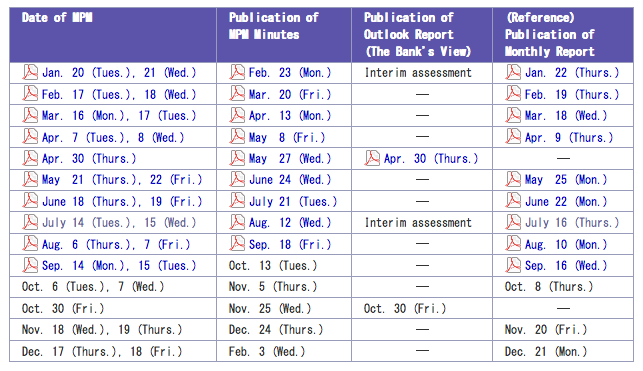
Note that there are at least two potential H&S Patterns we should be watching. The inverted yellow completes at 1954ish and points to 1997. The traditional red one points to 1796 — a little lower than our forecast.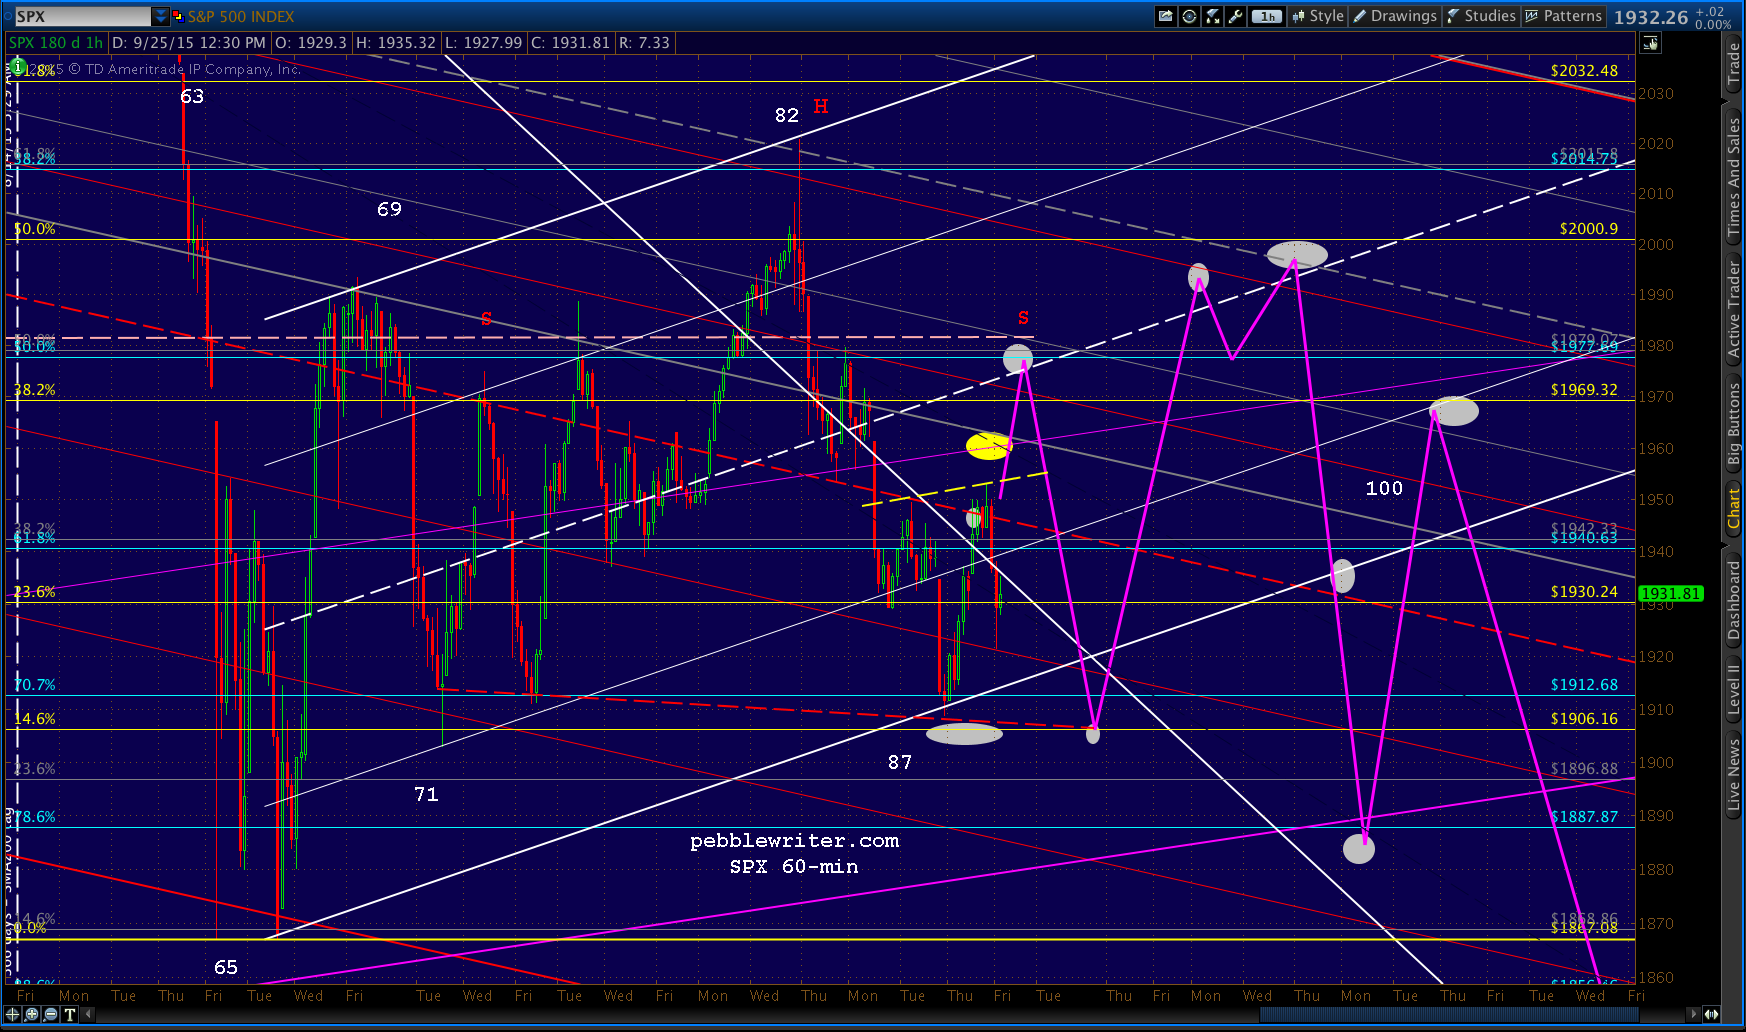 Also, note that the BoJ’s monetary strategy meeting schedule offers two opportunities in October for the BoJ to announce a QQE expansion: Oct 6 and Oct 30. Obviously, if it happen on Oct 6, this forecast would make no sense at all.