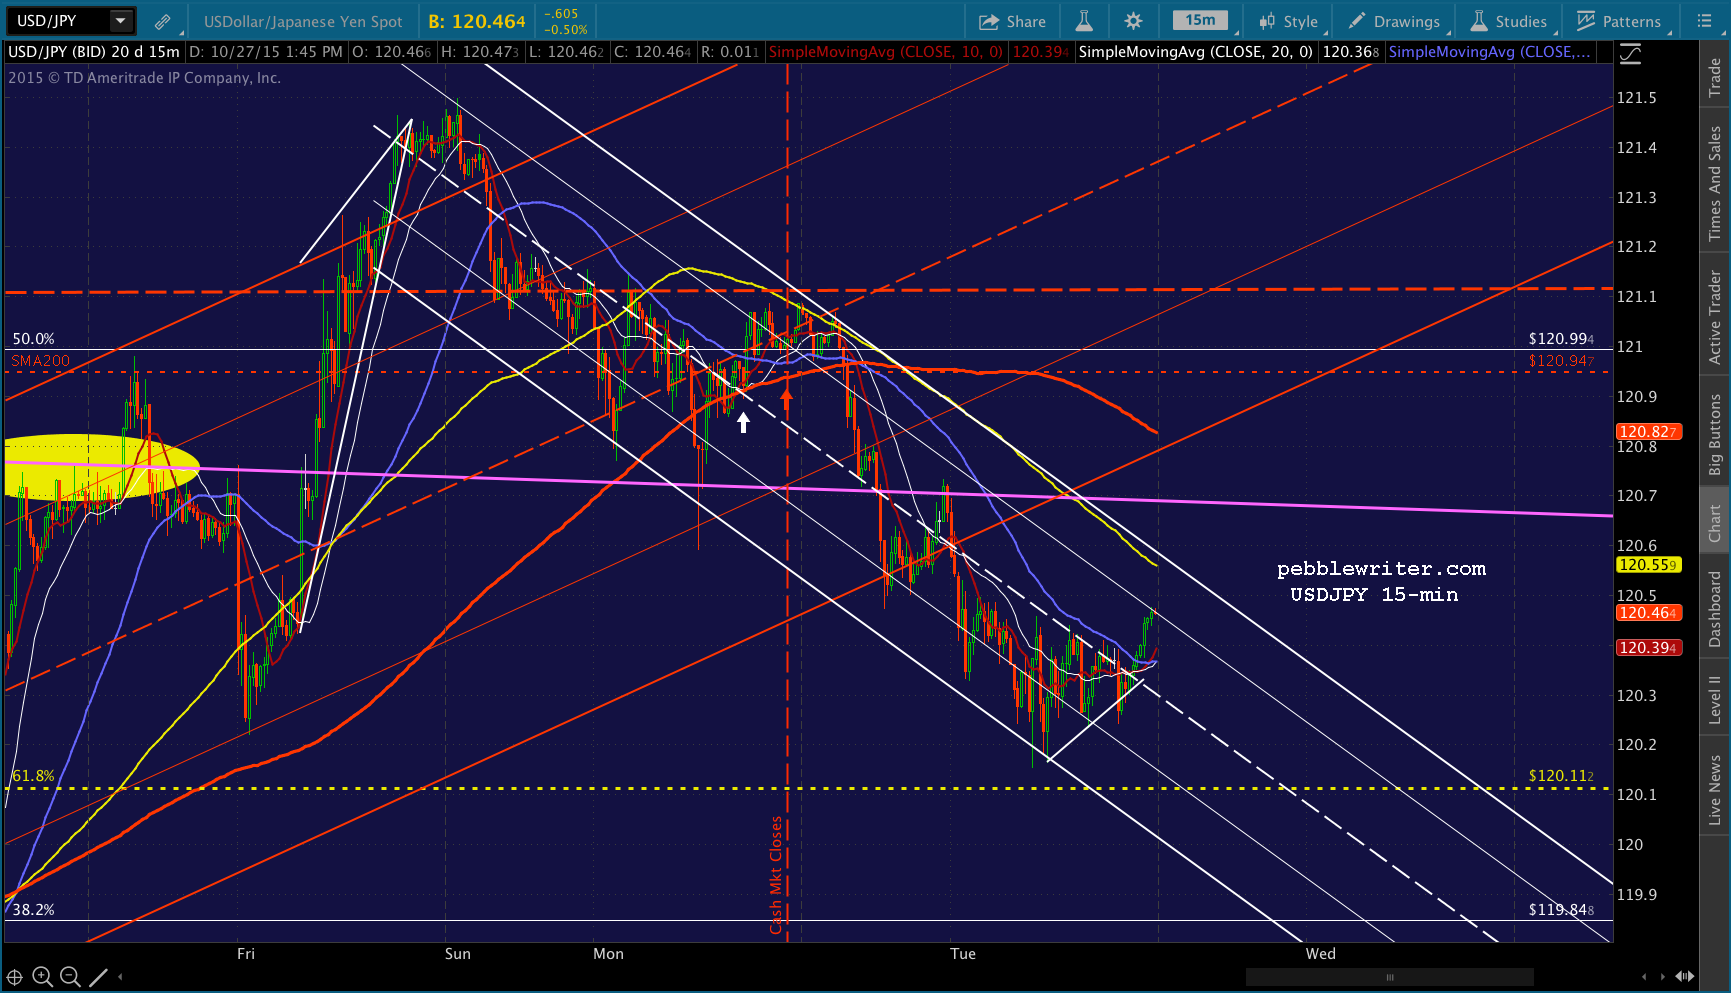
Our initial downside target yesterday was the SMA200. It looked to be in the bag, as the white channel line intersected the daily SMA200 at exactly the same time as would the 5-min SMA200 (another common intraday target.)
And, since SPX had fallen below the purple channel .786 line, a drop to the midline was potentially in the cards as a secondary target.
 USDJPY was cooperating, having reversed below the SMA200. It was even tracing out a nifty little falling channel.
  But, as we noted earlier in the session [see: Central Banks Can Relax]:
[USDJPY] is the key chart to watch, as TPTB will want to keep it within striking distance of its SMA200 in case stocks start looking too wonky. A quick ramp back to the SMA200 should fix things in a hurry.
Apparently a 9-pt dip in SPX was much too wonky for The Powers That Be. The perfectly good falling white channel in USDJPY was interrupted (the white arrow, a very unnatural spot) so that USDJPY could head back to the SMA200.  The impact on SPX was almost immediate. It popped through its clearly defined channel and spent the rest of the day oscillating higher — never once dipping below the green, dashed TL in the chart below.
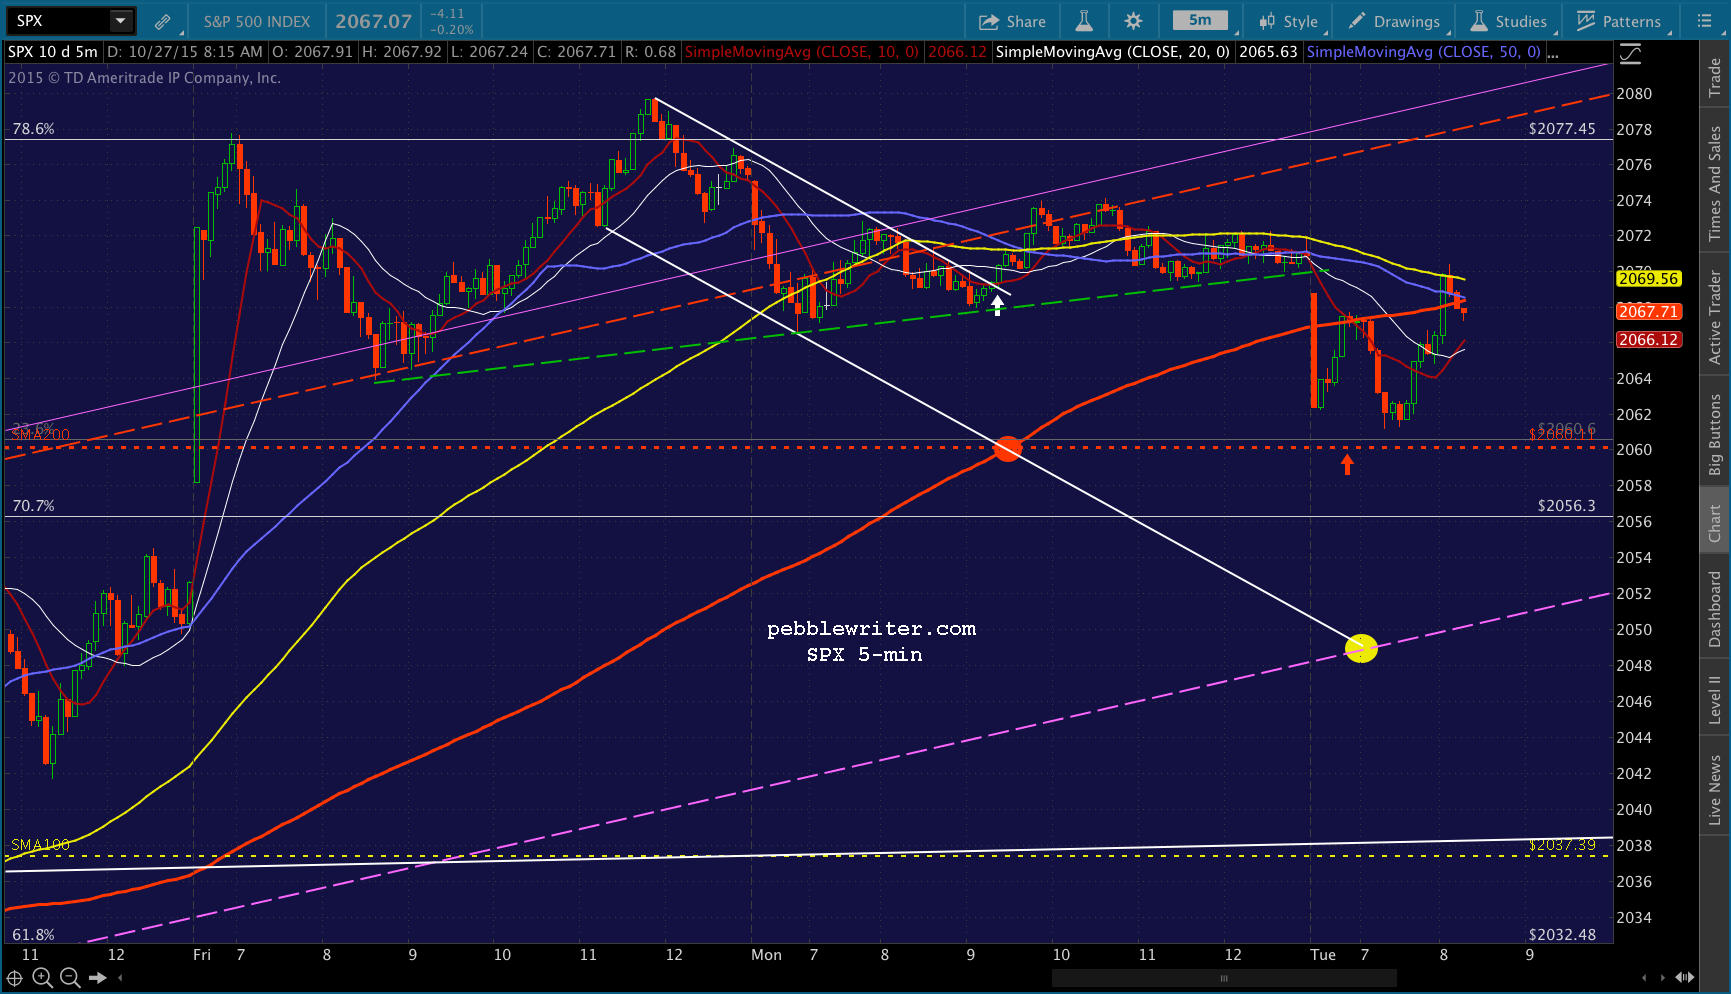
There would be no SMA200 tag during the cash session. The only way US traders could play the backtest would be to:
(1) stay short overnight, and run the risk of waking up to a big loss
(2) stay up all night and watch it like a hawk
(3) stay short, but hedge your position (or use stops, if playing futures)
I’ve tried all three approaches many times. And, trust me, none of them are particularly effective or enjoyable.
I’ve been hit with many 3AM ramp jobs that nullified good patterns and left me with a loss. I’ve pulled all-nighters, only to see the eminis easily propped up in the low-volume environment. And, I’ve seen way too many stop-running exercises that prey on cautious investors.
The “market” has always been manipulated. But, in the old days, it was just as likely to result in a dip as it was a spike higher. Not any more. These days, the regulators are quick to prosecute HFT’s and algos that results in market corrections. But, if you manipulate it higher, you have nothing to fear.
After all, the biggest manipulators of all are the central banks themselves, with both direct and indirect intervention whenever things are getting out of control — or, they simply want to push indices past overhead resistance.
That’s what last week was all about: SPX topping its SMA100 and SMA200. It was driven entirely by USDJPY’s manipulation higher. If this comes as news to you, please take 10 minutes to read the recent post:
What Really Drives Stock Prices?
Whatever pattern seems to be unfolding, whatever target appears obvious, they’re easily avoidable by the simplest of means: pushing the easily-manipulated USDJPY a little higher.
We don’t have to look far for more proof. As soon as cash markets closed yesterday (the red arrow) USDJPY continued to our downside targets: the bottom of the red channel, and on down to the .618 Fib at 120.11.  The goal was for SPX to tag its SMA200 at the open — when cash traders would be unable to participate. And, it almost worked out that way.
 Traders saw USDJPY bouncing before it even reached 120.11 and were quick to flip back to long positions. It’s only now, almost 3 hours later, that SPX appears ready to finally reach 2060.
After all this drama and subterfuge, will SPX get a big bounce there? It’s not as clear cut as one might think.
continued for members…
As we discussed yesterday, there’s a distinct possibility that the Fed will use the ample push of the last two weeks as a cushion against the fall they anticipate from a rate rise. They obviously have little credibility left (none with those “in the know.”)
With the BoJ MPM coming up Friday, and the USDJPY above the critical 120.11 and trending higher, they have a built-in backstop in case things get really out of hand.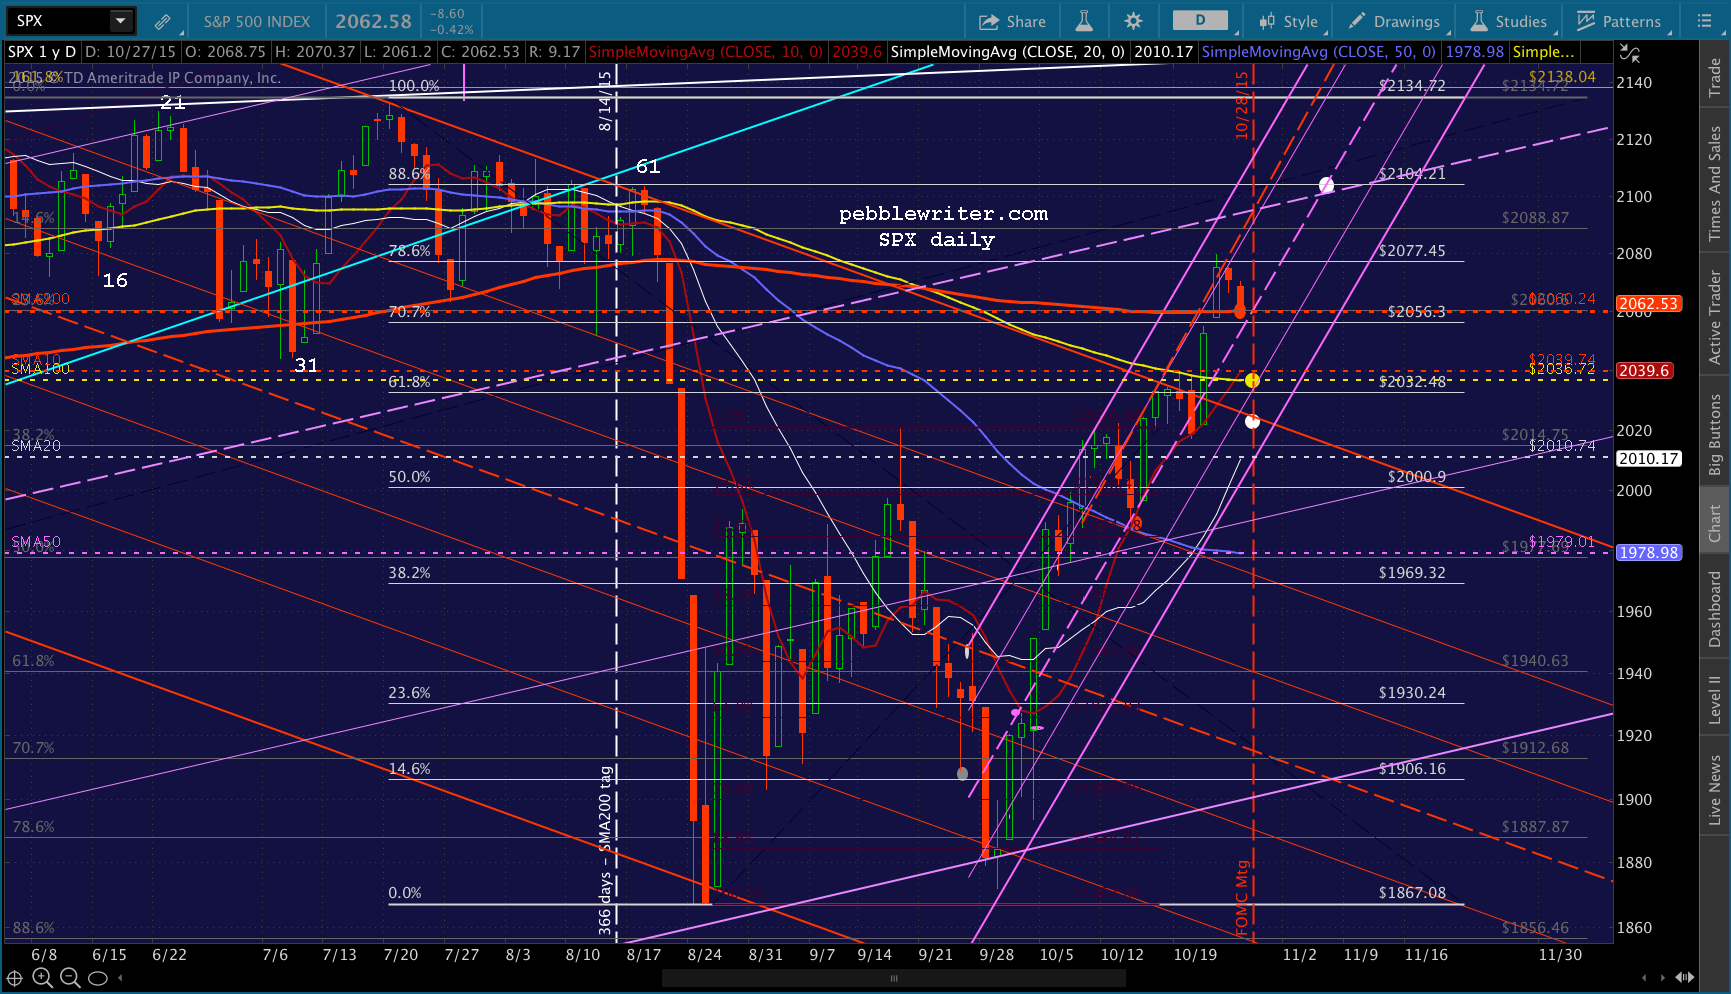 It’s not hard to imagine SPX bumping along the SMA200 for the next 24 hours, only to plunge to the SMA100 or bottom of the purple channel on news of a 1/4% increase. Now that the majority expect no rate hike until 2016, it would be a deft move.
It would give the Fed a tiny amount of wiggle room the next time investors awake from the QE fog they’ve been in for years. And, by propping up the “market” at, say 2036 or 2024, they could “prove” to investors that they have nothing to fear from the Fed.
It’s only a theory right now. But, if SPX does start to sell off, it’s good to have a couple of reasonable targets in mind.
UPDATE: 1:05 PM
SPX finally reached its SMA200 a few minutes ago. I’d switch to long here, but with the understanding that we could see a further drop to the purple channel midline (small yellow dot currently at about 2052.) 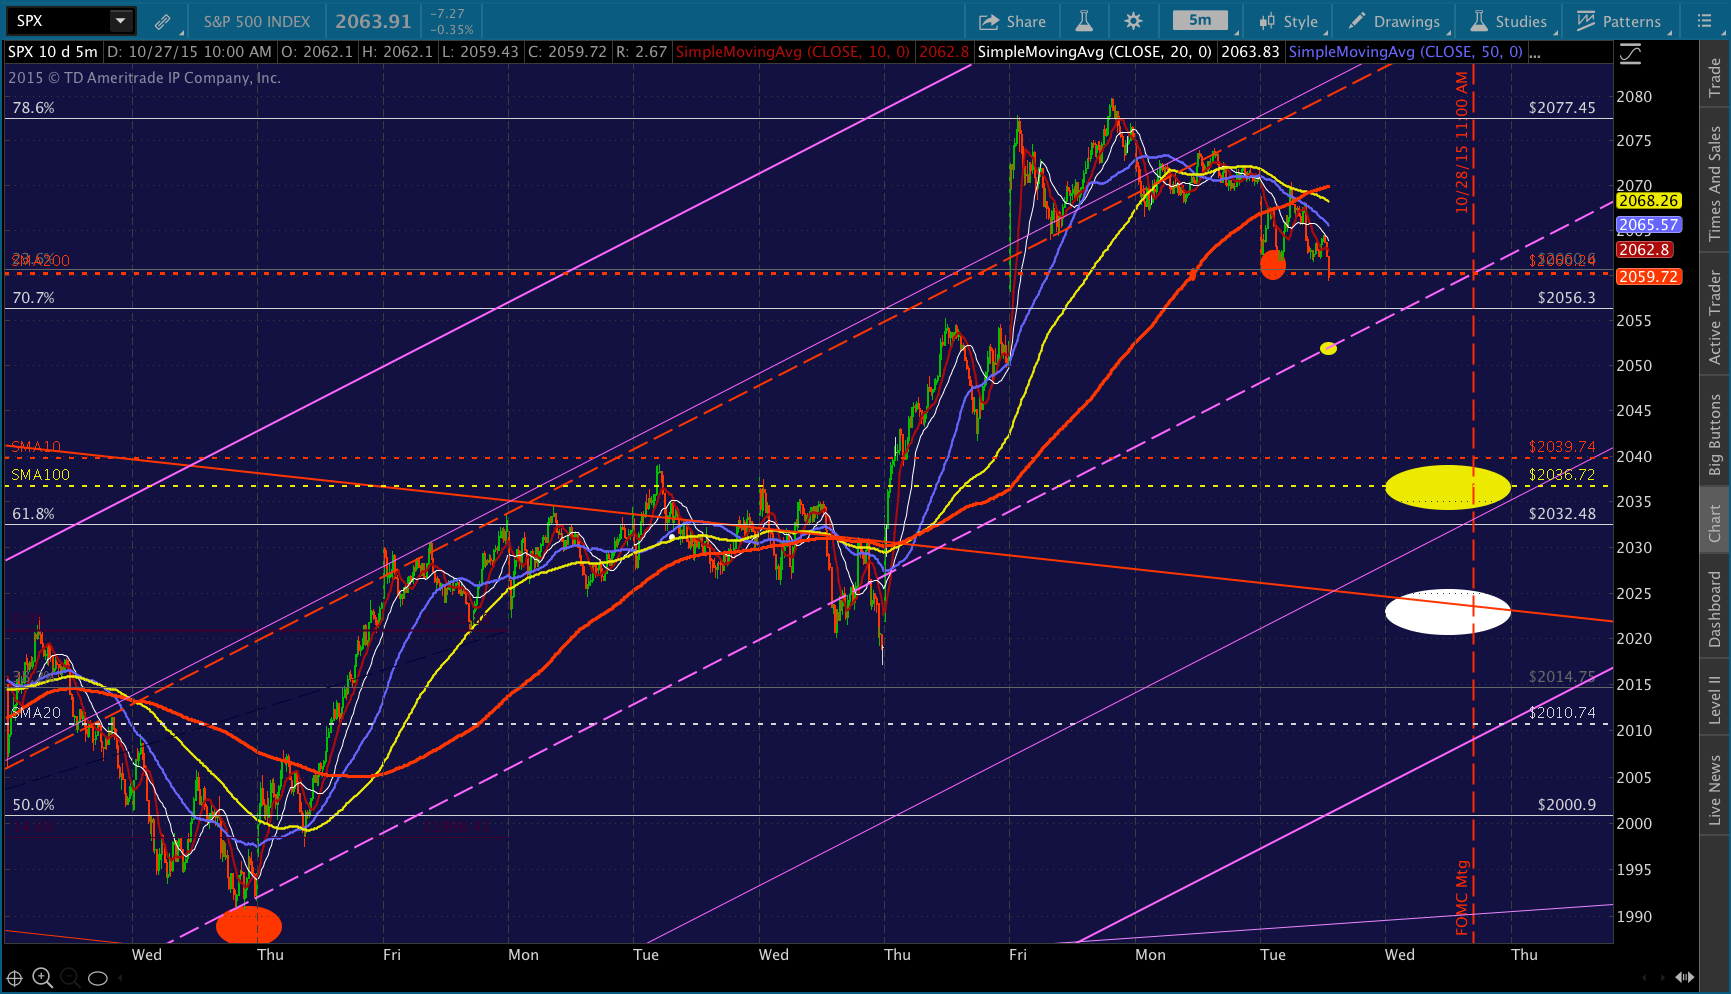 Note that ES — currently, below its SMA200 — has now fully backtested the broken falling white channel from last May.
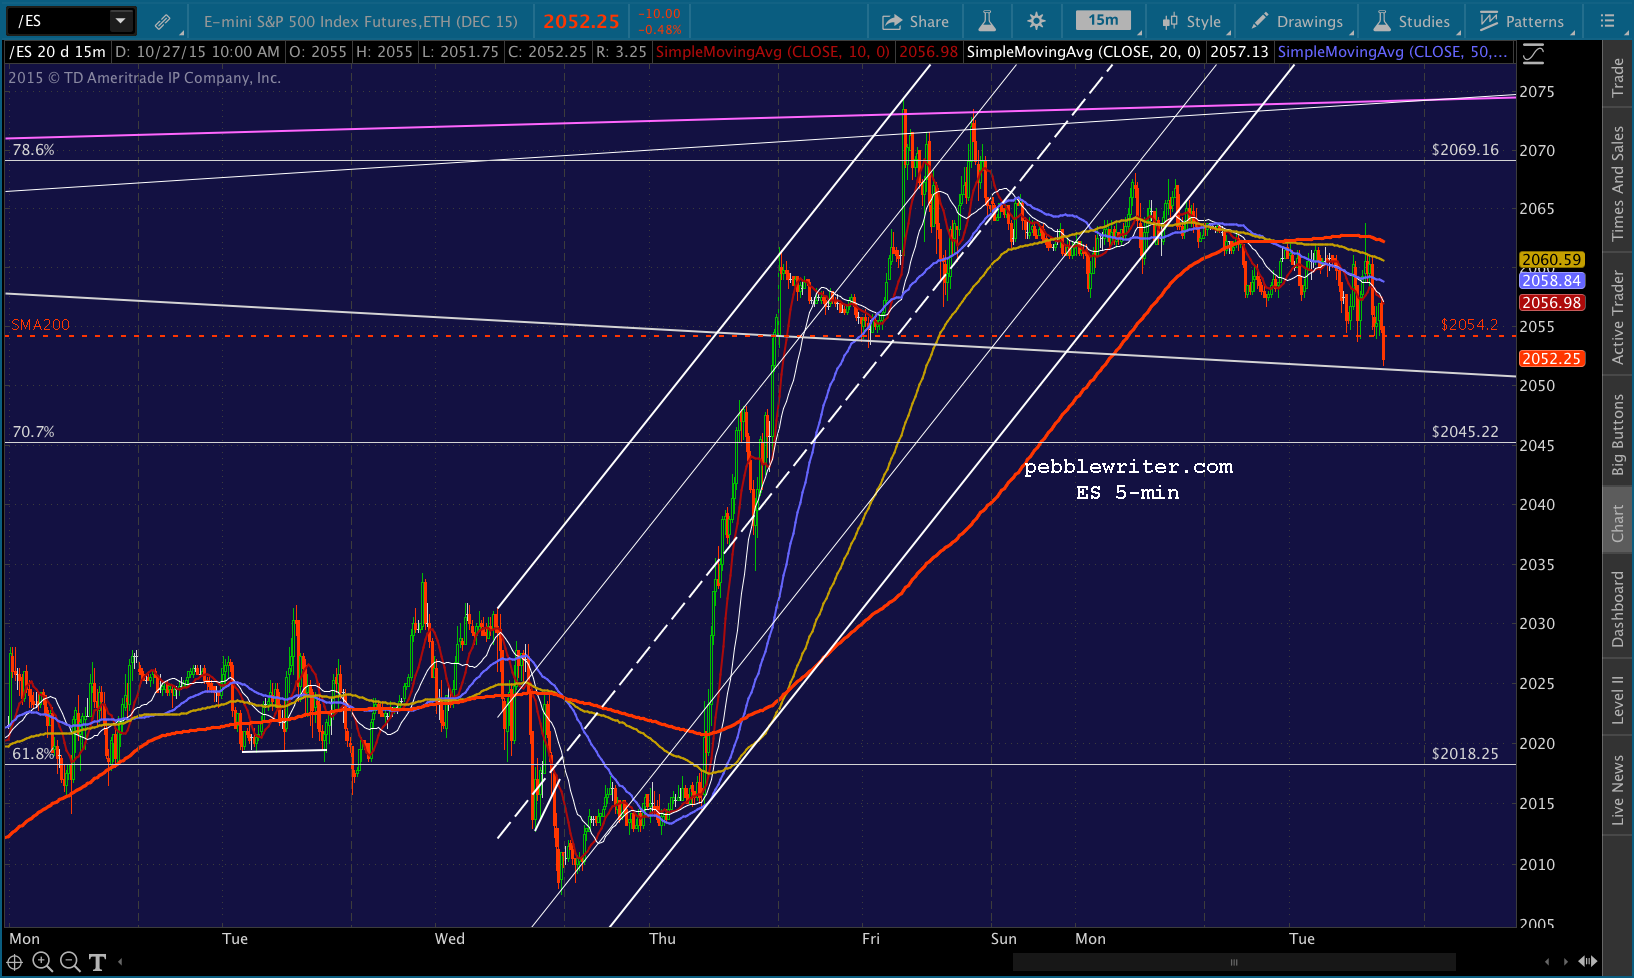 Here’s a better look.
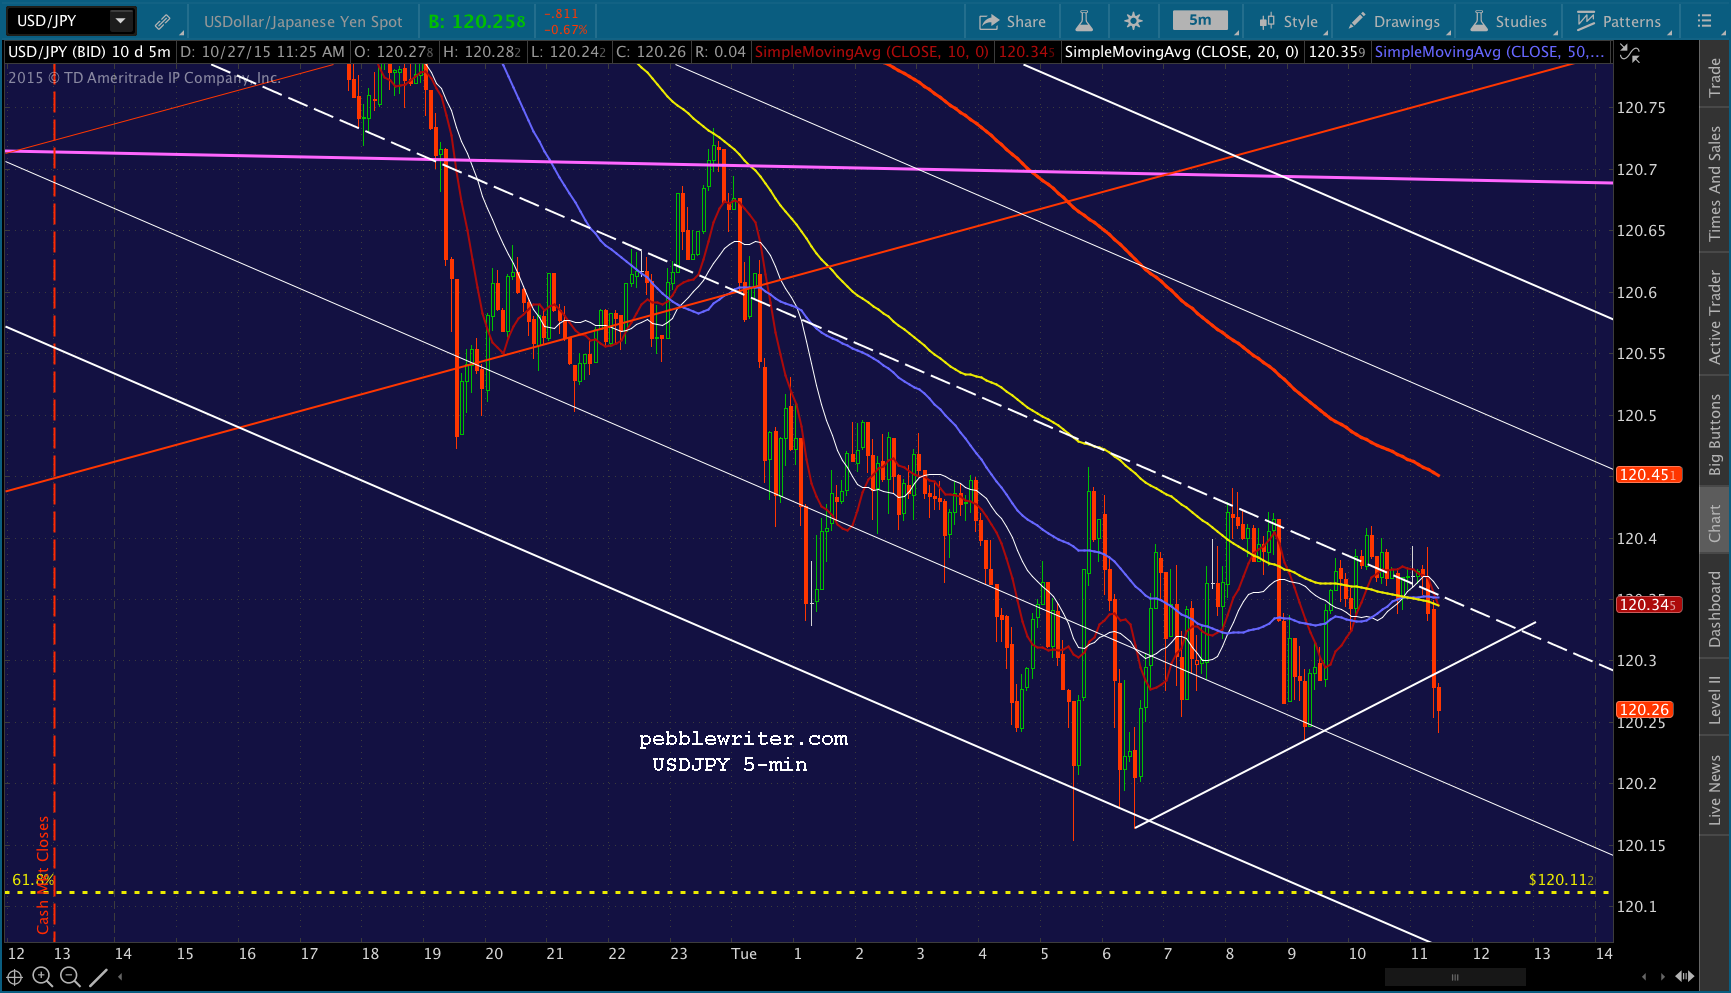
 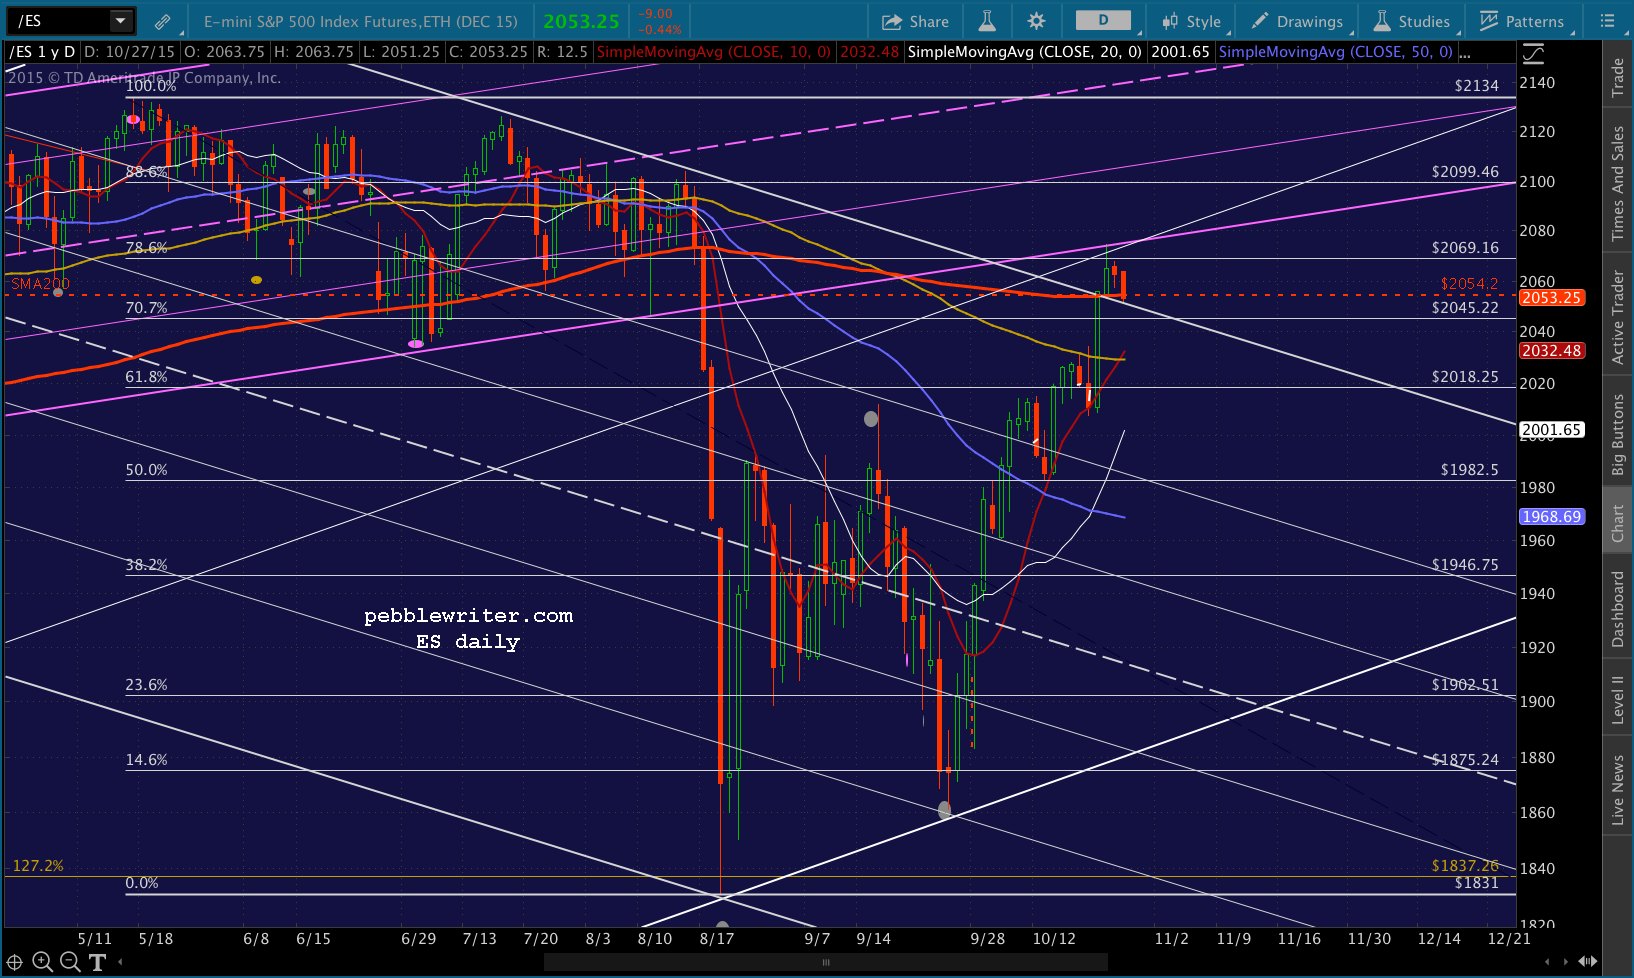 On the other hand, note that USDJPY has still not tagged 120.11. So, there could well be another leg down. Keep you stops close on this one, especially if USDJPY doesn’t bounce up through the white midline.
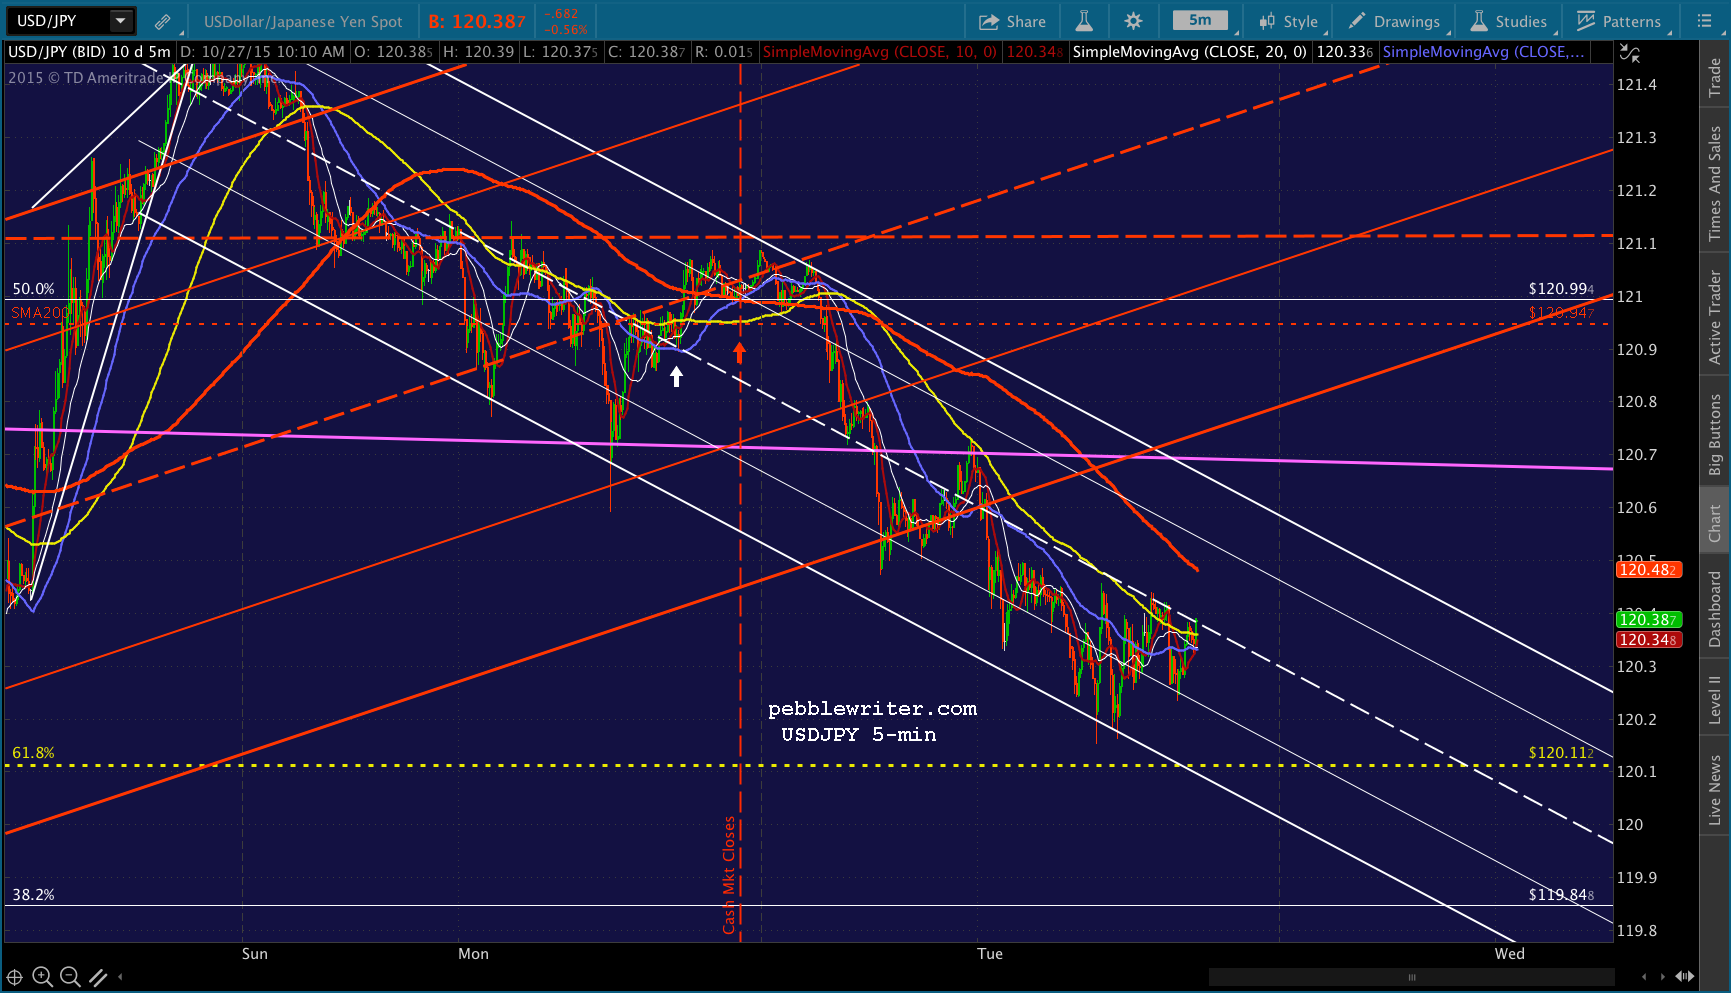 UPDATE: 1:43 PM
A rather lackluster response so far has me ever more concerned about this bounce. There are probably a boat load of stops at 2060, just waiting for the HFT’s to pounce on. Keep a very close eye on those 5-min moving averages.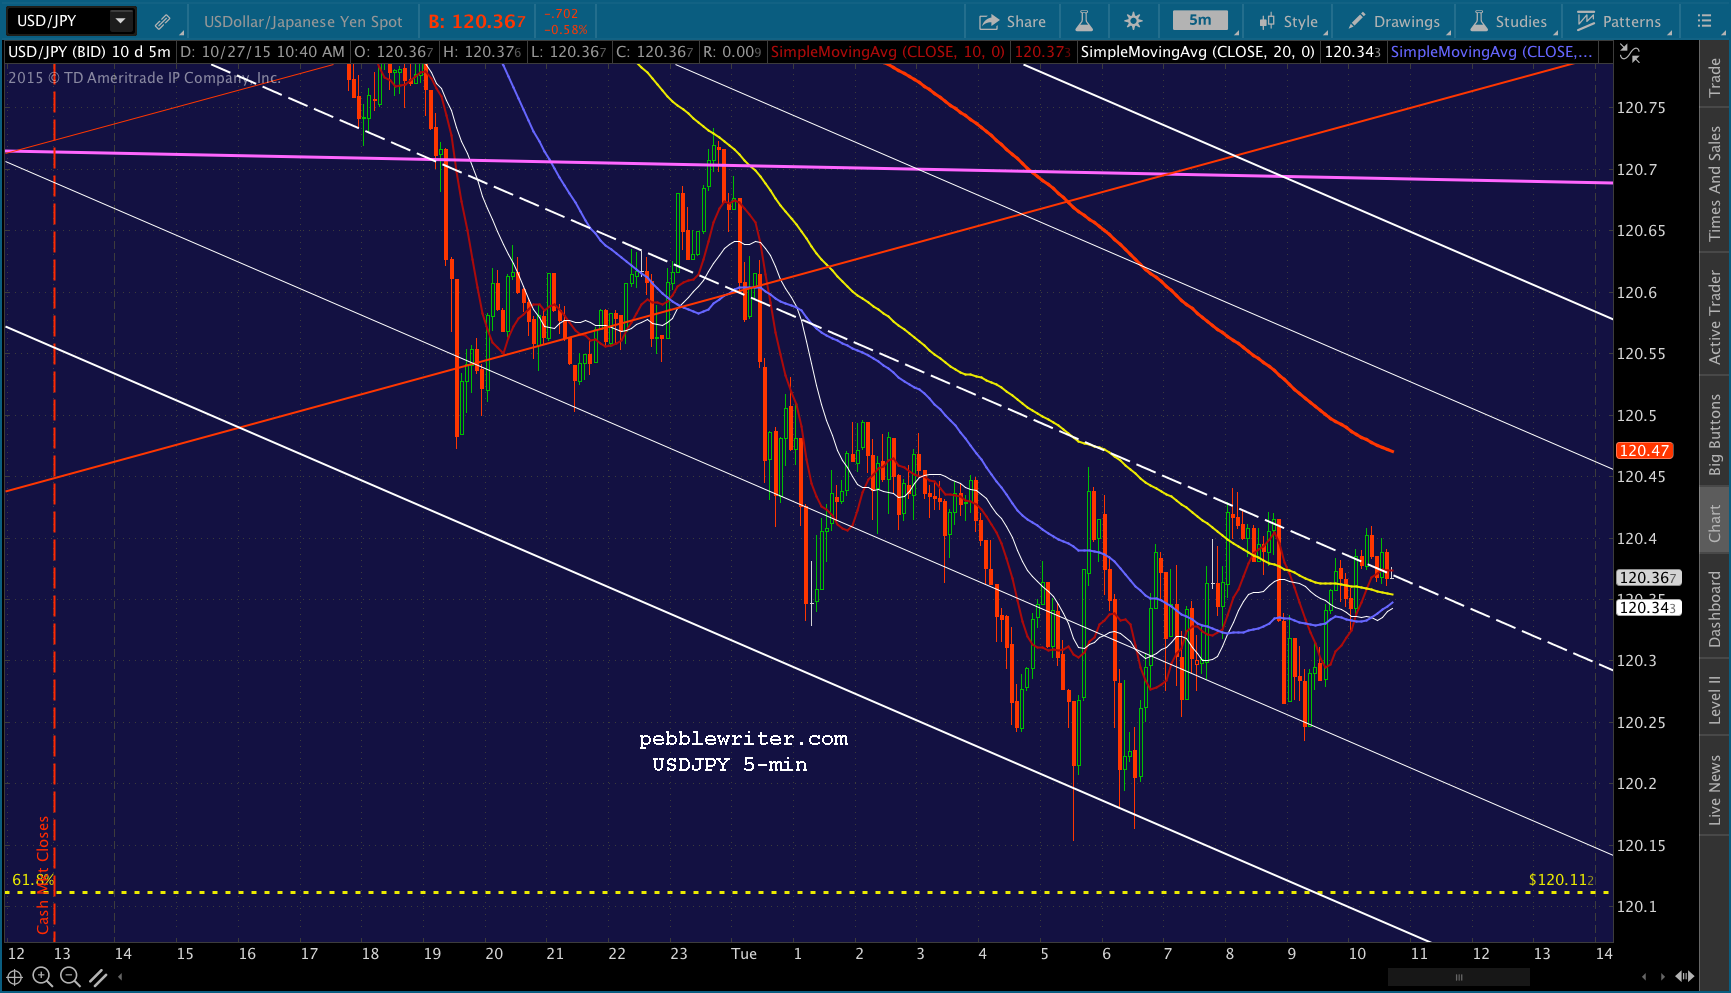
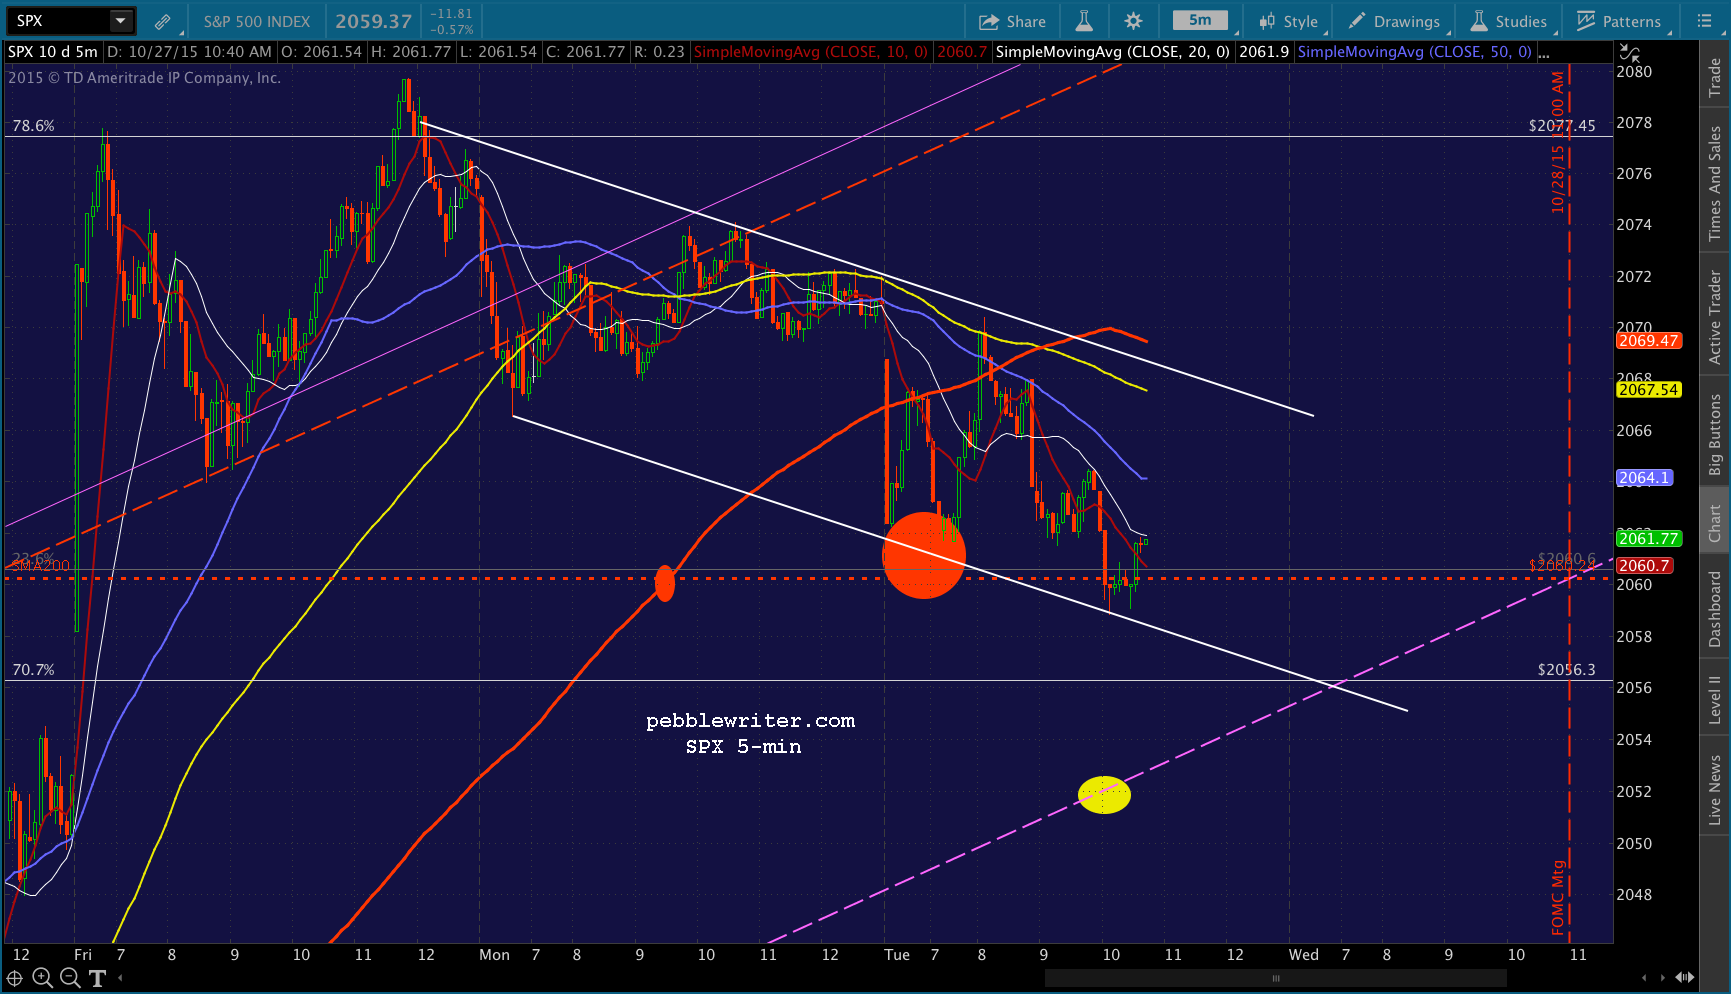 And, keep an eye on VIX. It clearly suggests more downside — support for that earlier argument that another decline is in store.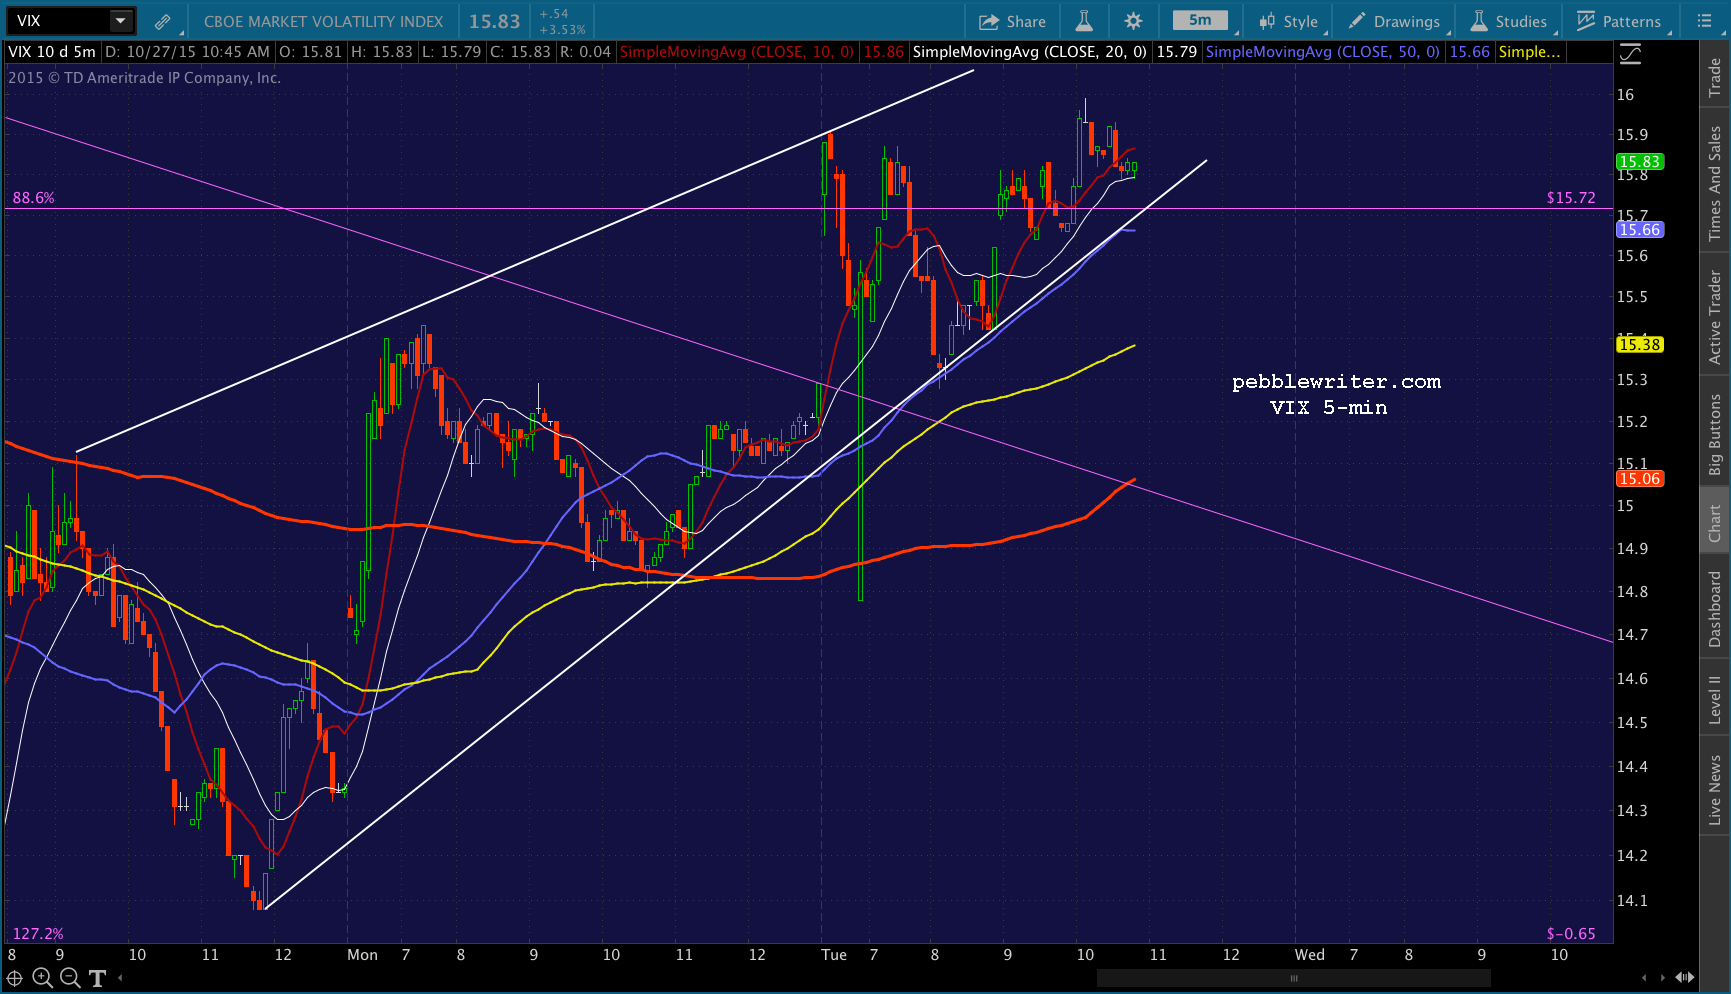
 UPDATE: 1:48 PM
Not a bullish sign from USDJPY. 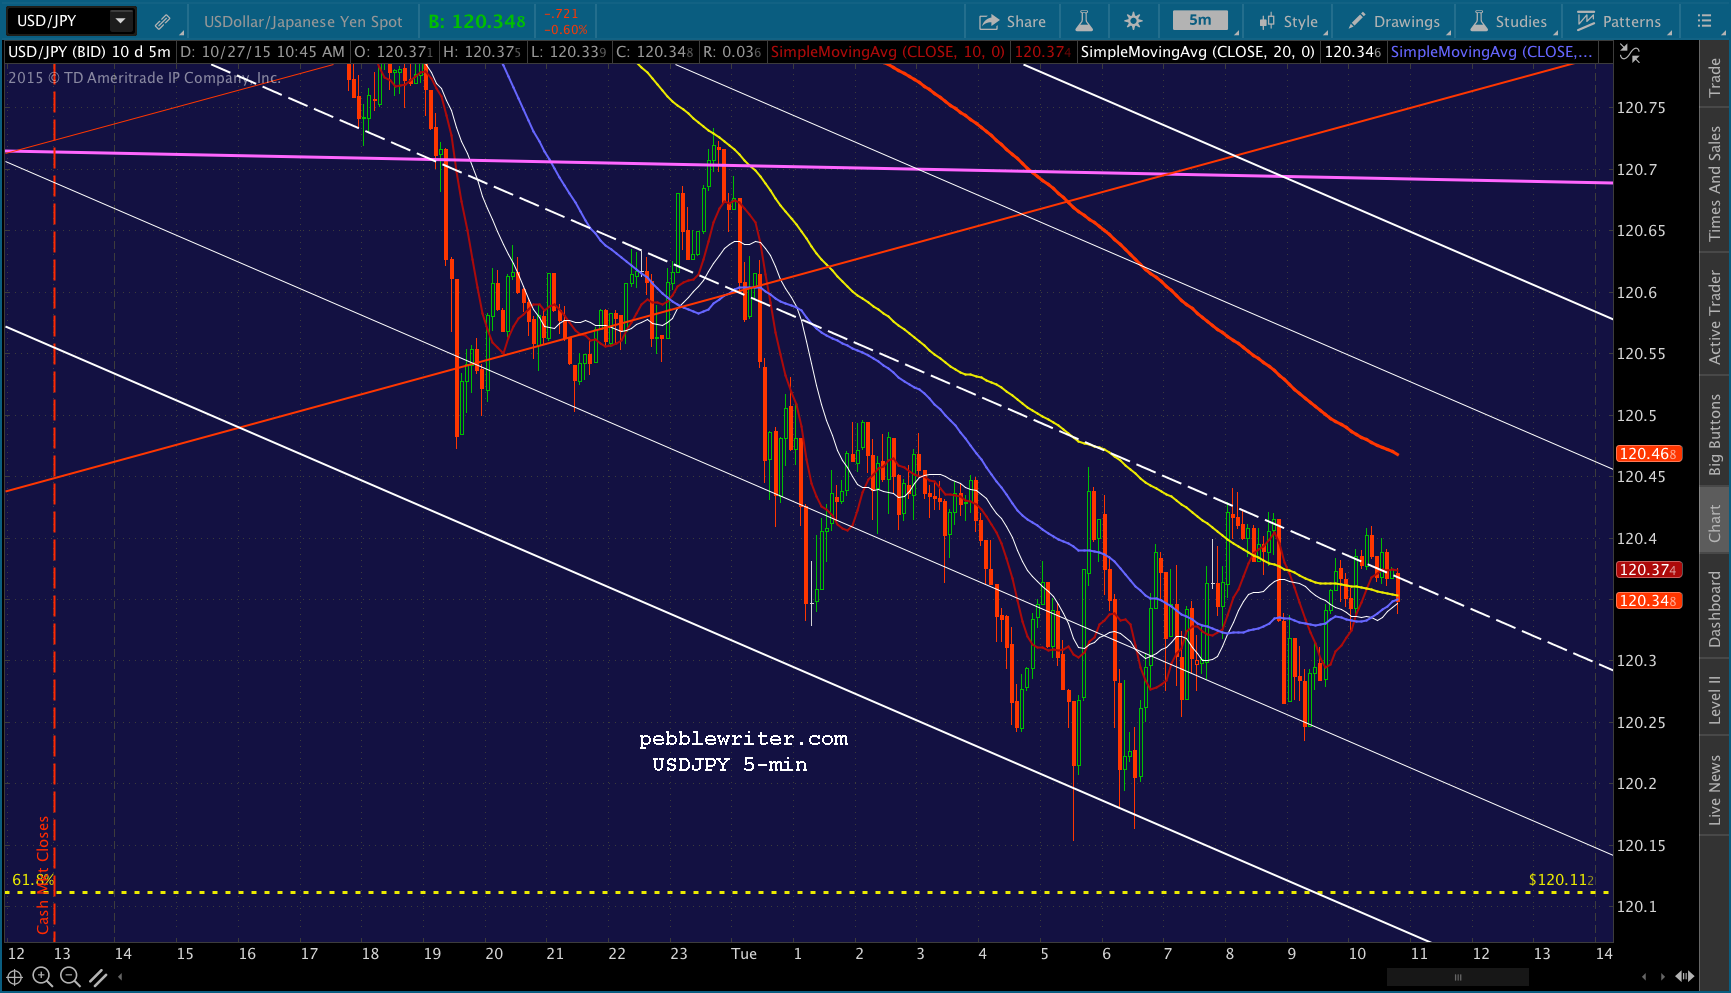 SPX is likely to respond in kind. I’d cut loose on the long position here, but be ready to switch back in case it’s a head fake. The 5-min SMA20 (white) should be a good guide.
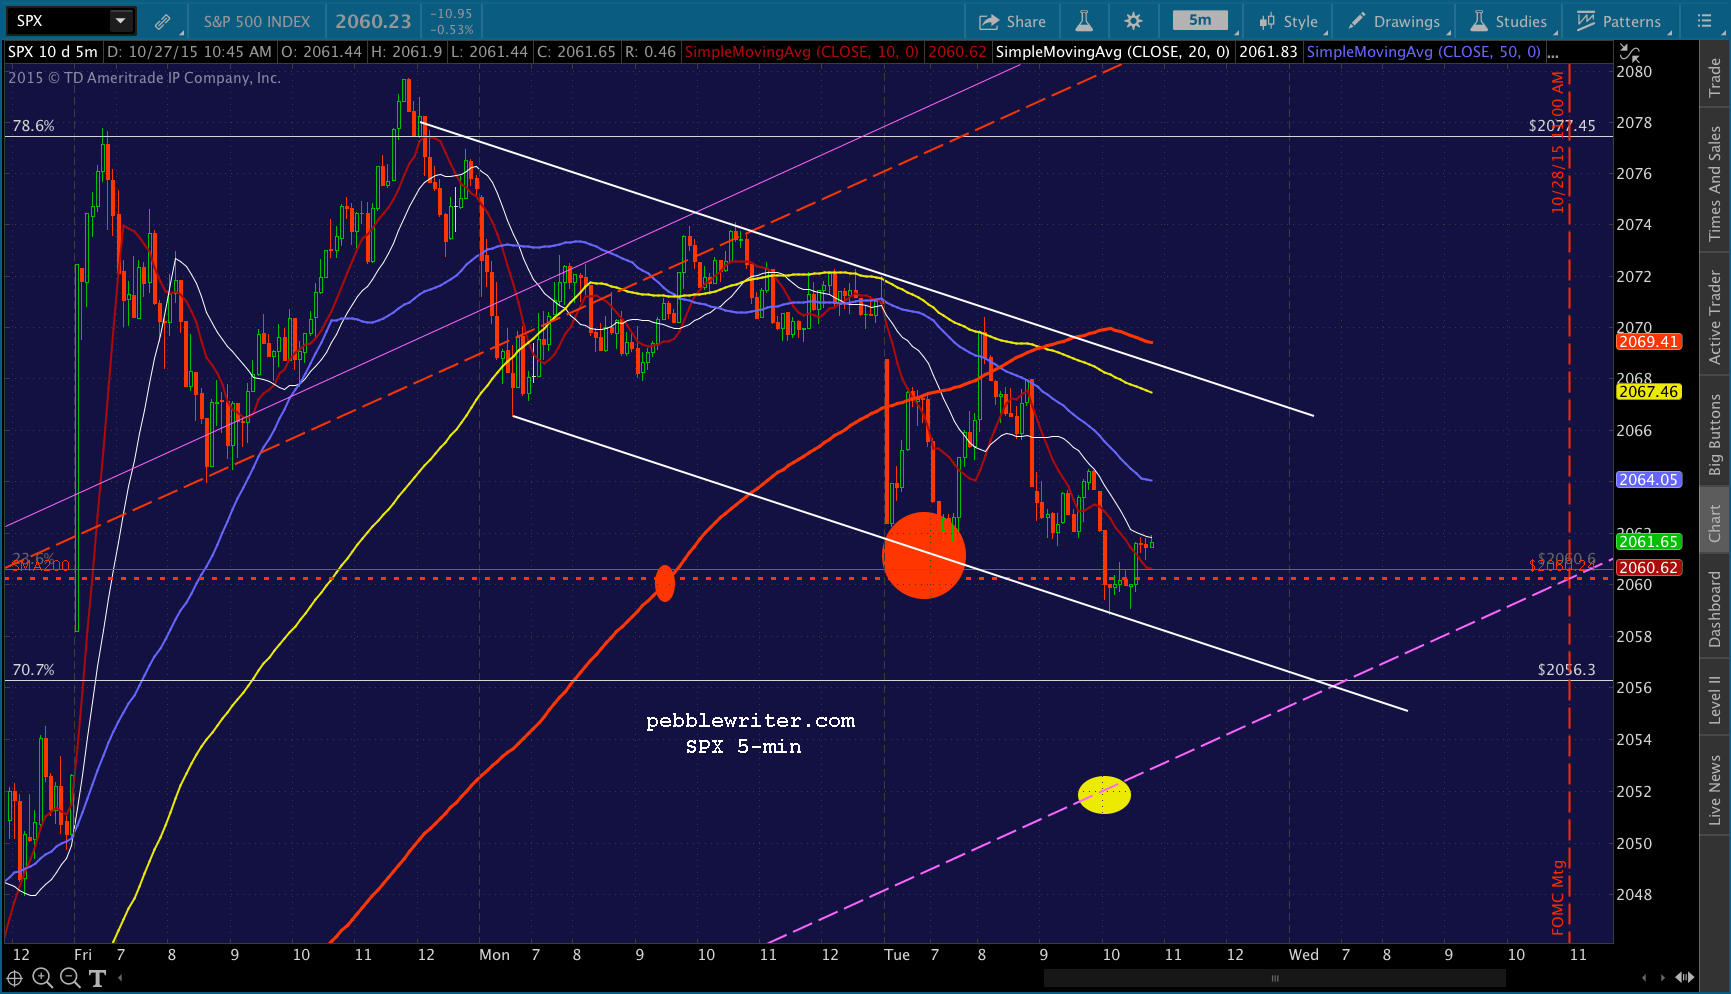 UPDATE: 2:00 PM
VIX is breaking down, so back to long here.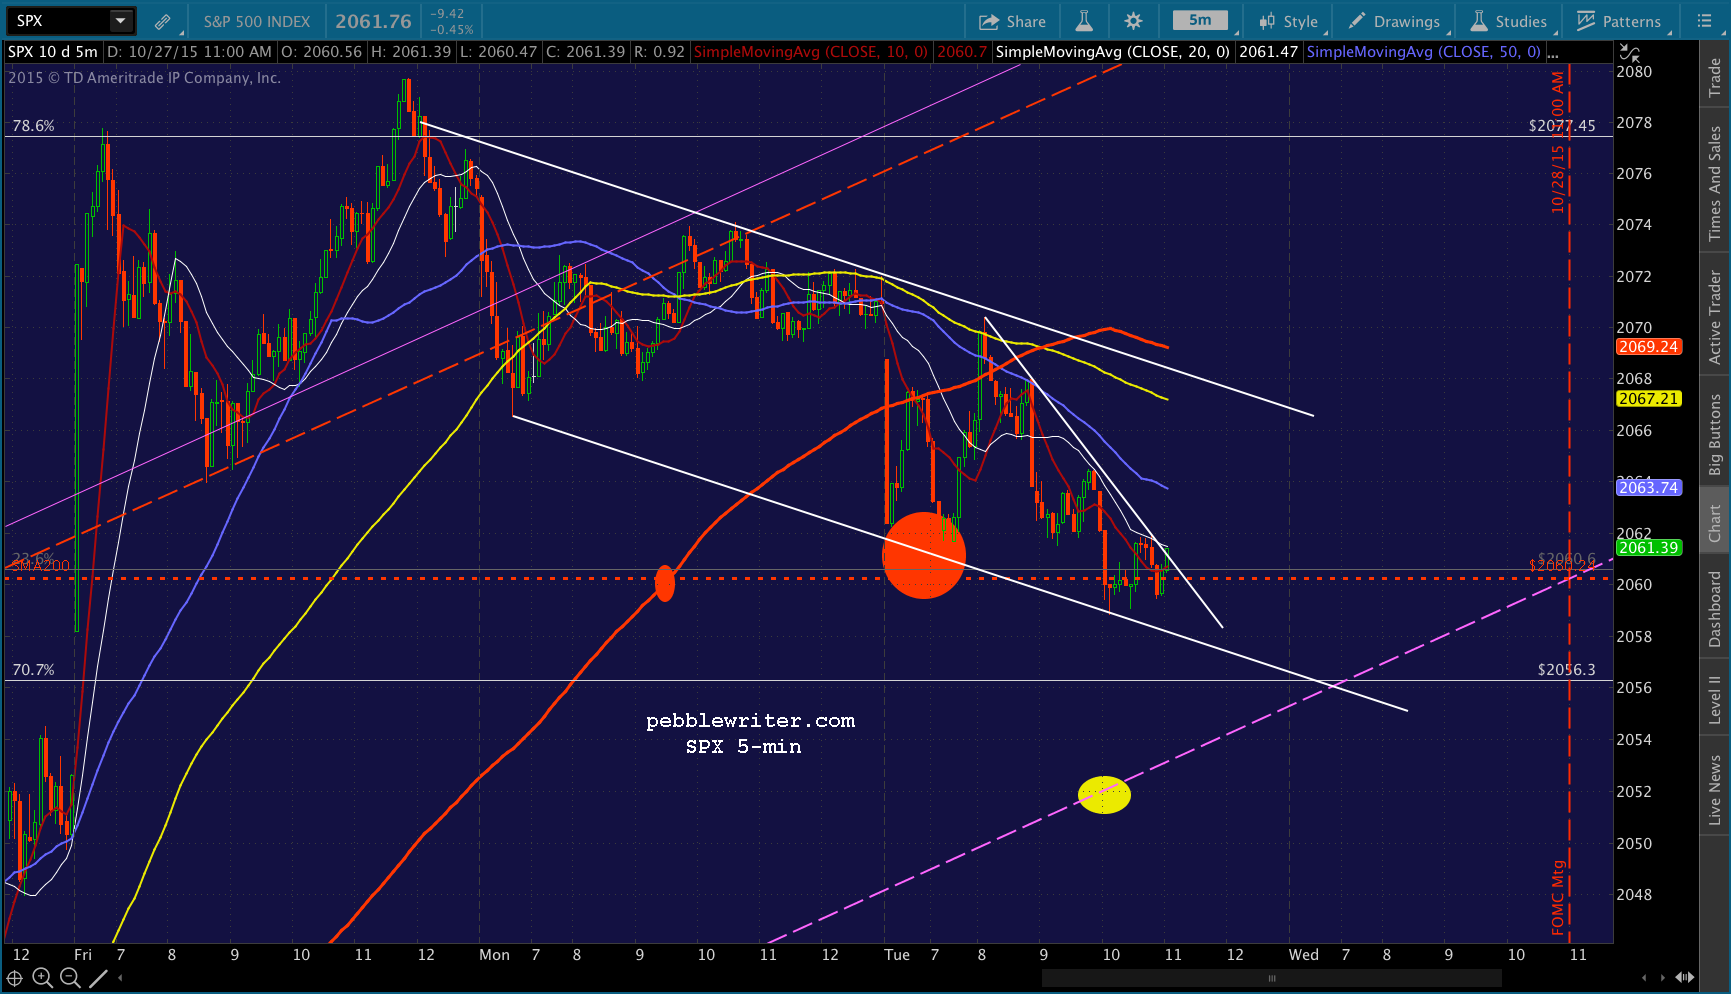
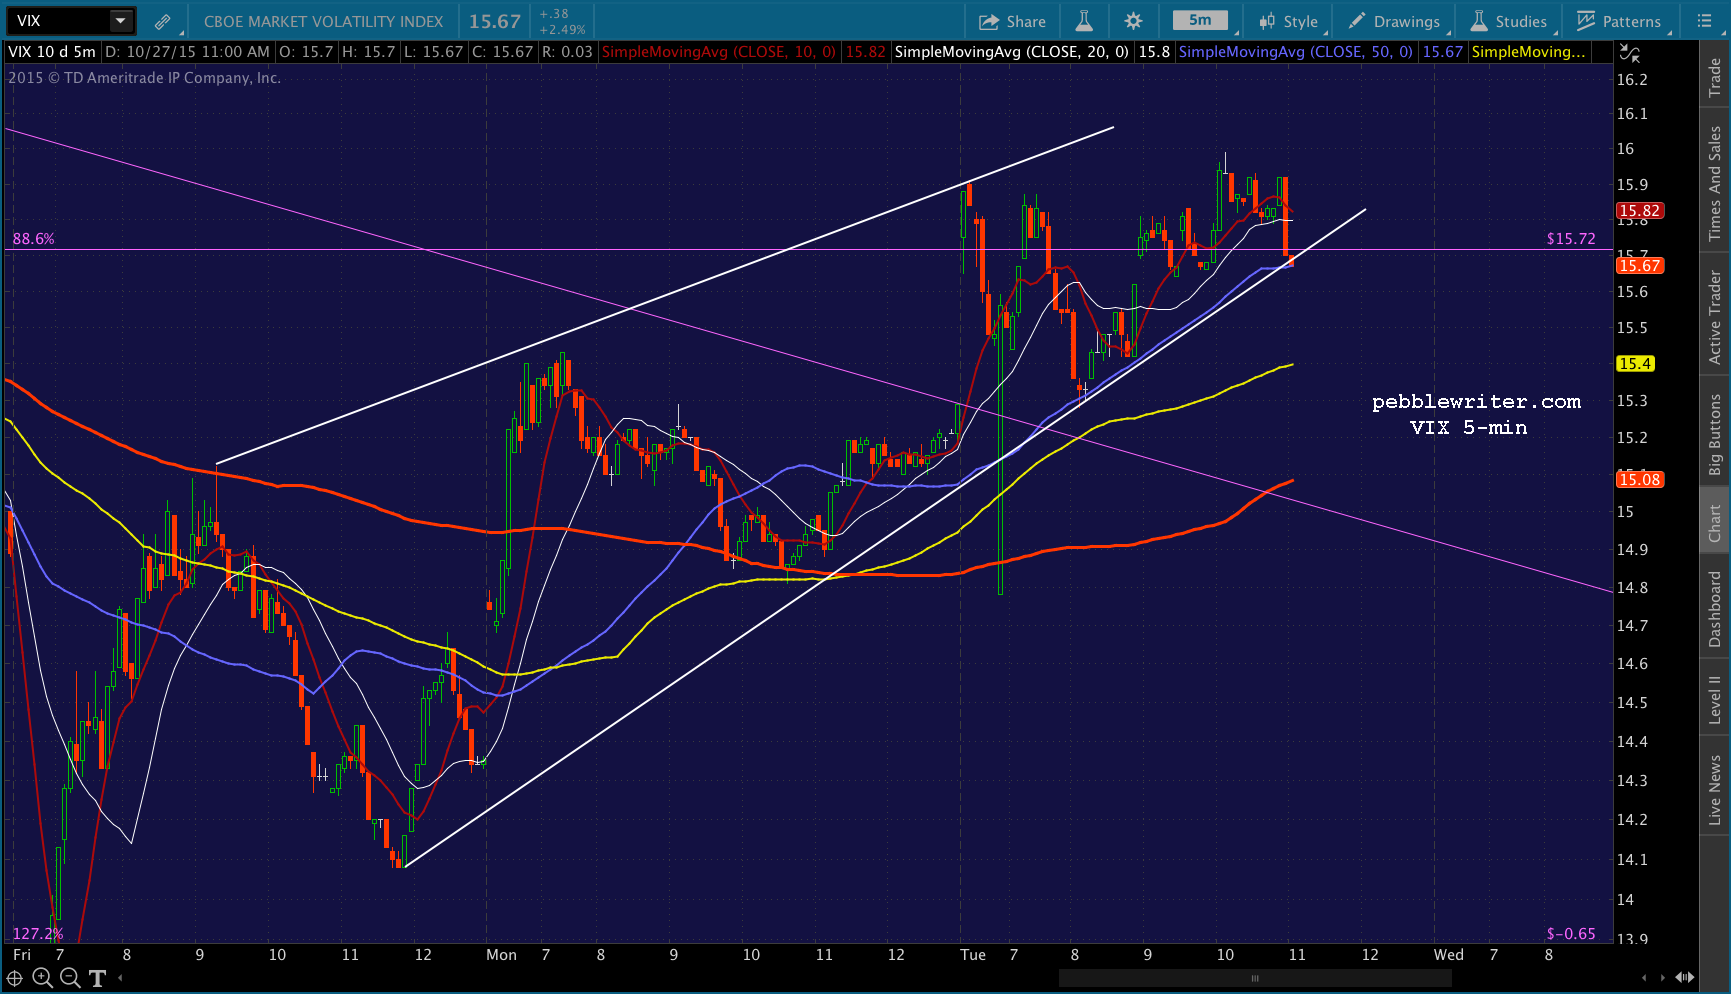 Just be aware of a potential headfake as occurred at 10:00 this morning.
UPDATE: 2:07 PM
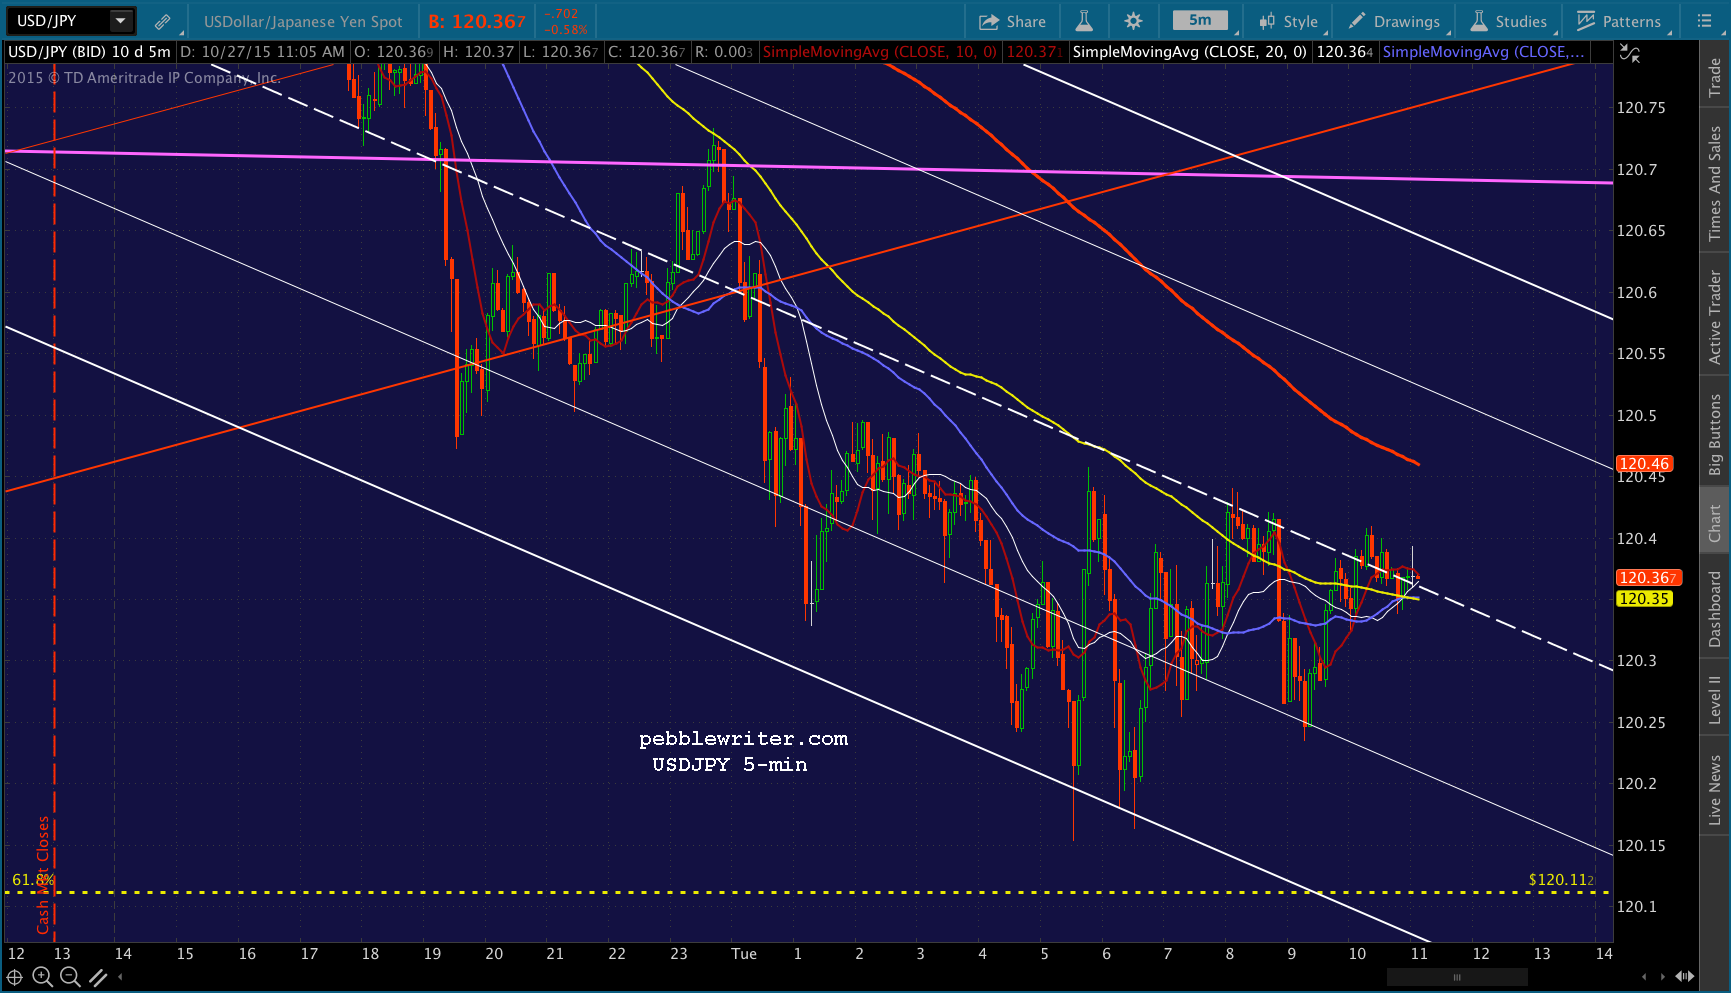
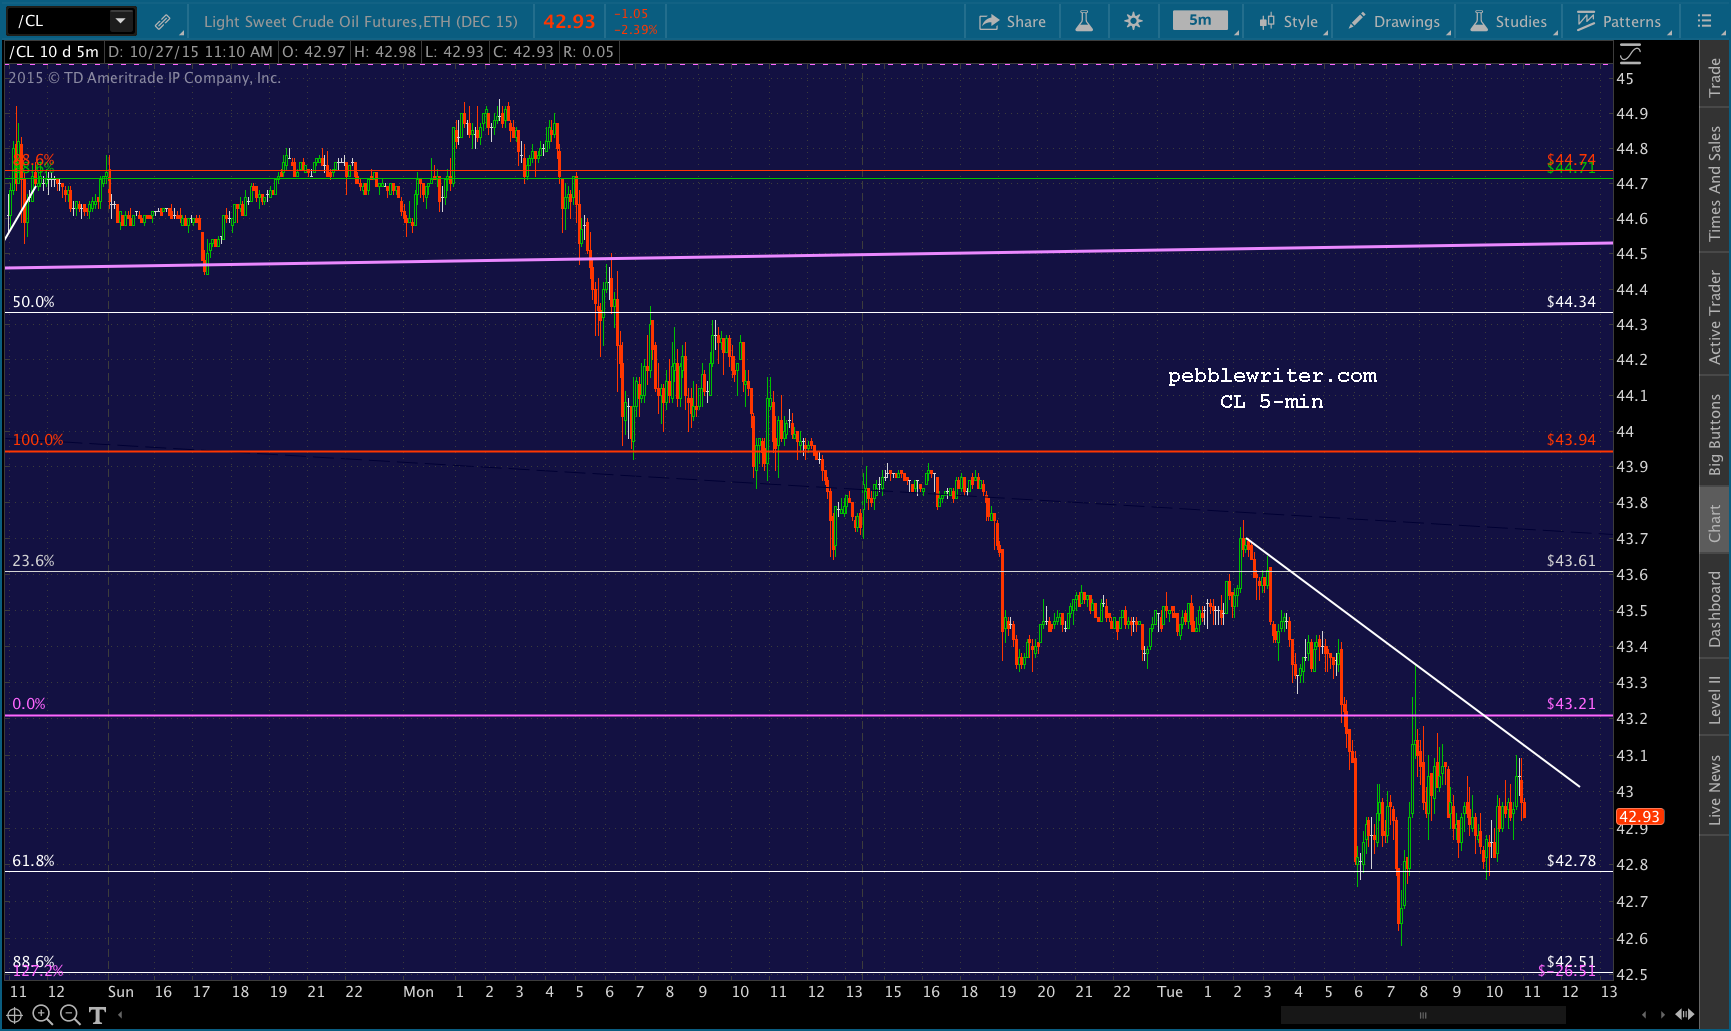
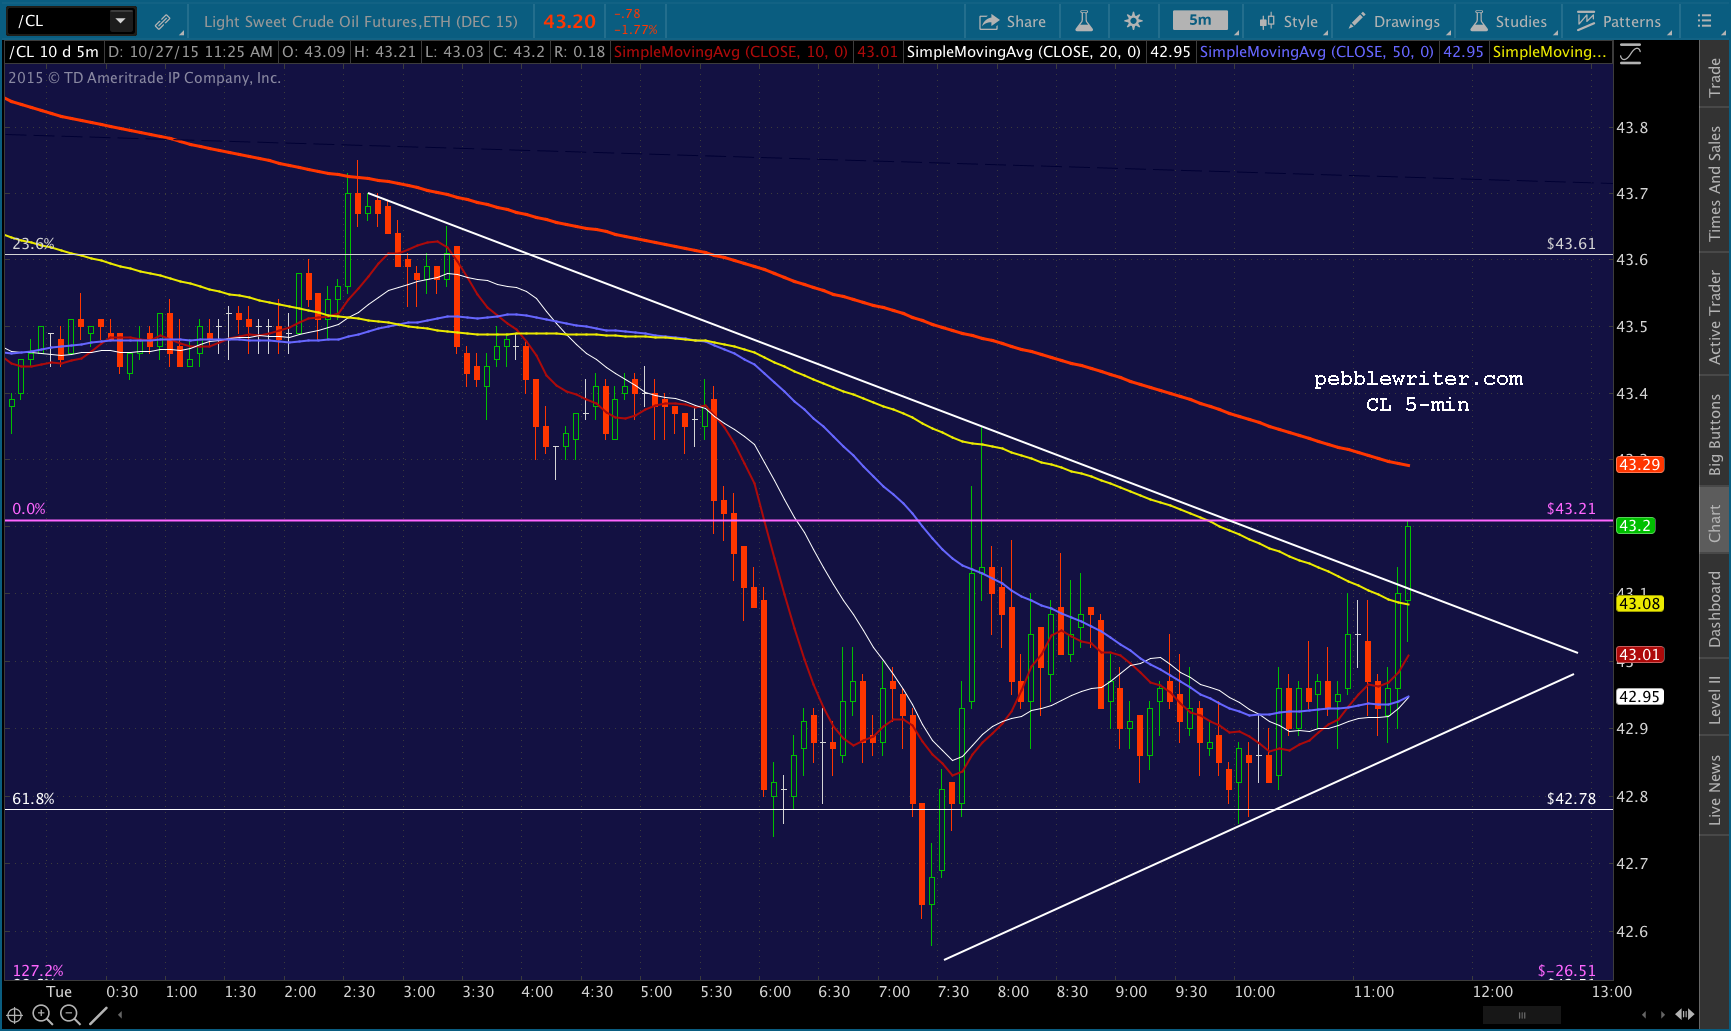
USDJPY, CL and SPX are all acting quite sluggish. Even VIX is backtesting the broken white TL. I don’t have much confidence in this bounce just yet. But, let’s also recognize that it could be the converse of yesterday’s move: i.e., an artificial ceiling on prices during the session so that the real bounce takes place overnight.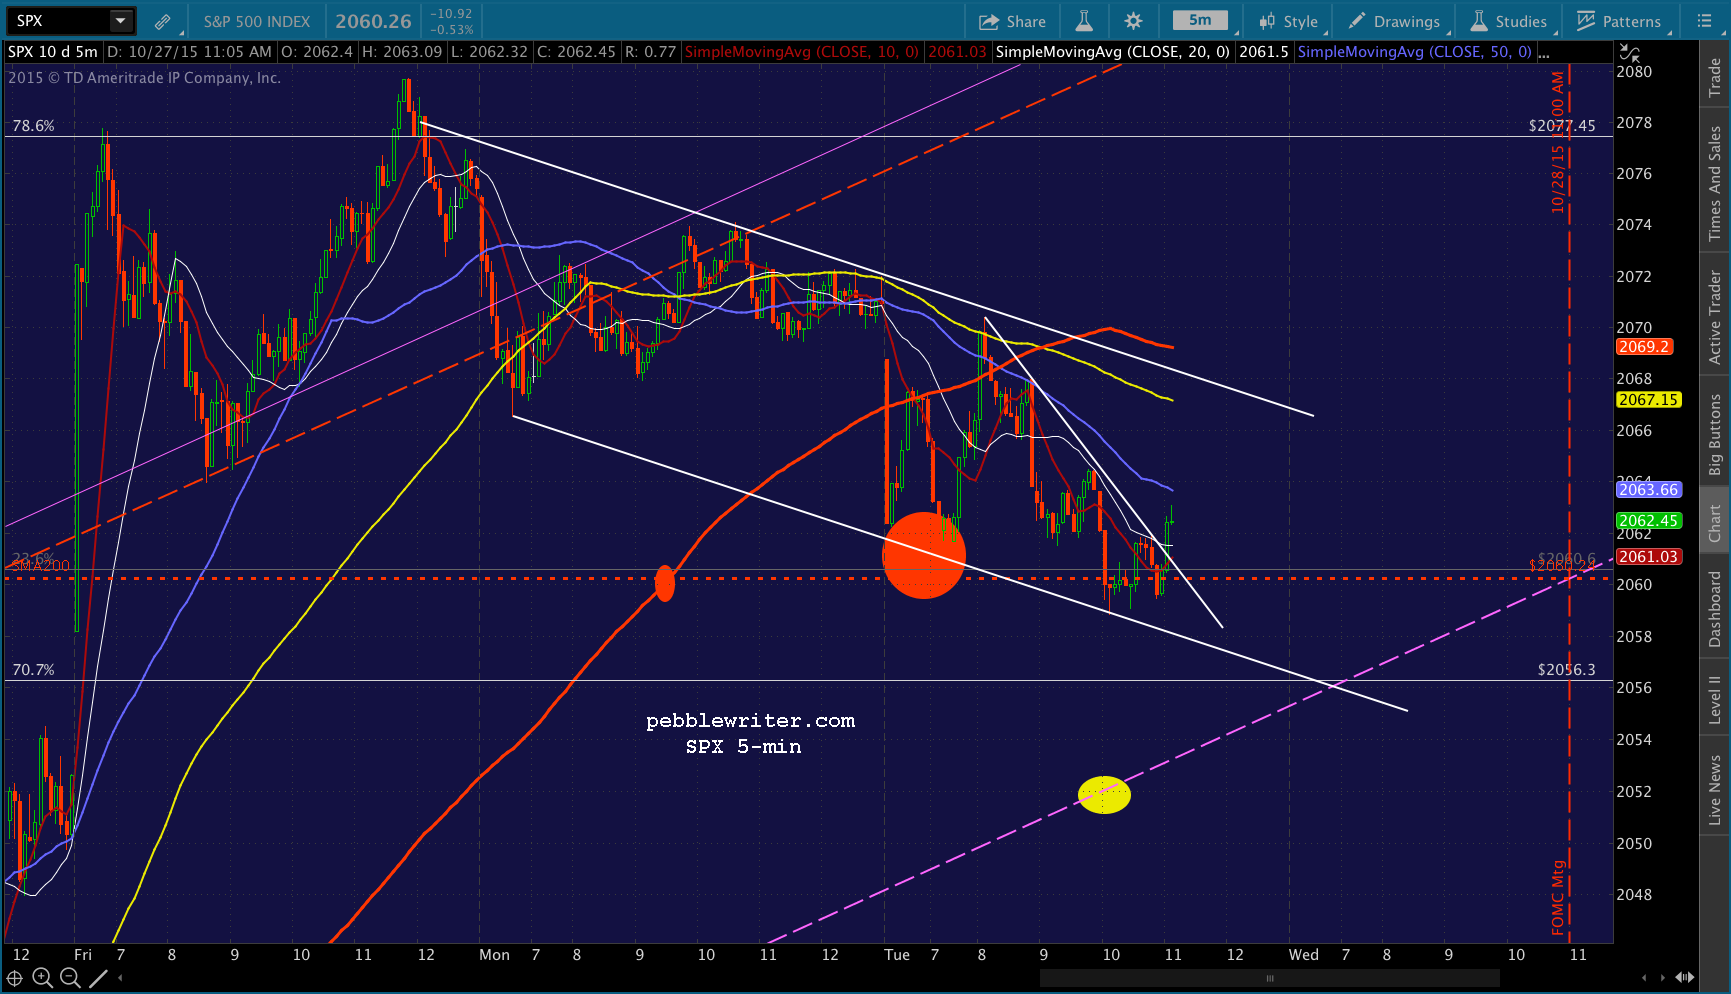
 UPDATE: 2:19 PM
Hard to stay positive here, with USDJPY tanking. Maybe just a SMA200 backtest. HFT gamesmanship, either way… My gut tells me to just go to cash. In this case, I’ll follow my gut.
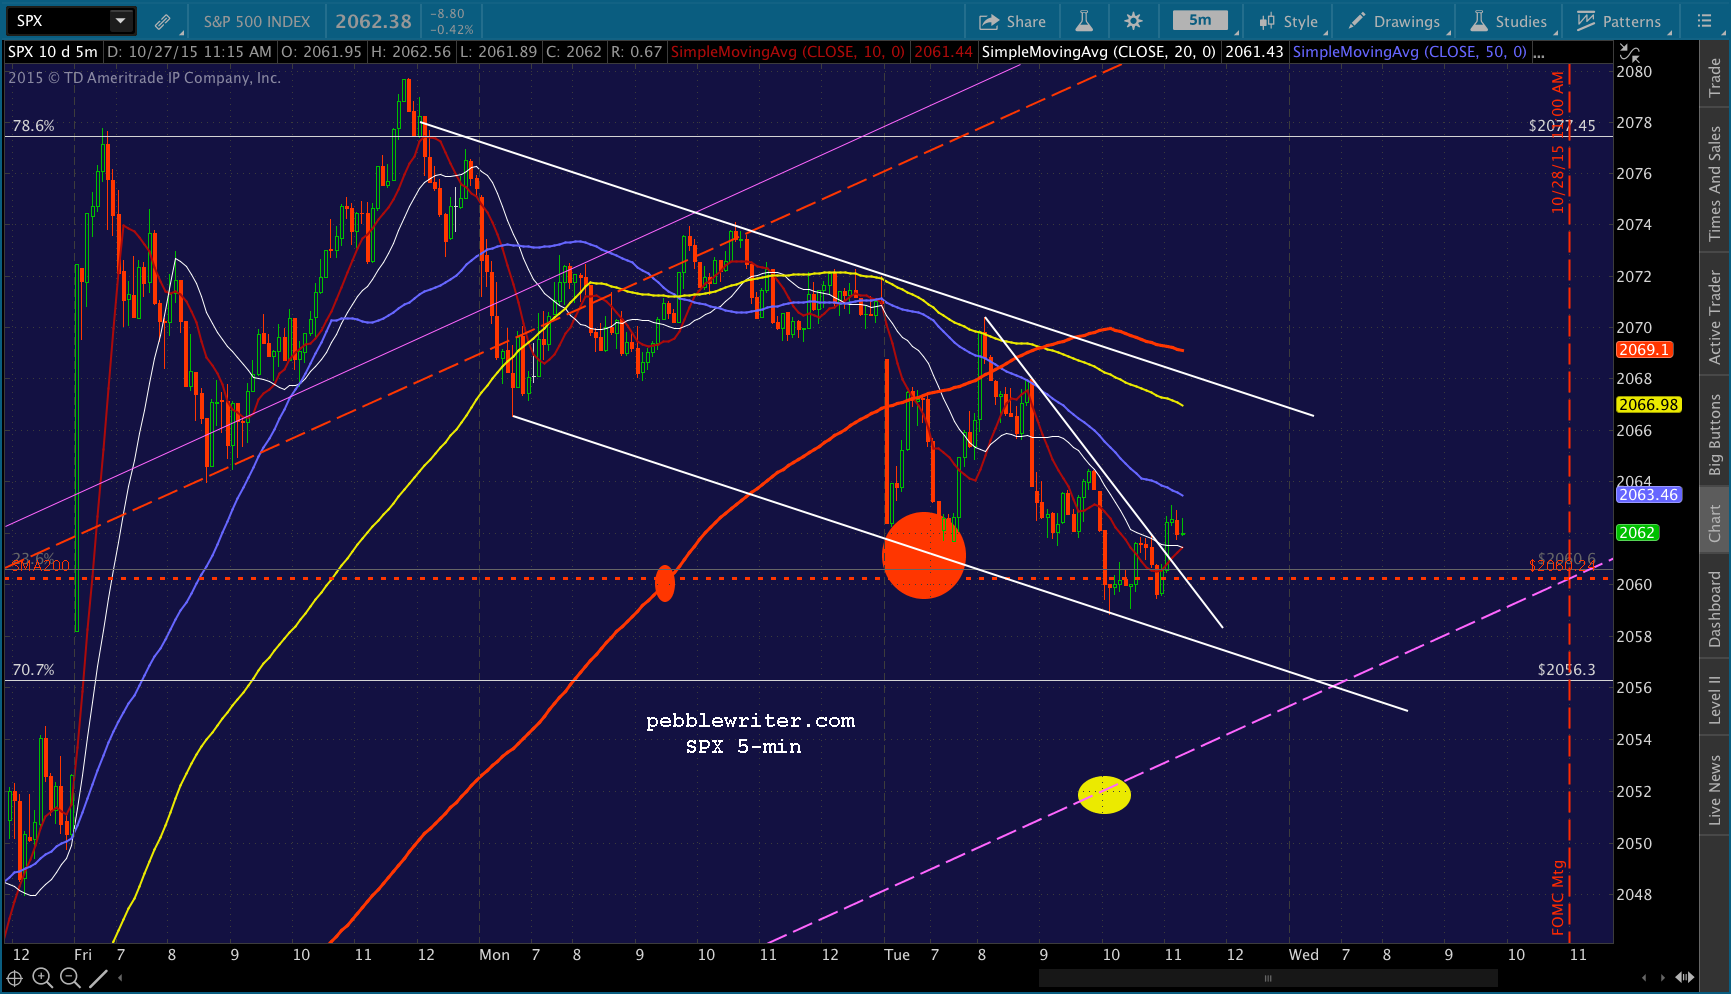
If it does dip back below the SMA200 — which appears likely — there will be no way to know whether it’s a head fake just like yesterday.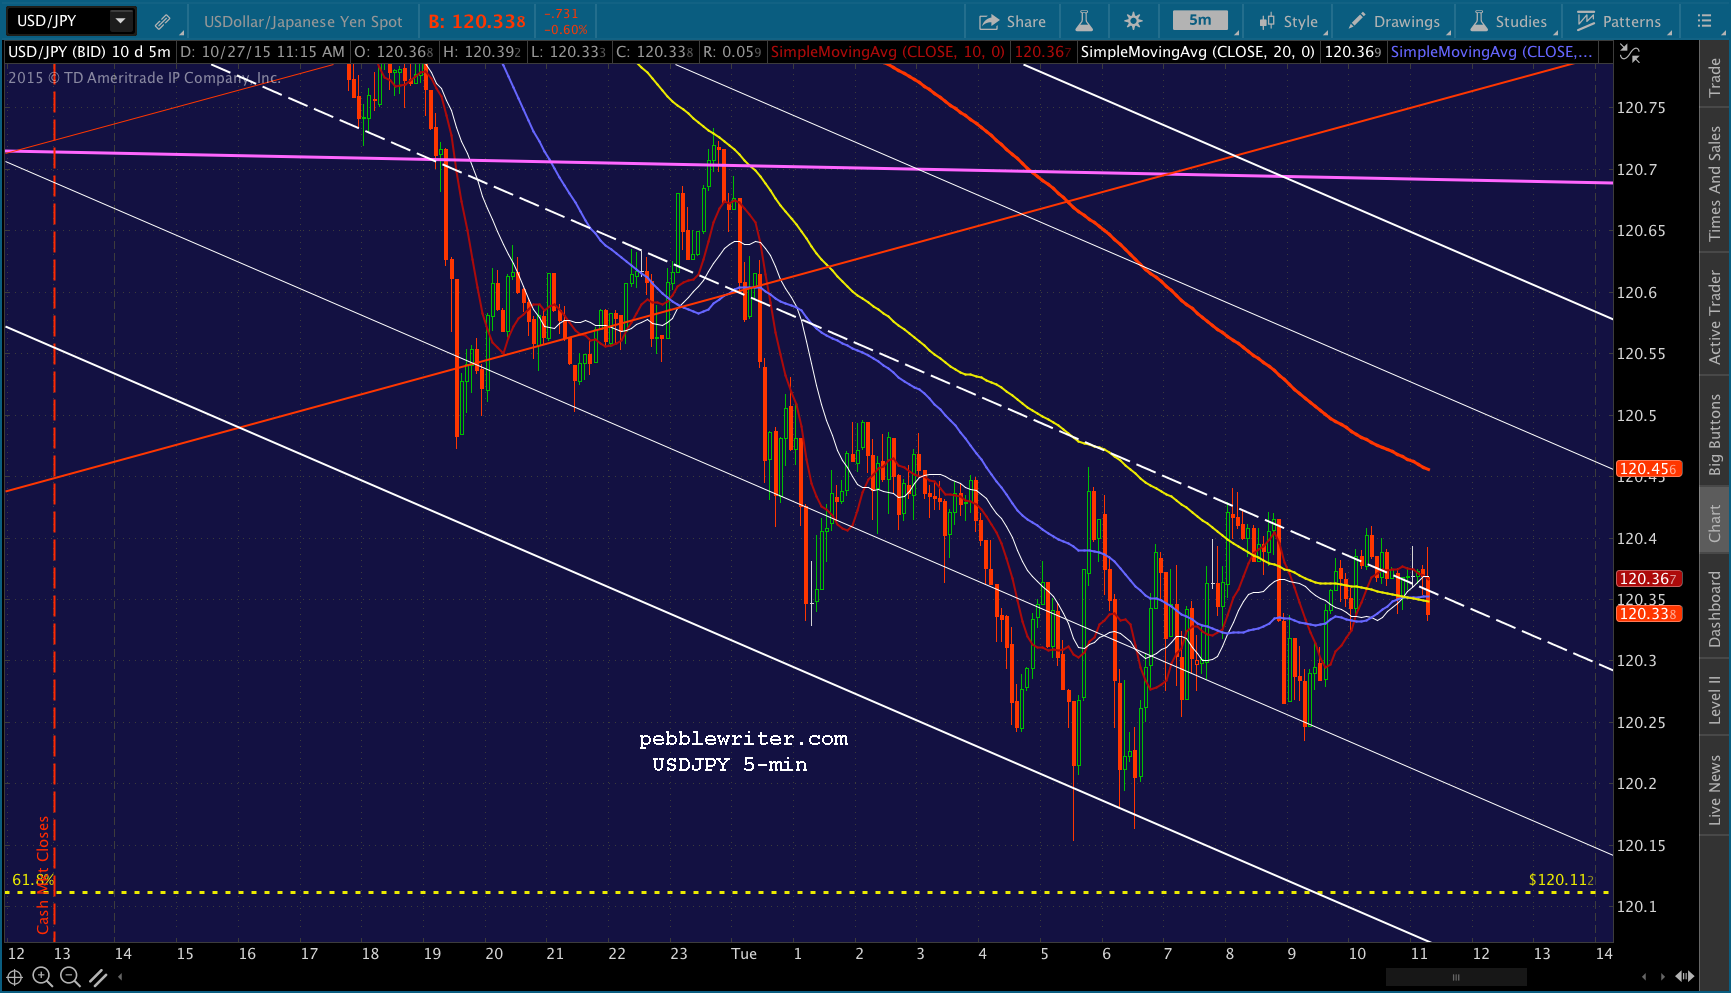
 UPDATE: 2:28 PM
Even the algos don’t know which way they’re going! USDJPY arguing lower, while CL is arguing higher. VIX is sitting right on the TL, so neutral. Cash makes all the sense in the world right here — as well as overnight.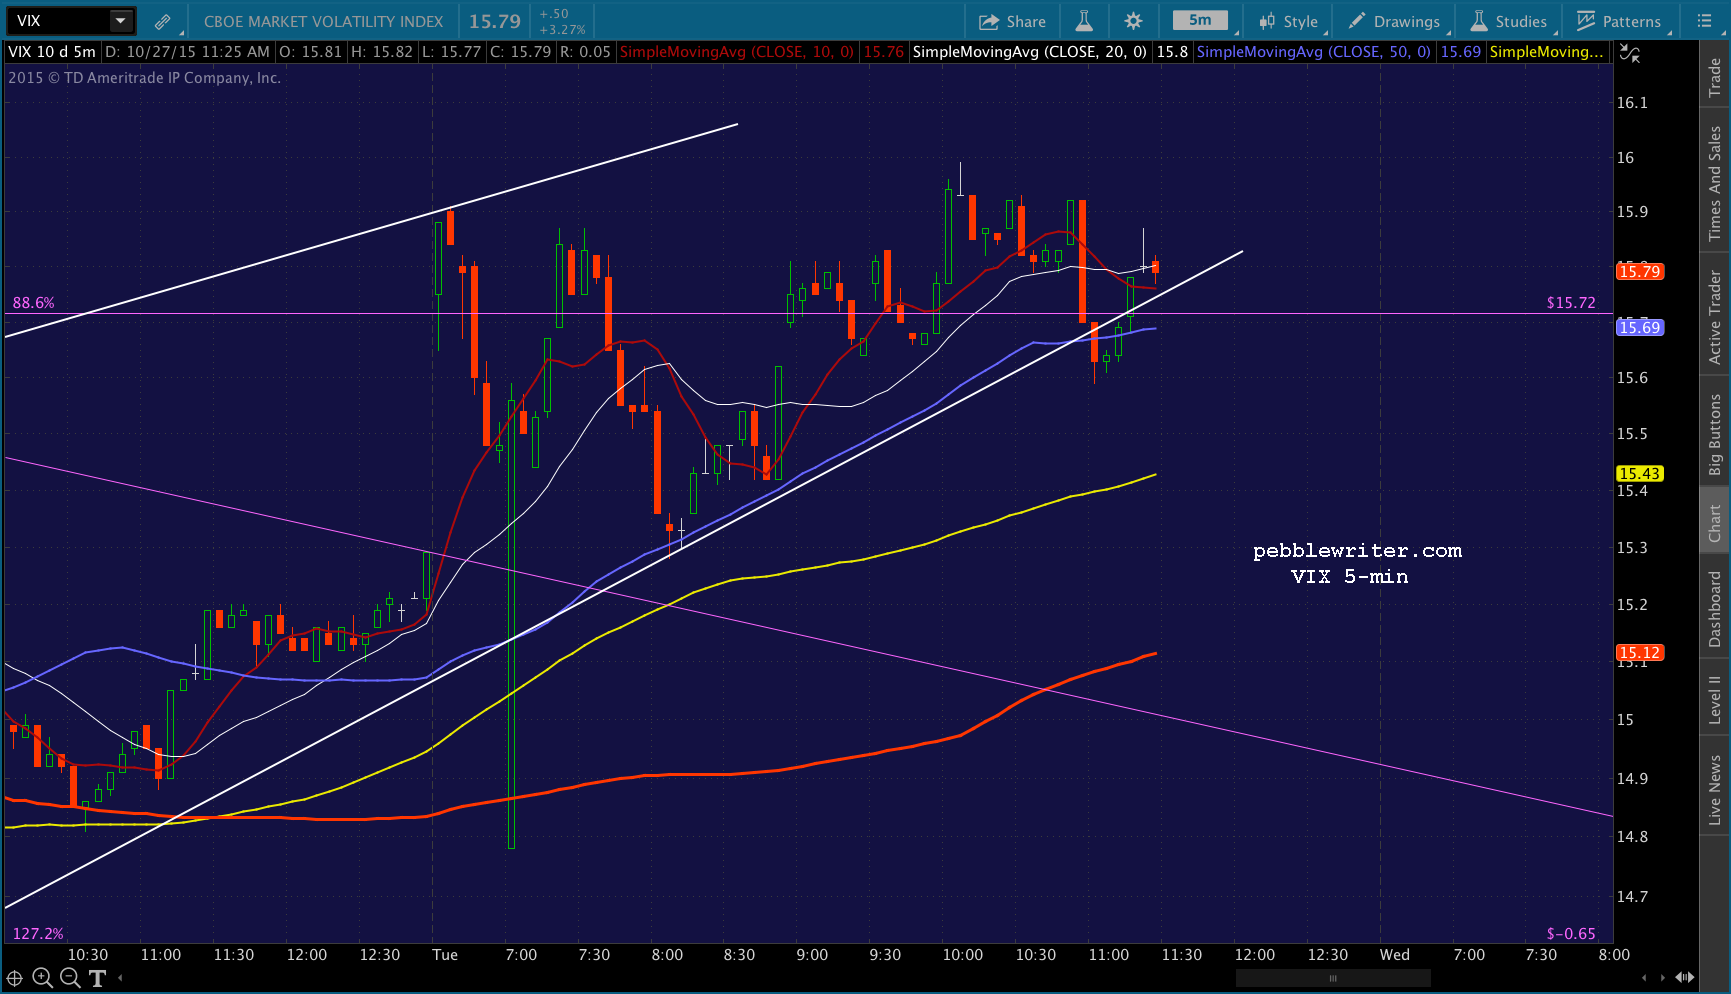
 EPILOGUE
Lots of flag patterns. It’s a potential continuation pattern, but there must be a break out in order for them to produce any upside. Until then, they’re just falling channels.
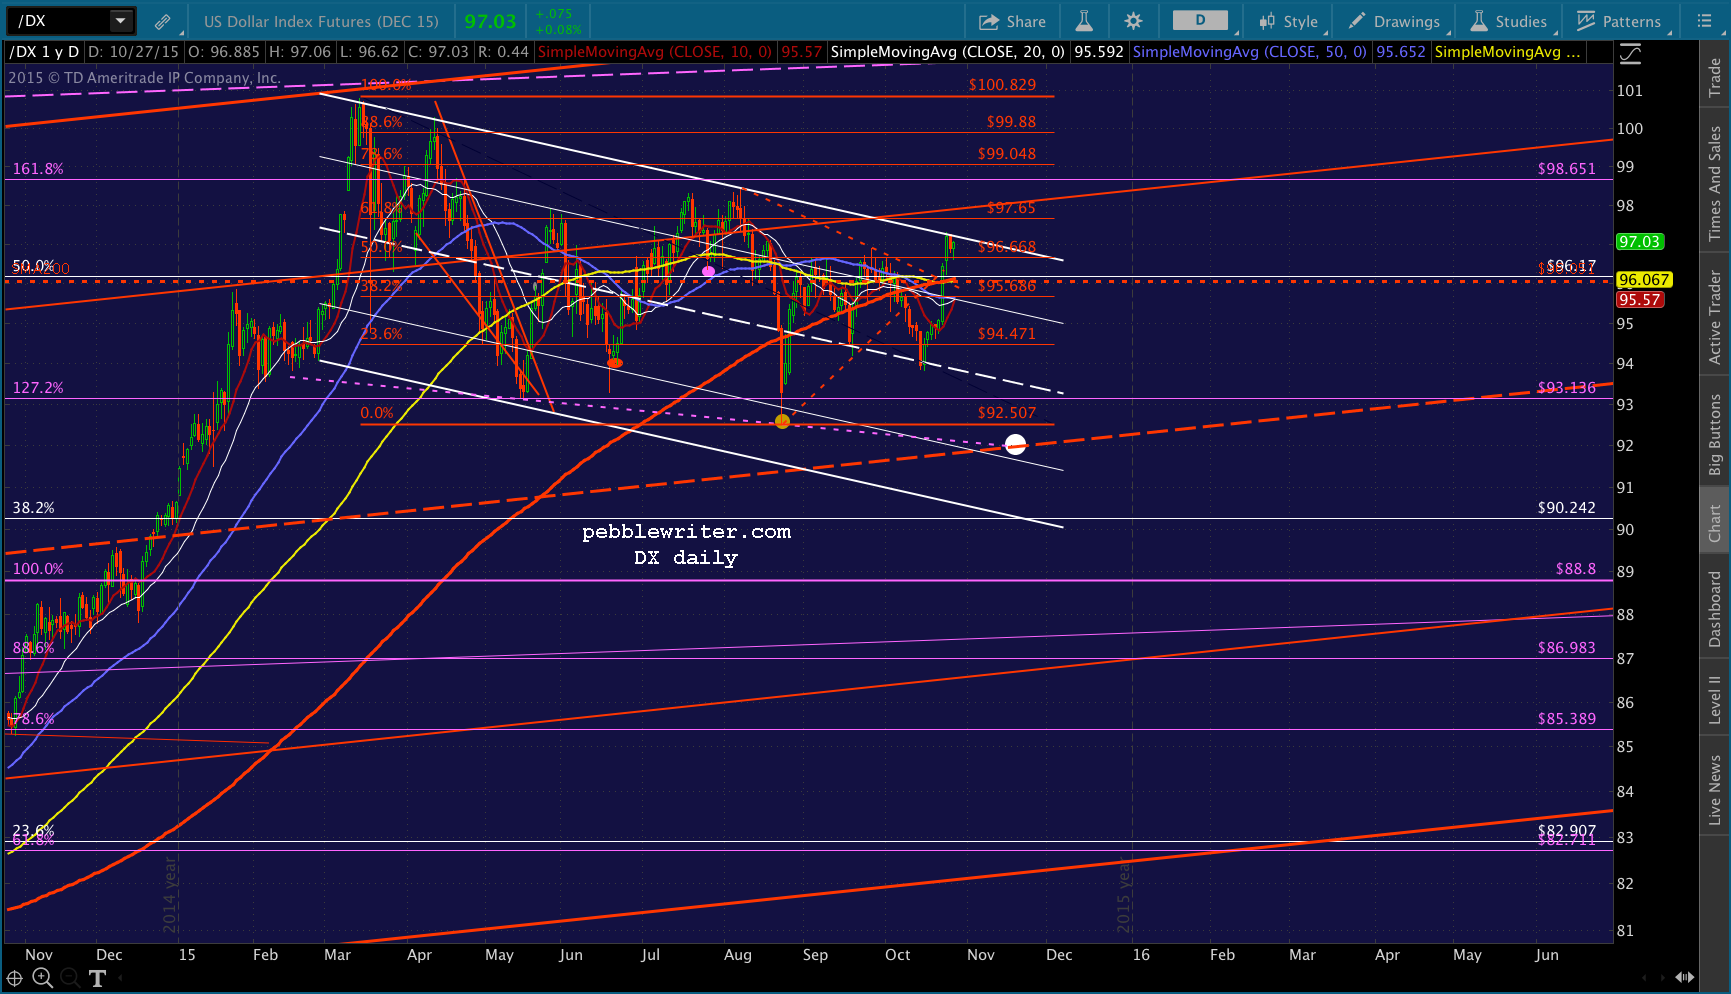
SPX got back to the top of its declining flag pattern. 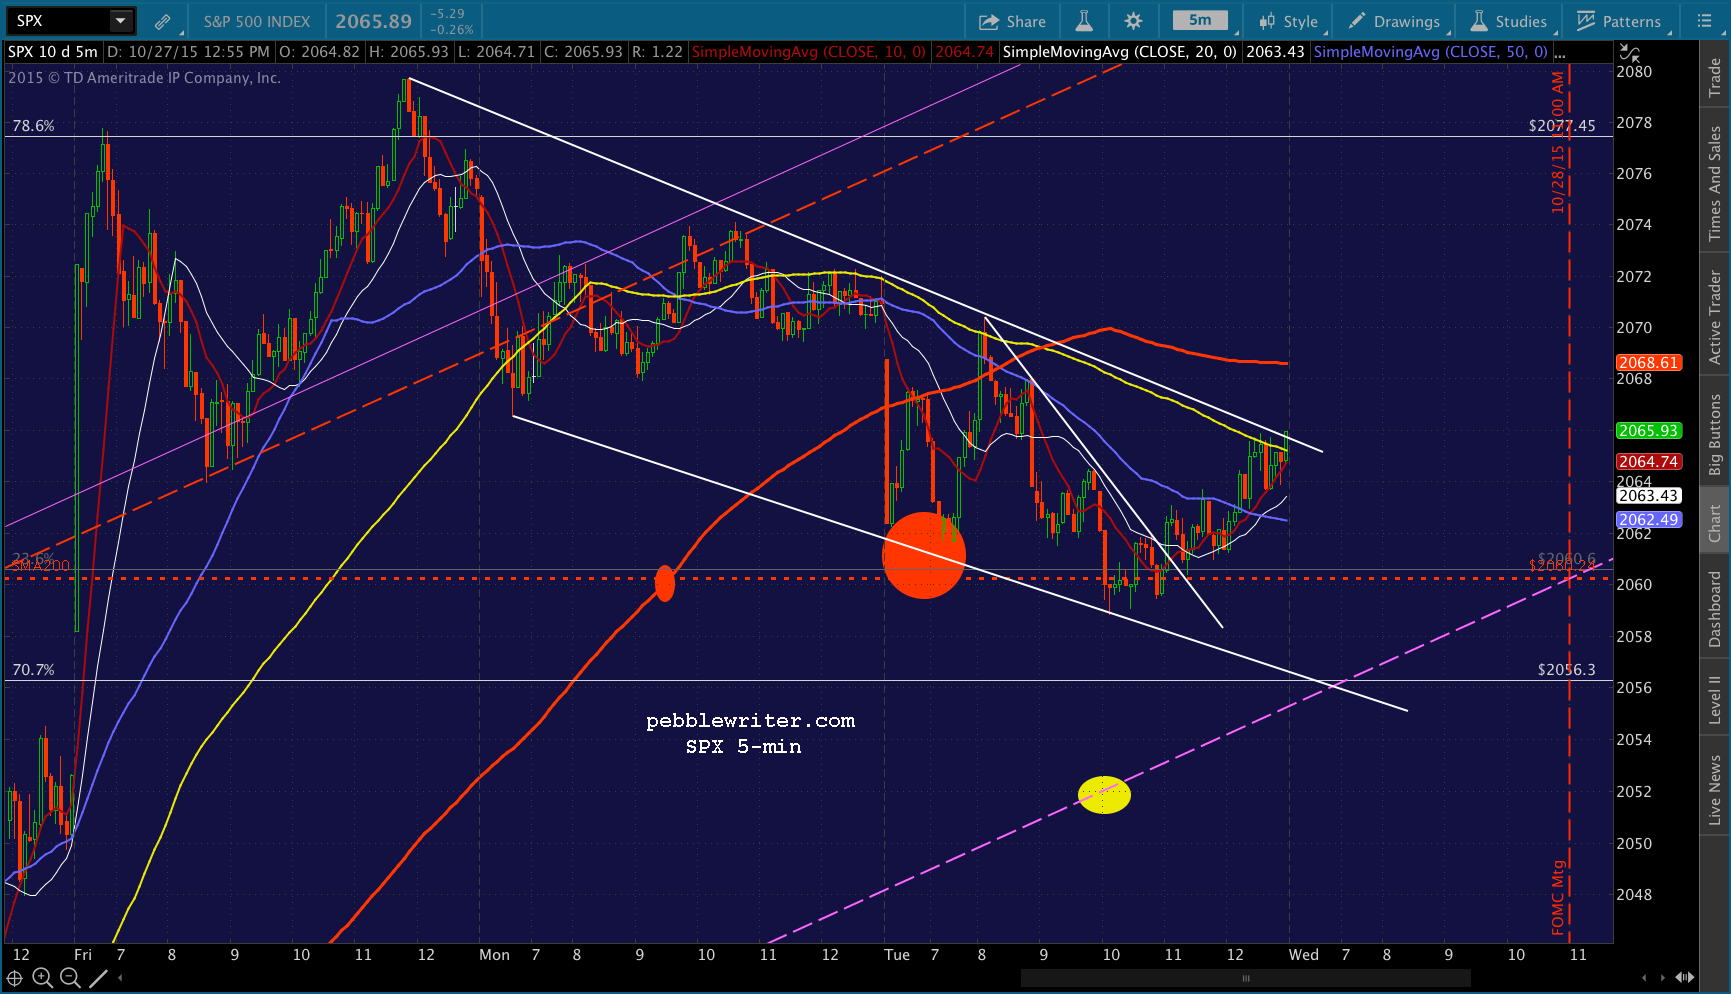 But, DX still hasn’t broken out of its.
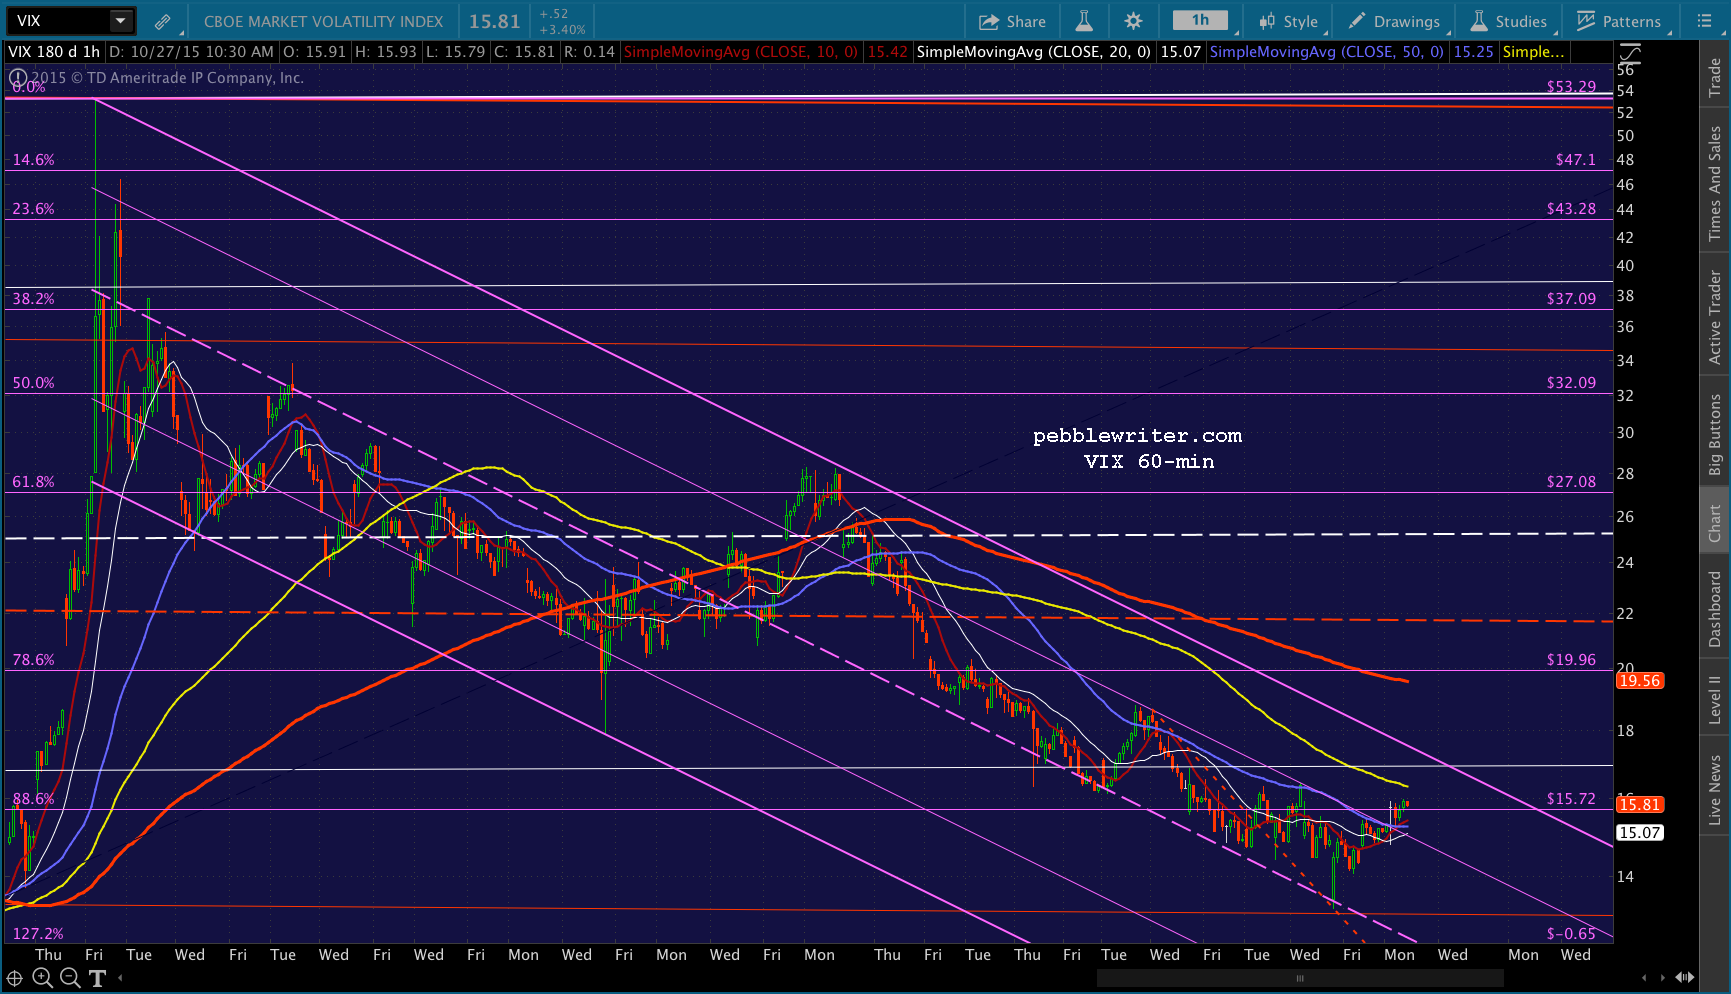
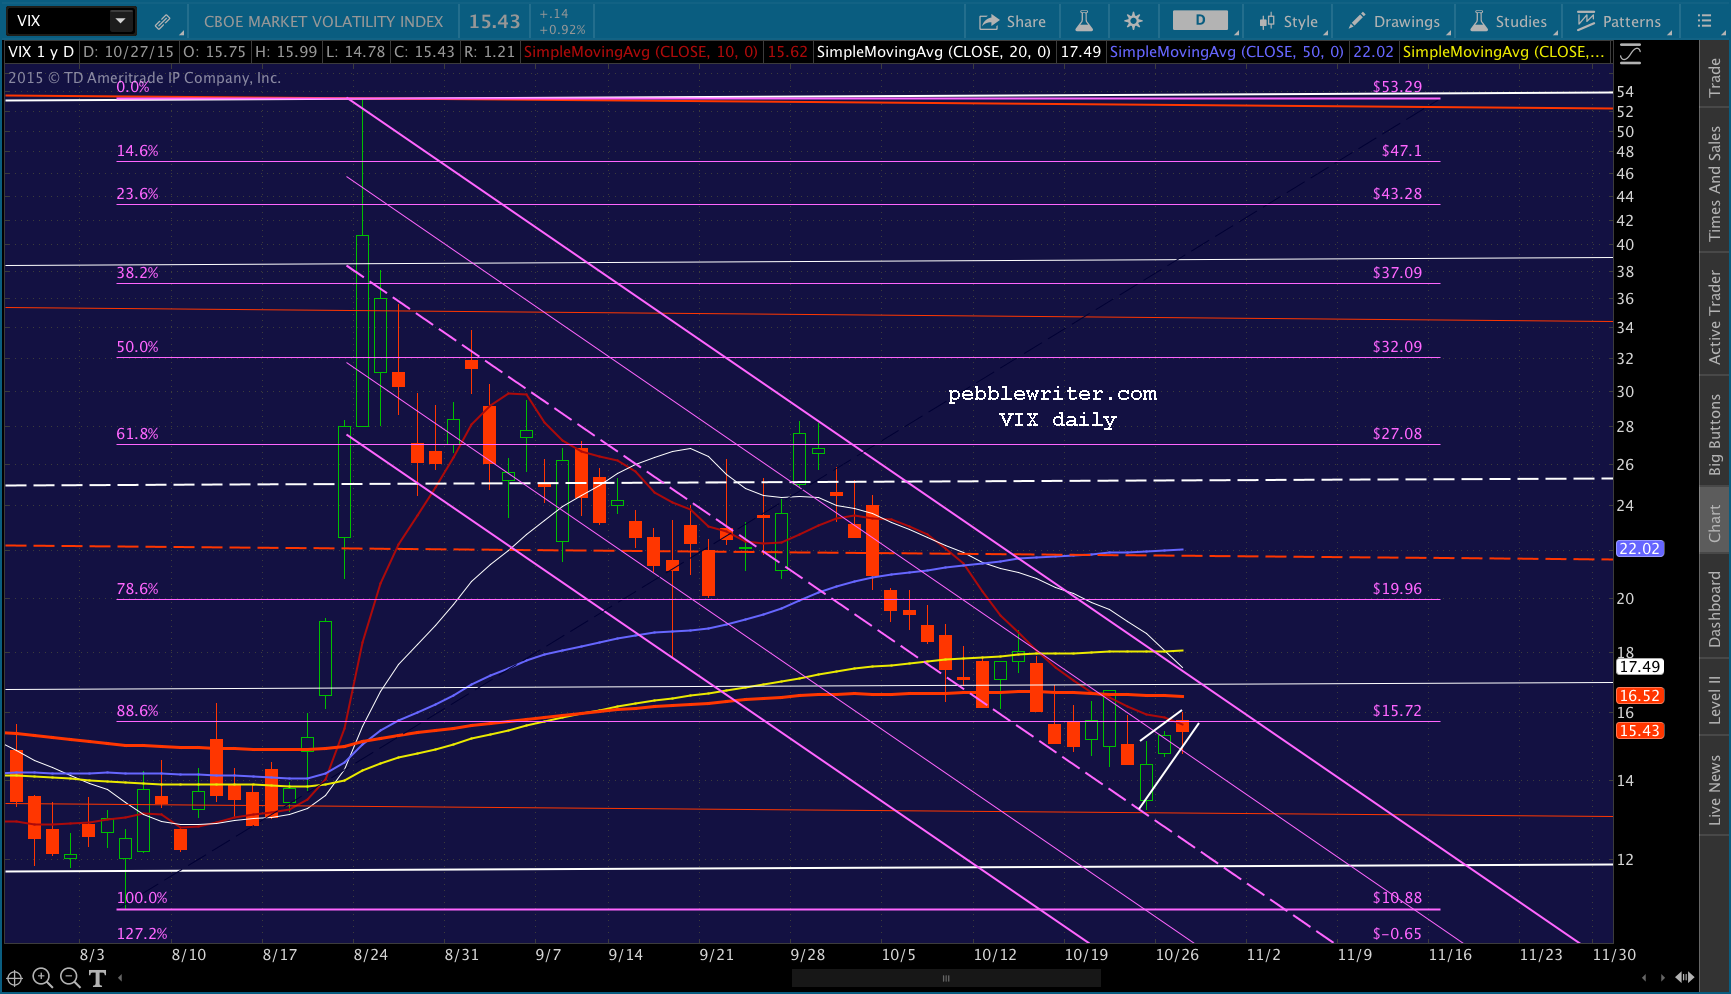
 VIX is on the rise in a very long-term channel which could be construed as a flag.
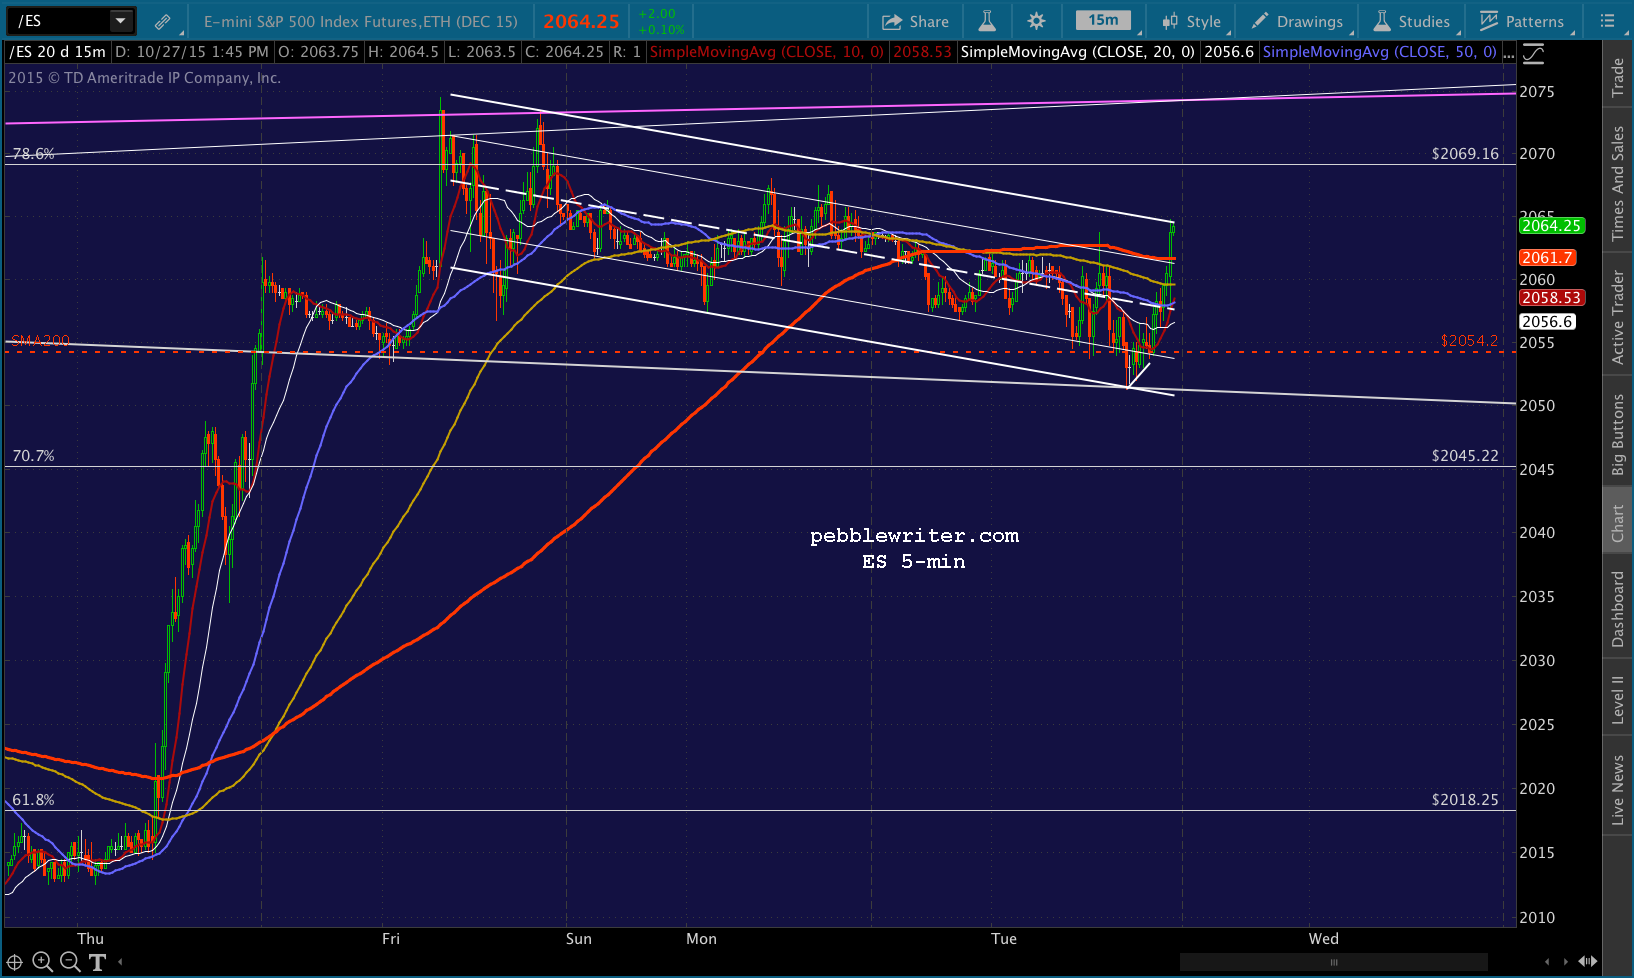
 And, ES is threatening to break out of its flag.
  The most important chart…USDJPY is still in a falling channel that hasn’t yet reached 120.11.