

The next few couple of days should betray little until the BoJ and FOMC announce their intentions. The USDJPY is wedged in between the SMA200 and the .618 Fib at 120.11, ready to sprint in either direction.
 Other key metrics are equally non-committal.
continued for members…CL is tracing out a triangle just below its key falling channel midline…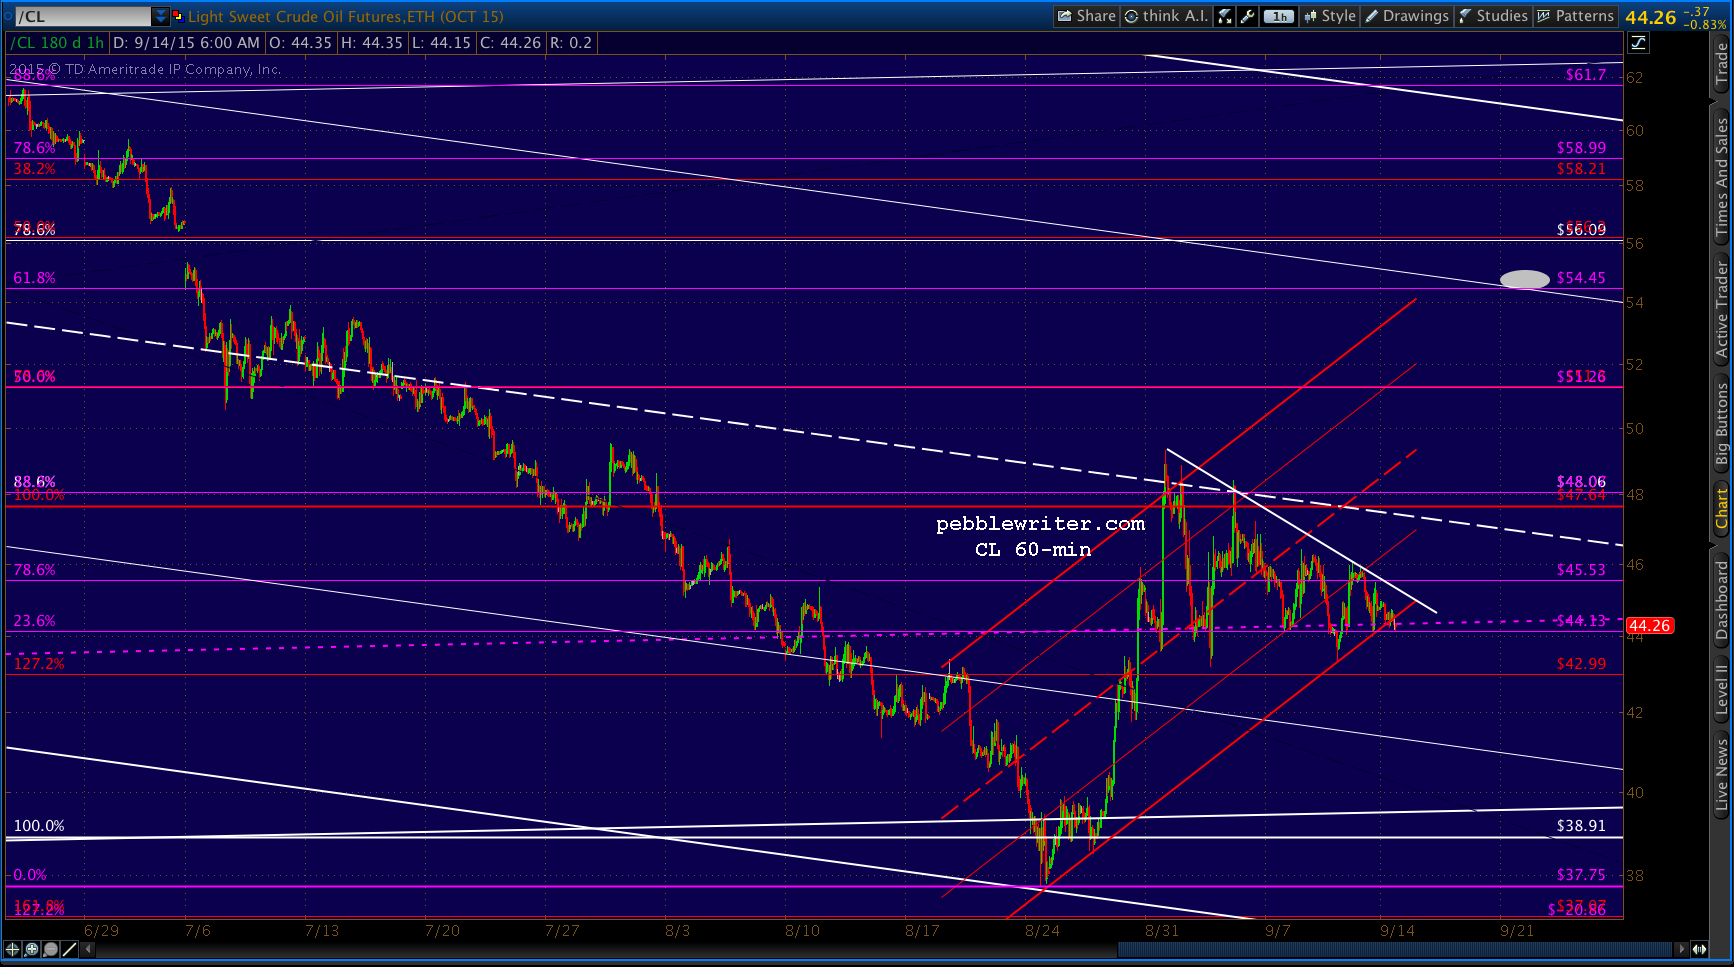 …while ES is clinging to its rather tired-looking rising channel.
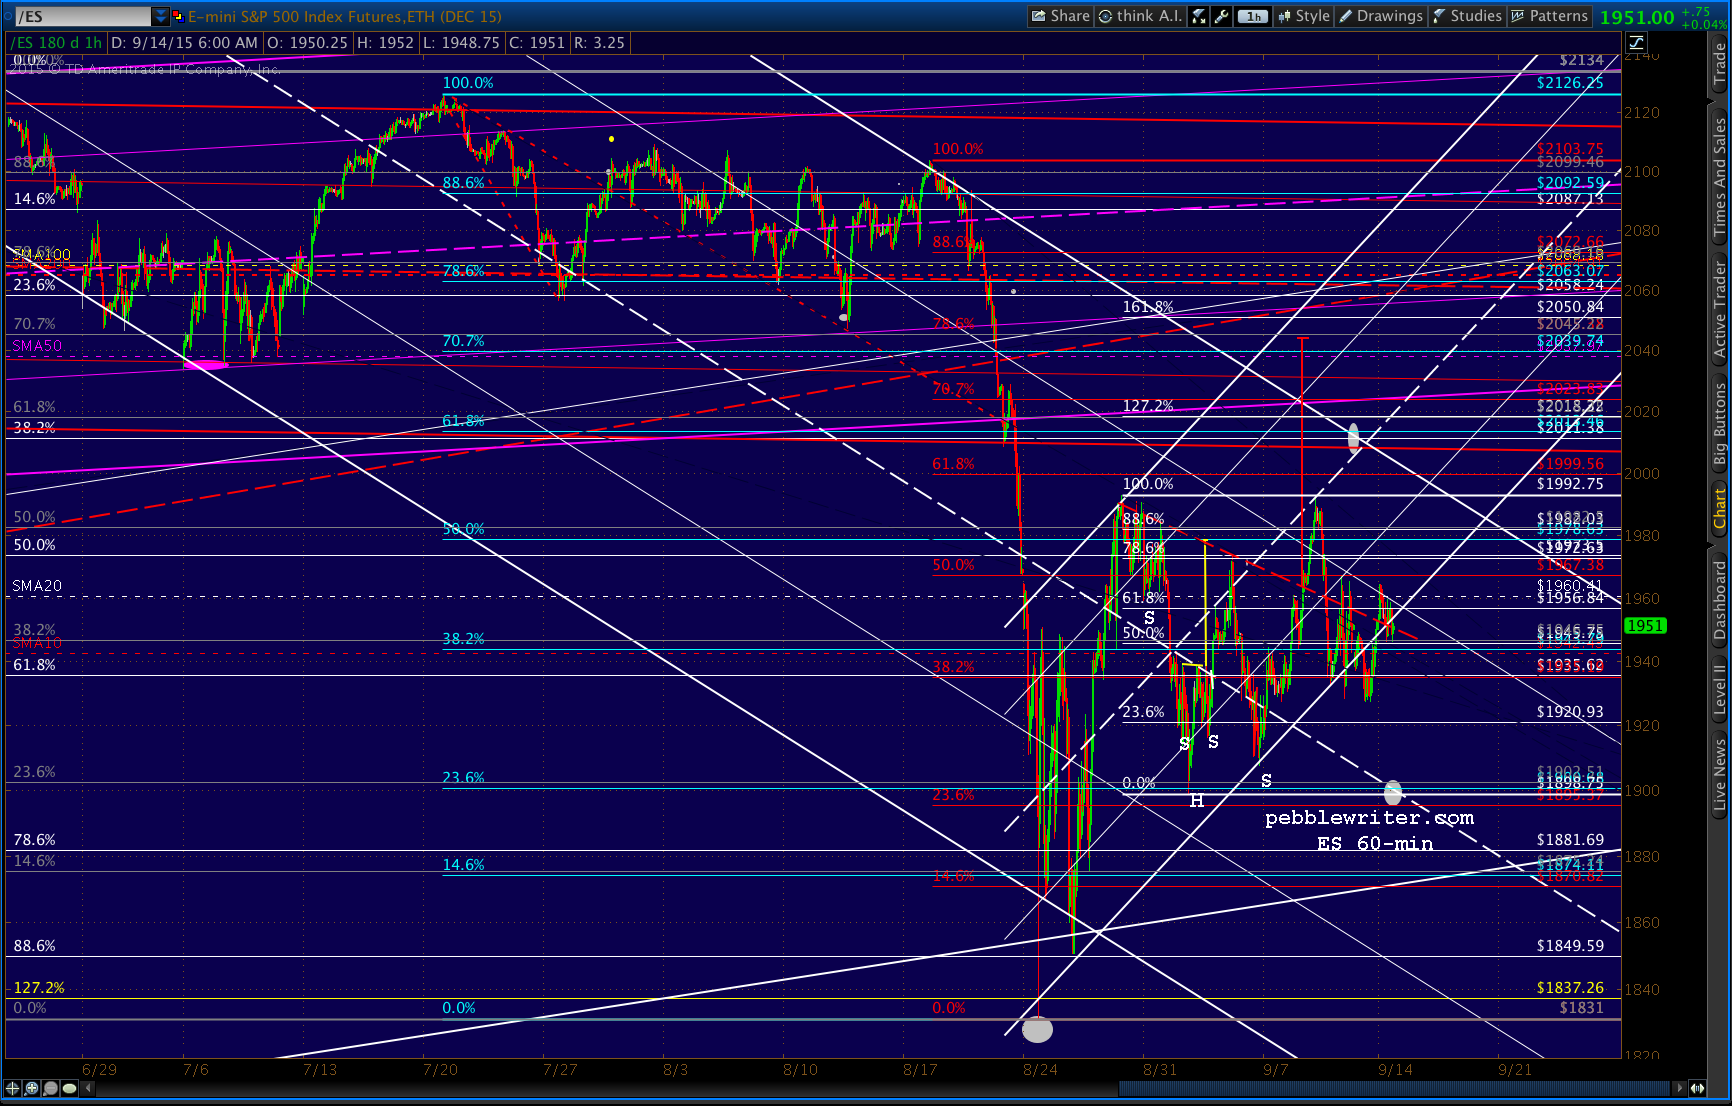 As such, I don’t see any impetus for moves in either direction today. SPX should remain in its rising channel until such time as we get announcements from either central bank — though we’ll probably continue to see intra-day dips designed to separate traders from their money.
The upside targets have been pretty well-defined for the past week or so. The ultimate goal is to break to new highs, though at this point a break out of the falling red channel would be a big enough achievement.
The 200-day moving average (solid red) is currently at 2070 and is right at the channel top and would also signify a break above the rising purple channel midline.
Should the bankers disappoint, the initial significant support is the red .786 and channel line support at 1894.07 (yellow) and the more substantial support is the original white .886 at 1856.46.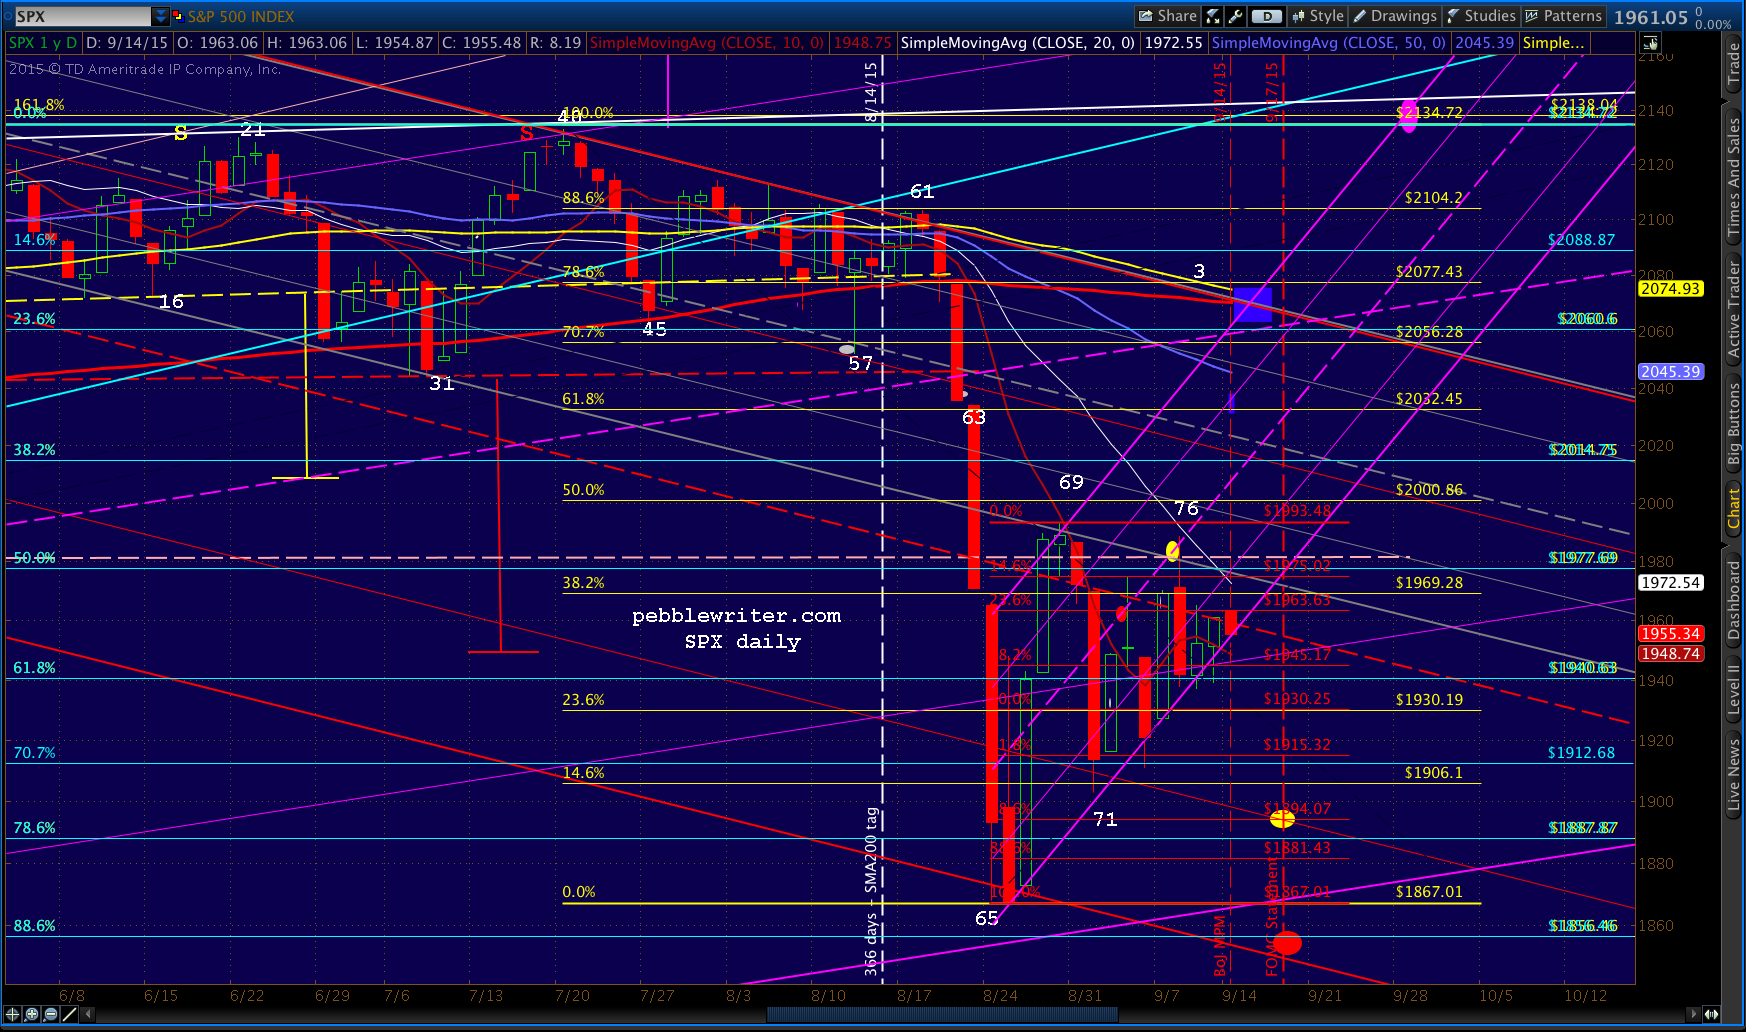 Here’s a close-up on a 60-min basis showing the tangle of Fibs that aren’t much help at present.
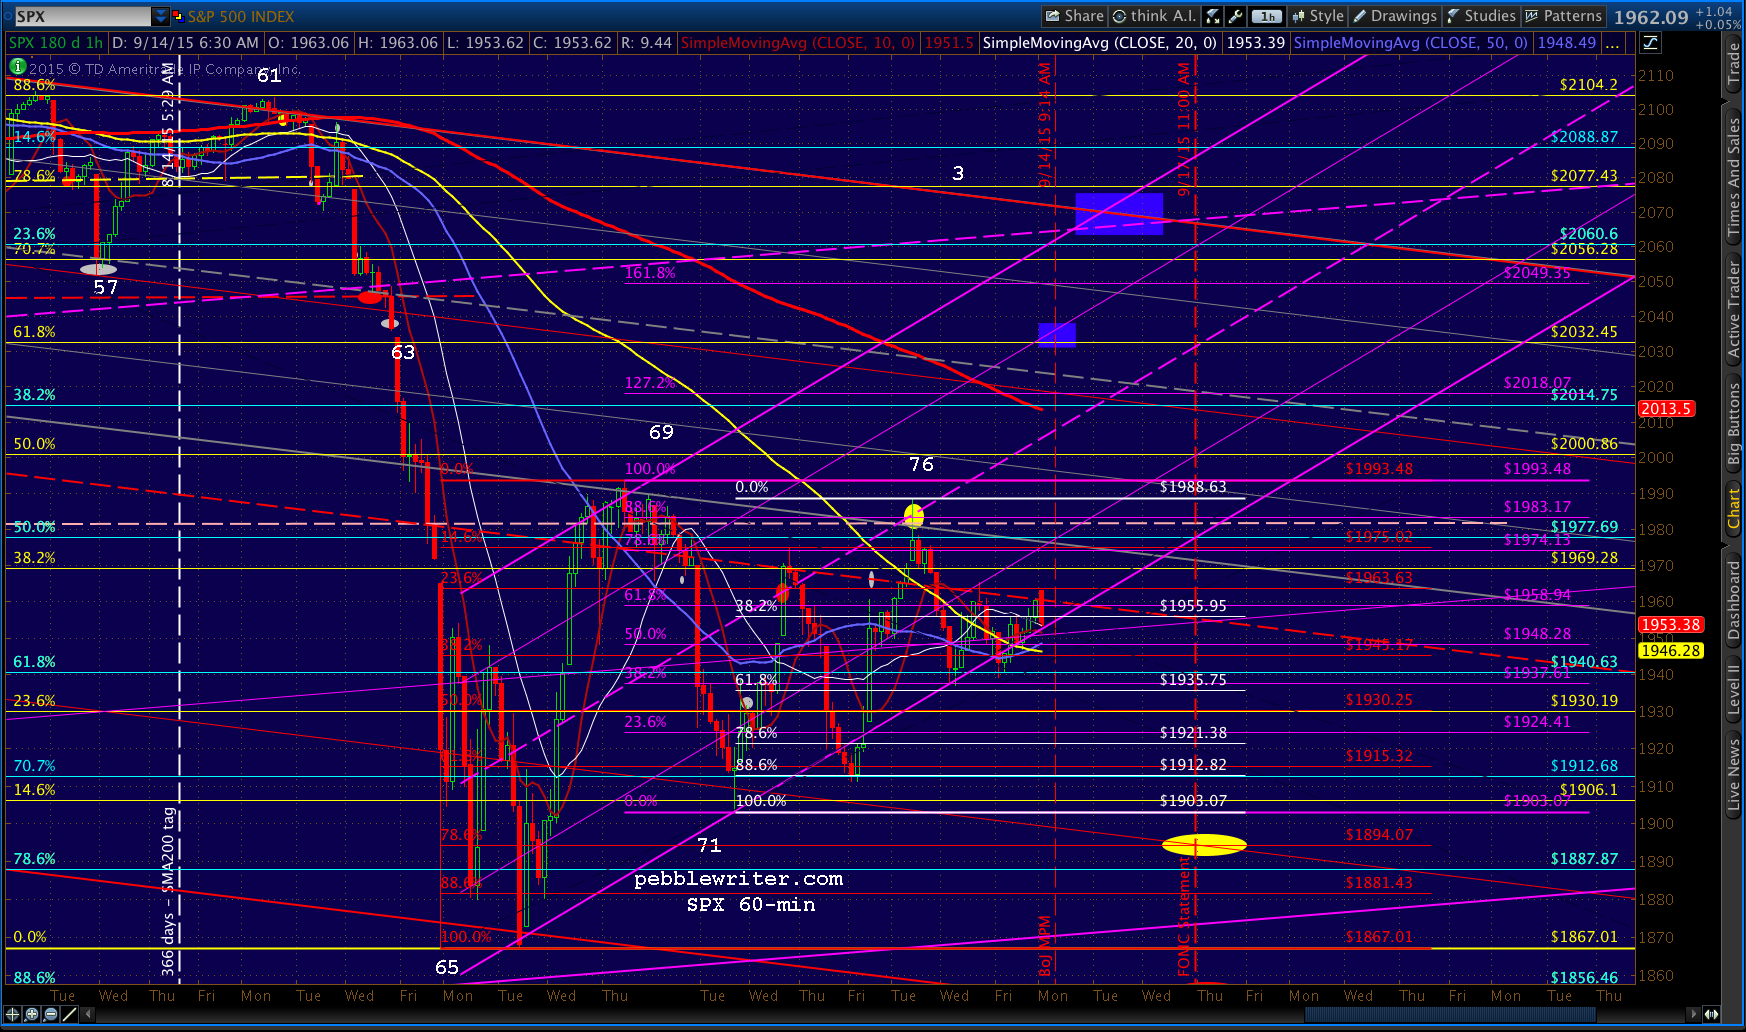 There’s definitely some selling pressure the past couple of weeks, though the indices have managed to bounce back into the channel at day’s end each time. Right now, for instance, USDJPY is at 120.09, just below the key 120.11 level. It’s enough to drop ES and SPX through their SMA10s. But, USDJPY is just as likely to pop back above 120.11 any moment.
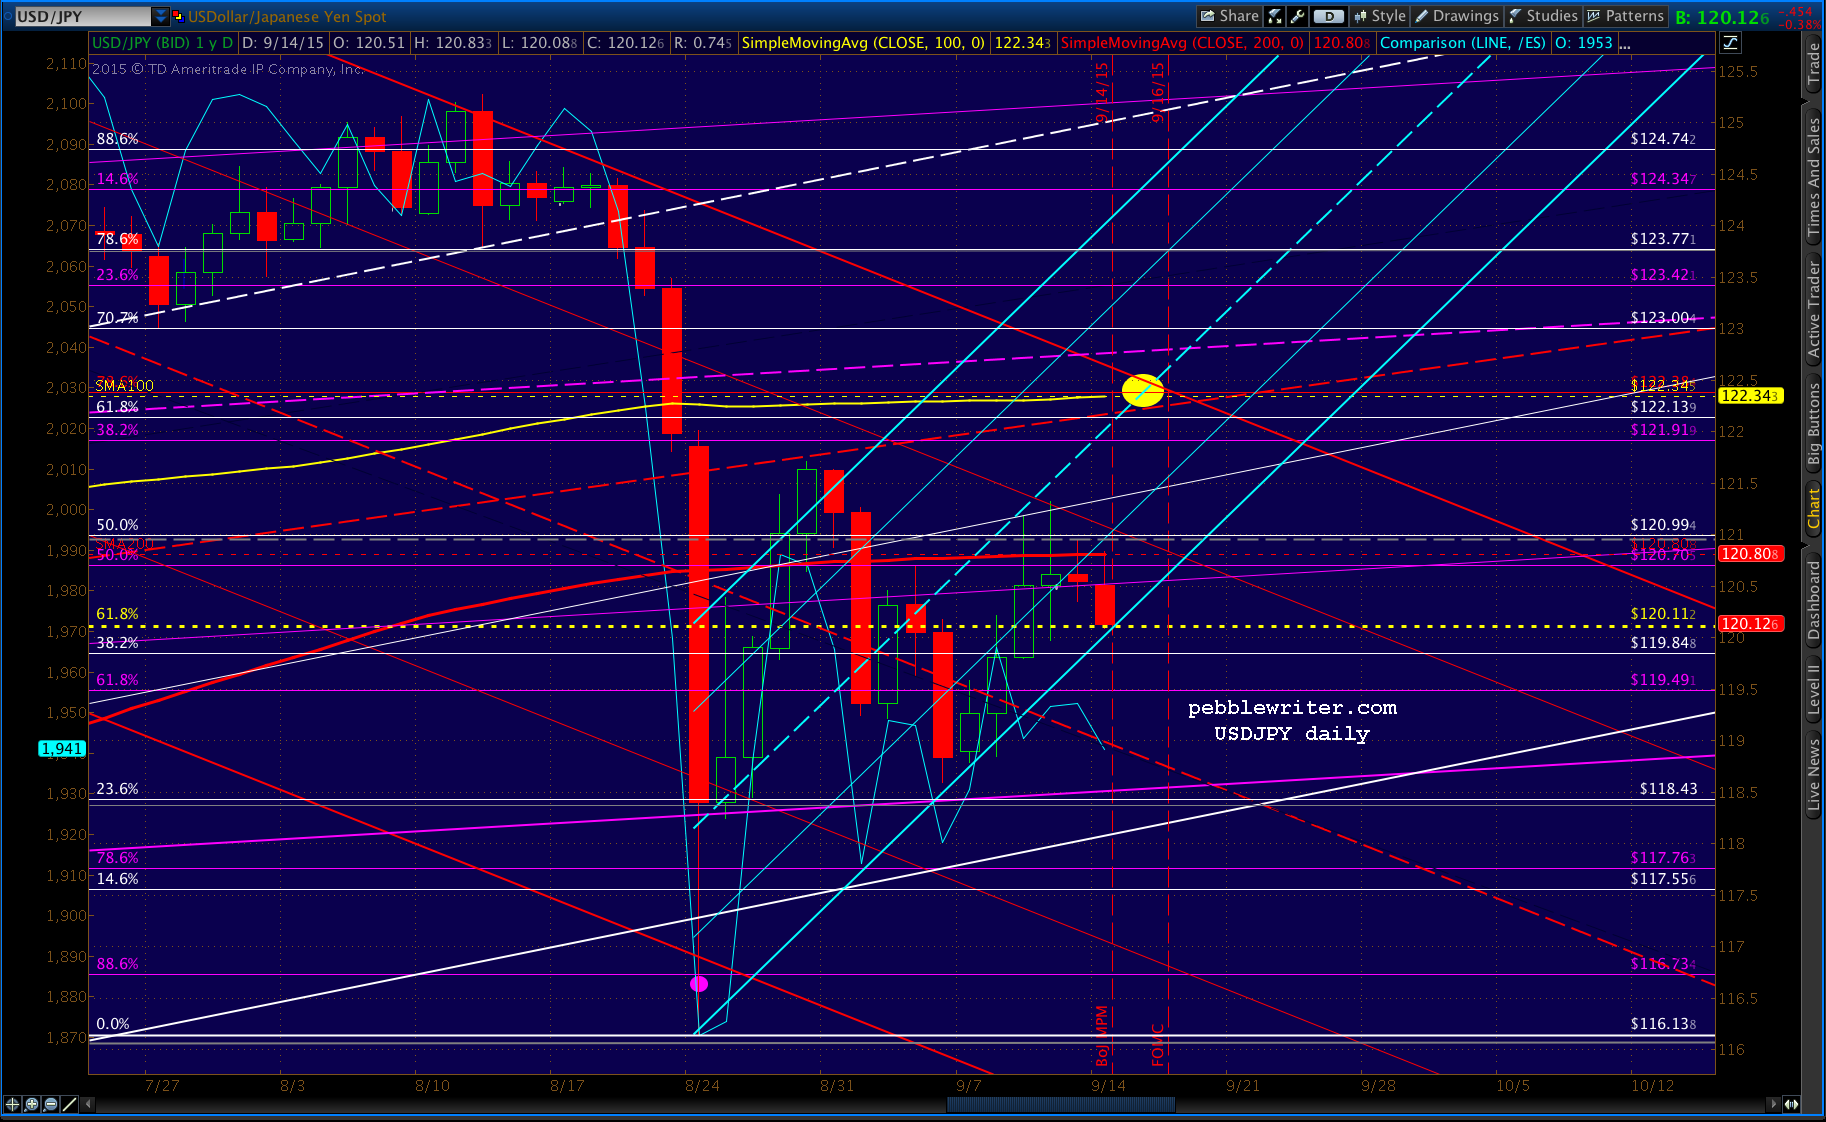 CL is contributing to weakness this morning, with a clear dip below its latest rising channel. But, again, it’s easily erased on a moment’s notice.
 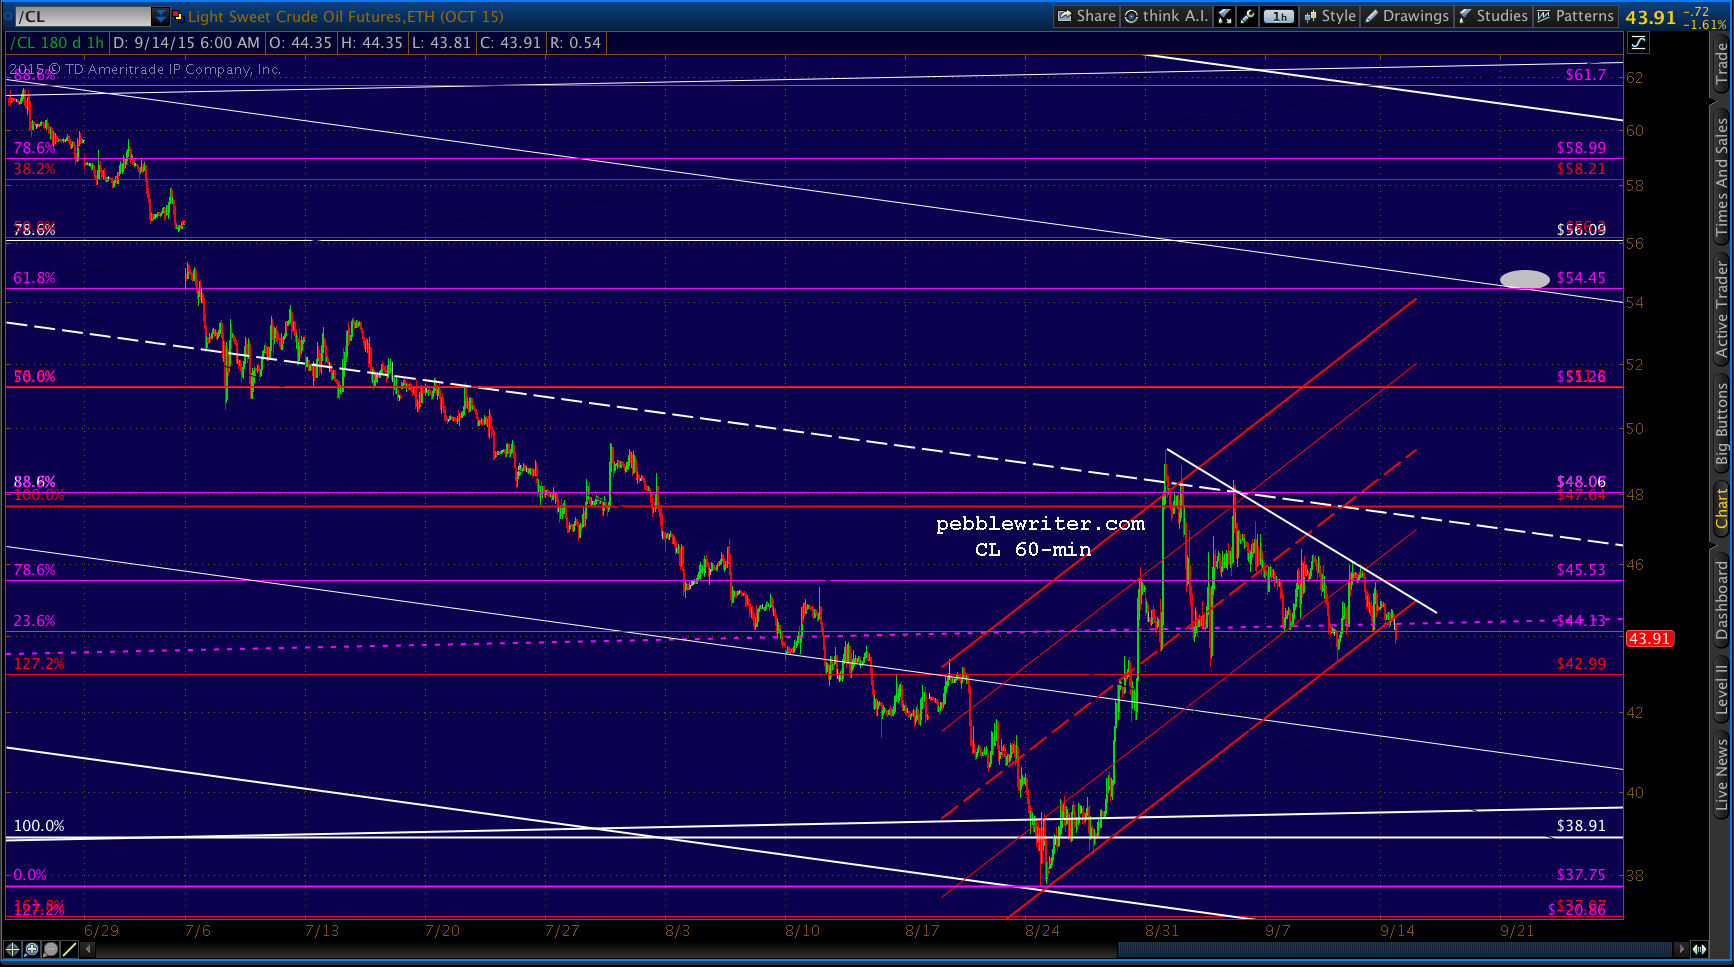 If you’re cynical in nature, you’ll look at these intra-day dips as an indication that prices are going to break sharply higher. Every dip represents a temptation for traders to pile on short positions, which would add to the big boys’ profits if/when.
If you’ve got your blinders on and are a good trend follower, you’ll look at these dips as a clear sign of weakness and building selling pressure that should be sold.
As a cynical chartist who has been beat over the head time after time during central bank announcements, I’ve learned that the head fake quotient is rarely higher. And, with the both of them hitting in the next few days, the risk is roughly doubled.
I count no fewer than 10 crosses of the ES IH&S neckline in the past couple of weeks, with both the upside and downside cases still intact. That’s on the 60-min chart; the 5-min chart would probably show 100 or more.
In short, this is an excellent time to catch up on some other chart. A very close friend of mine passed away this weekend; and, frankly, I don’t have it in me today to decipher and anticipate all the potential squiggles the HFT’s and their ilk have in mind while we wait for the real action to start.
UPDATE: 11:00 PM ET
SPX spent almost all day at 8-10 points off, closing just above its 10-day moving average (red, dashed line.) 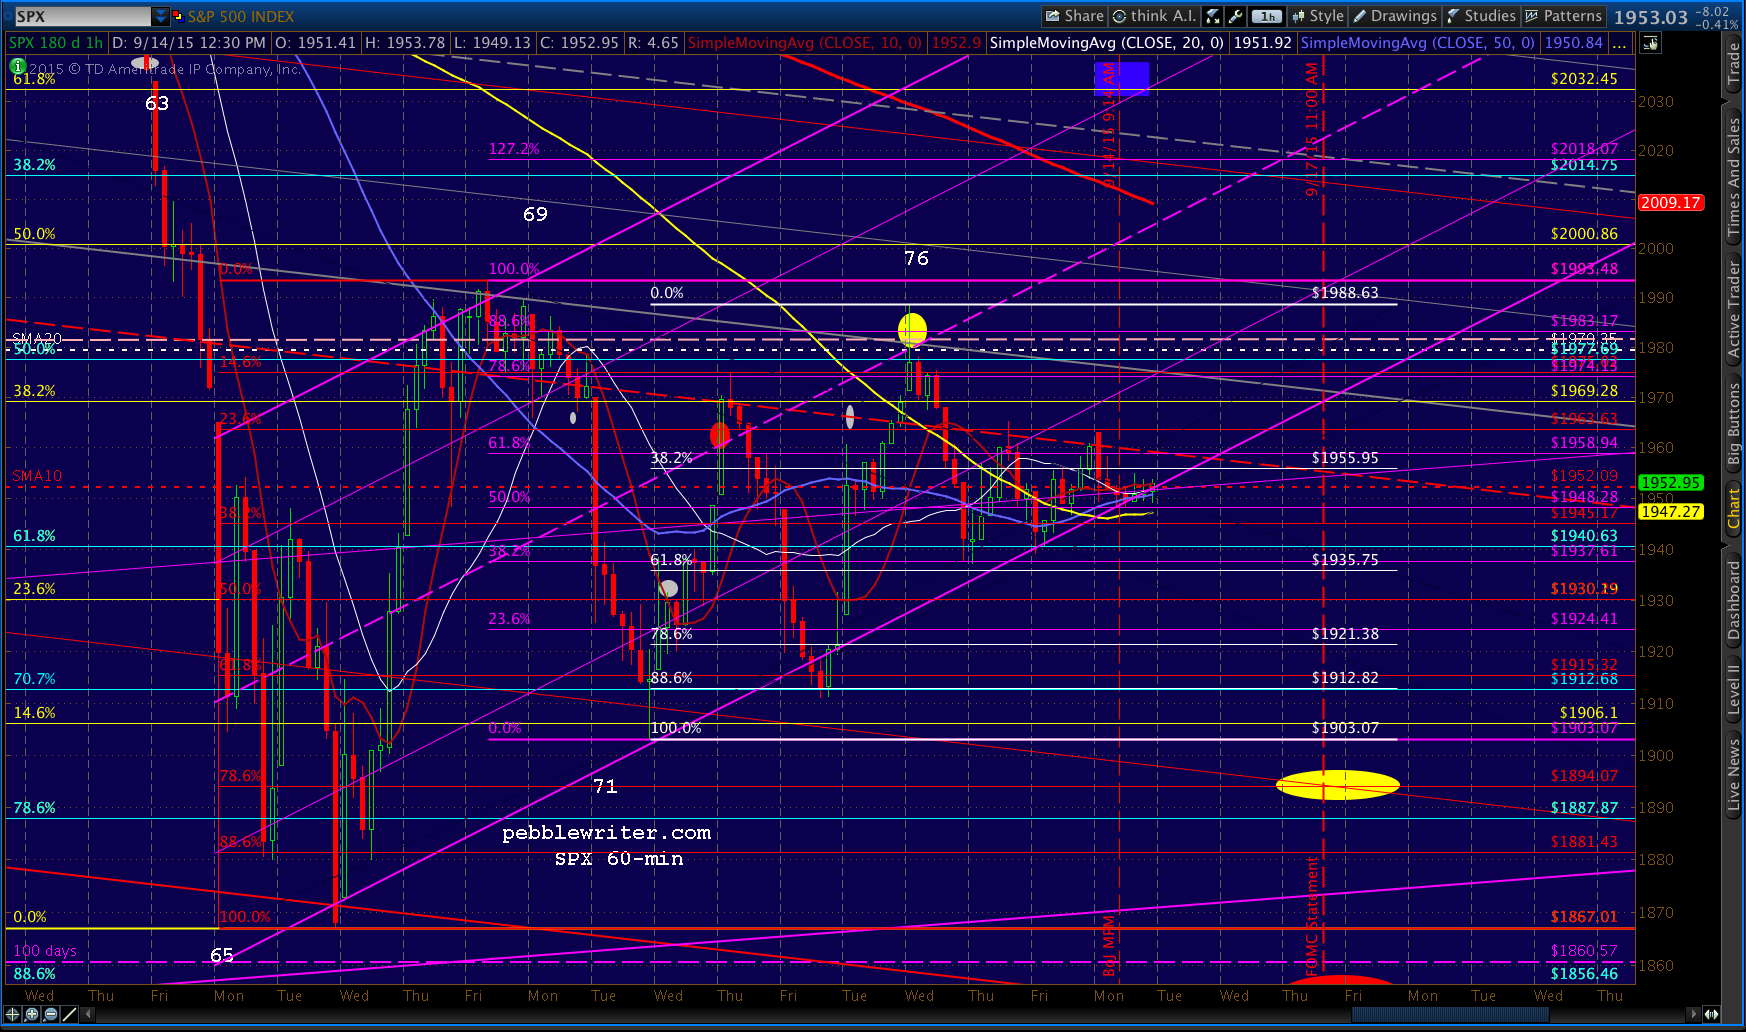 While, USDJPY tested the SMA10 then recovered from its dip below 120.11. The action since the close has been generally negative, but it’s still hanging in above 120.11. Economist surveys and most of the talk is that there will be no expansion of QQE, which is likely to disappoint.
 NKD futures aren’t looking terribly positive.
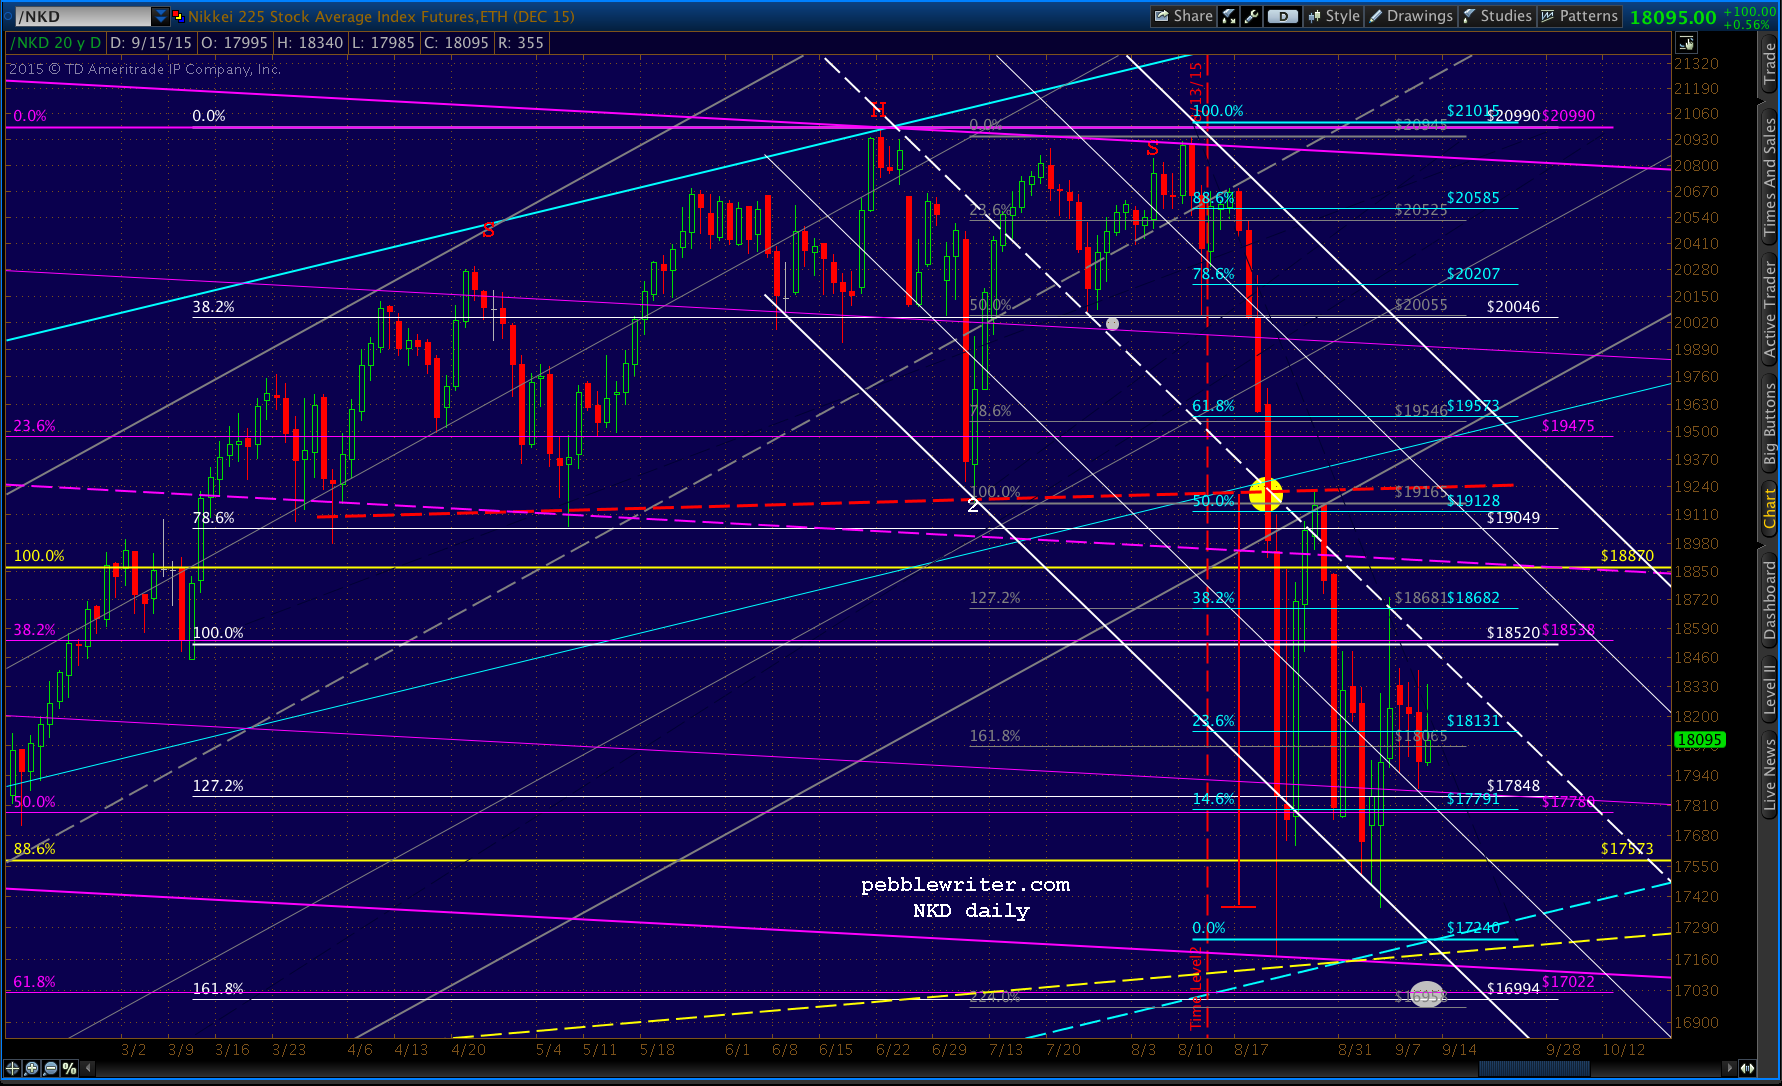 A BoJ announcement should be released at about 2:30 AM ET.
Comments
2 responses to “Charts I’m Watching: Sep 14, 2015”
Very sorry to hear of your loss Michael
Thank you, Morrie.