

In our last update on the Nikkei [see: Update on NKD, Aug 12] we slapped a target at 19,240 — a very obvious H&S Pattern neckline. At the time, it seemed imminent, as the chart from that post shows: NKD held on for another week before reaching our target. But, by then, more selling pressure had built up. When it was finally released on Aug 24, it resulted in as spectacular a decline as NKD has seen in years.
The result was a drop straight to our target… give or take 2,000 points. It’s true. NKD blew through the neckline and dropped all the way to 17,240. Total losses over those two weeks: 18%.  The bounce back was also pretty dramatic. But, so far, it has failed to break out. There’s a reason; and, there’s a reason why investors should be concerned.
continued for members…First, consider that the bounce back only ever reached the neckline (in other words, a backtest.) In addition, that bounce also constituted a backtest of the SMA200. And, last, Aug 24’s lows missed the much more logical target of 17,000.
It’s pretty clear that NKD’s price action has been as heavily manipulated influenced as any index. But, in this case, another leg lower would make perfect charting sense. It would also fit in nicely with the idea of compelling the BoJ to further expand QQE.
With the BoJ’s MPM meeting next Monday/Tuesday, the timing could be as early as tonight. Or, it could also come next Tuesday if TPTB decide to wait until after BoJ disappoints (if it does.)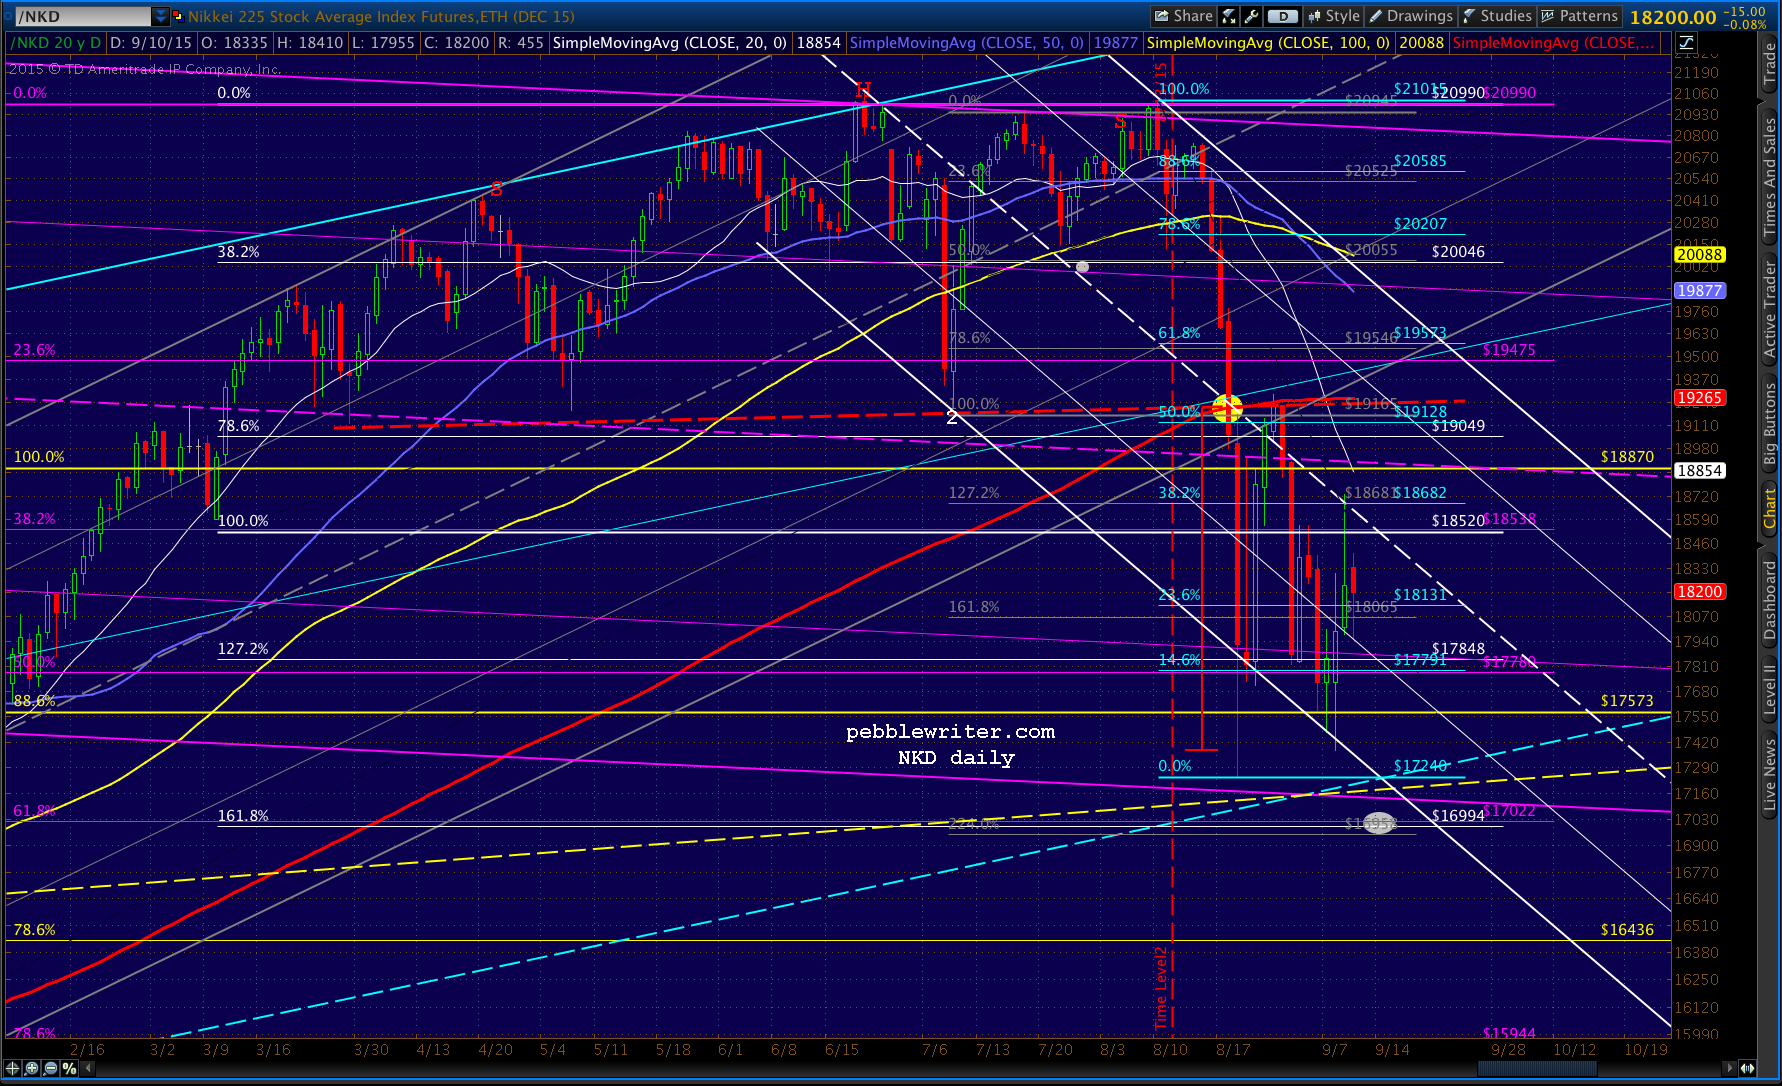 That caveat is important because the plans might already be in place, and waiting only for the meeting to make them official. In that case, another leg down would be not only unnecessary, but dangerous.
One way or the other, we’ll find out in the next week or so.