Month: January 2015

  • Charts I’m Watching: Jan 30, 2015

    Yesterday’s equity price action revolved around whether or not USDJPY would break above the purple channel top in order to test the upper bound of a triangle pattern it’s been tracing out since Jan 20.  From yesterday’s initial post:

    Note that USDJPY bounced off the lower triangle bound, and is again flirting with the channel top and a return to the [triangle] upper bound.  I believe it’ll pop out of the channel — even if it’s only intra-day — and provide a nice lift for SPX.  If it doesn’t, then the falling red channel could get SPX down to the SMA200 by late today or tomorrow.

    That’s exactly what happened.  USDJPY’s initial pullback at the channel top drove SPX to its lows of the day where it was stick-saved at a mere 1.02 above the previous low, thereby keeping the IH&S Pattern (technically) alive.

    2015-01-30-USDJPY v ES 60 0555The stick save was accomplished by a push through the channel top to the triangle upper bound referenced above, which it held long enough to drive SPX 35 points off its lows.  USDJPY held those prices through the close, at which point it fell all the way back into the channel and is testing the triangle lower bound.

    Though SPX’s initial drop was lower than we expected, the rise was along the lines of what we were looking for:

    TPTB might want to breach Tuesday’s low (2019.91) in order to screw up a potentially bearish wave count. A move by USDJPY above the triangle top could do it.  Be cautious, as the algos seem to be back in charge.

    SPX reached 2024.64 before falling back to close at 2021.  USDJPY’s fall back to the triangle bottom has driven futures down over 20 points.  A backtest of the falling white and red channels at around 2006 seems like the easy call.  Whether it holds at that point will depend on… wait for it…whether USDJPY bounces off the triangle lower bound for a 6th time.

    2015-01-30-SPX 15 0615Hopefully there’s no doubt in anyone’s mind anymore that the daily direction of the “market” is being almost completely determined by the yen carry trade.  Since the daily price action of USDJPY is almost completely manipulated by central banks and HFT algos, that means the stock “market” is also.

    The chart pattern in USDJPY makes it rather obvious.  But, as we wrote several weeks ago, it seems that TPTB don’t really care anymore just how obvious are their day to day manipulations.  Pick a price for USDJPY, peg it there, and voila! — SPX goes right where you want it.  Almost makes one yearn for the good old days of market maker manipulation.

    UPDATE:  9:50 AM

    It’s– it’s– a miracle!  You’ll never guess what happened…!

    2015-01-30-USDJPY 60 0649SPX tagged the SMA100 and bounced about 8 points so far.  In case you’re thinking “this can’t go on forever; the triangle is contracting,” you’re right.  The triangle’s apex looks to be about Feb 16.  And, the top of the purple channel passes beneath the triangle’s lower bound next Wednesday.

    But, as we saw last night, USDJPY’s rises produce more upside for SPX than its falls produce downside.  This has been the case for the past two years, and isn’t likely to change anytime soon.

    USDJPY is coming up on the purple channel top again, meaning yet another opportunity for a reversal.

    continued for members

    I believe SPX will get down to our target — or at least close to it when USDJPY reverses.  At that point, it’ll be up to the algos to see whether or not they can erase January’s negative print (-1.83%) by the end of the day.

    2015-01-30-SPX 15 0704By my calculations, we’d need somewhere around 36 points, or SPX 2051.  It would be a massive reversal off today’s lows, so probably not too likely.  But, I wouldn’t put it past them to try.  According to Deutche Bank’s Jim Reid:

    A good January has usually (but not always) been associated with a good year for US equities. Indeed using 87 years of data from Bloomberg, there have been 55 positive Januaries with 44 of those going on to have positive years with an average increase of about +20%. Of the 32 negative January months that we’ve had since 1928, ‘only’ 14 of those went on to finish the year higher in the end with average annual returns of around +14%. The remaining 18 negative Januaries were associated with a negative full year performance with an average return of around -14%. Clearly past performance doesn’t guarantee future returns and its a bit spurious but its always fun to look at. Indeed post crisis we’ve seen a few counter trend moves as three years (2014, 2010 and 2009) have seen the year bounce back from a bad January performance.

    Note that the exceptions to a bad January portending a bad year came in years with substantial QE.  Probably just a coincidence…

    Of course, if they decide to let USDJPY give up that triangle, then there’s plenty more downside — the SMA200 at 1974, for starters.  But, as we pointed out yesterday, that would mean wasting a perfectly good IH&S.

    UPDATE:  11:10 AM

    USDJPY just dipped below the triangle…

    2015-01-30-USDJPY 60 0810…meaning SPX’s bounce is fading fast.

    2015-01-30-SPX 15 0810UPDATE:  2:20 PM

    Another miraculous recovery for stocks…

    2015-01-30-SPX 60 1122…thanks to USDJPY, which was just kidding about the drop through the floor of the triangle.

    2015-01-30-USDJPY 15 1119USDJPY will need to poke through the yellow channel if SPX is to really get going.

    UPDATE:  3:55 PM

    Bit of a headfake there, but things are turning negative going into the close.  Or is the sell-off the headfake?

    2015-01-30-USDJPY 15 1255 2015-01-30-SPX 60 1255GLTA.


  • Charts I’m Watching: Jan 29, 2015

    Yesterday was another one of those days when everything just fell into place.  From the initial post:

    With the close at the SMA10 support yesterday, and a subsequent pop in the futures, the immediate trend looks to be higher…

    Continued in the members’ section:

    If SPX can hang on to the TL connecting to the 2019 lows, that TL could be considered part of a larger rising channel… If, however, prices drop below the tentative purple channel bottom, then our Gartley Pattern target at 2004 starts to look pretty good.

    The pre-opening chart (below) showed both upside and downside scenarios — courtesy of the impending FOMC announcement.  The key to which direction SPX took was the purple channel bottom mentioned above.

    2015-01-28 SPX 15 0615SPX popped at the opening, gaining 13 points to tag our upside target at 2040, then reversed dramatically in three waves to tag our 2004 target in the closing minutes (bottomed out at 2001.49.)

    2015-01-29 SPX 15 0600The only adjustment we needed to make was to move the yellow target to later in the day — thanks to the initial spike following the Fed’s proclamation that the economy is hunky dory.

    We called for a rebound at 2004, as it completes a Gartley Pattern (the white .786) as well as a Crab Pattern (the smaller, white 1.618.) and  — yet, again — tests the SMA100 and a key channel midline.

    The falling red channel has served us well on the slide from 2064.  At this point, however, SPX has to decide whether to respect the falling white channel, into which it strayed in its latest backtest.

    continued for members(more…)

  • Charts I’m Watching: Jan 28, 2015

    Yesterday was one of those days where the charting was deceptively easy (if only they all were…)  We started out with essentially the same chart as was posted last Friday. The only alteration was to add another downside target (the lowest red “S”) at the falling white channel top in order to accommodate a potential backtest of that channel.

    2015-01-27 SPX 15 0600Our gameplan for the day was pretty straightforward, a continuation of the previous day’s forecast:

    …SPX should be shorted overnight at 2053 by those with the stomach and the ability to watch/hedge such positions — a stance that’s looking fairly prescient with the e-mini’s off nearly 30 points just prior to the opening bell…SPX looks likely to nail our next downside target in its opening move.

    SPX nailed our next downside target, but the bounce was muted — only 6 1/2 points instead of a backtest of the SMA20.  As such, our next downside target came into play sooner than expected.

    Our original plan was for a deeper drop to somewhat match the left shoulder using the red neckline.  I chose a backtest of the falling white channel at 2017ish as the target.  I see this as at least a 50:50 shot…

    The backtest stopped just short of our target at 2019.  We then projected a bounce back to the SMA10 and then the SMA20 at 2041, at which point we recommended a protective stop.  SPX reached 2043, then reversed — triggering our stop and setting our sites on the SMA10 at 2029.  SPX closed at 2029.88.

    2015-01-28 SPX 0600After the close yesterday, AAPL blew the doors off most everyone’s forecast — kicking off a ramp-a-thon that saw USDJPY rally back to the channel top (yes, again) and S&P futures a whopping 24 points. 2015-01-28 USDJPY 60 0600Even though USDJPY backed off the channel top overnight, ES is clinging to a 5-6 point gain.  This leaves the chart picture muddled, which is appropriate given that we’ll have a Fed rate decision coming up at 2pm EST.  There will be no press conference, and no shocking shifts in policy are expected.  But, it still leaves the “market” in a bit of suspense.

    With the close at the SMA10 support yesterday, and a subsequent pop in the futures, the immediate trend looks to be higher.  Remember, the drop to 2019 was a backtest of a falling channel.

    continued for members(more…)

  • Update on Bonds: Jan 27, 2015

    Our last update [see: Update on Bonds Dec 5, 2014] came on the heels of a strong move higher in interest rates — from 1.68 to 2.40% in 3 weeks time.  We wrote at the time:

    Yields on the 10-yr have bounced strongly since it reached our reversal target on Monday [see: CIW Dec 1.]  Today, TNX tested both the 20- and 50-day moving averages and is probably ready for a breather, if not outright reversal.

    Dec 5, as it turned out, marked an important top for yields on the 10-yr, which dropped from 2.33 (the white arrow below) to 1.70% by mid-January.

    2015-01-27 TNX daily 1600Though yields bounced pretty nicely at that point, they couldn’t push back above the bottom of the (corrective) red channel and have since slumped lower.

    We believe yields will drop even further in the next month or so and have set a target of 1.53% by late February.

    Taking a look at the big picture, we can see the white .886 and the red 1.618 Fib levels — which are closely aligned — intersect with a falling white channel line around that time.

    2015-01-27 TNX wkly CU 1600While the confluence of chart patterns suggests a decent bounce, slumping interest rates and economies around the world could just as well portend a continuation of the falling white channel.

    2015-01-27 TNX wkly 1600If Spain and Italy can trade below 1.5%, why not the US?  From Bloomberg:

    Screen Shot 2015-01-27 at 5.31.54 PMOne last thought…while yields and SPX were moving opposite one another earlier in the year, they snapped back in sync between mid-November and year’s-end.  Since then, they’ve diverged again — with yields trending much lower while stocks managed a volatile holding pattern.

    But, the divergence is actually much, much greater than that.  As we’ve pointed out many times, big declines in interest rates have been highly correlated with big declines in stocks over the past 10 years.

    2015-01-27 TNX vs SPX wklyThe last four declines in TNX are highlighted above.  Note the percentage decline in SPX during each period: -52%, -15%, -20% and -10%.

    The decline which began in January 2014 has lasted longer than any since the financial crisis.  And, it’s about the same degree as the average of the past three.

    Yet, it’s the only one accompanied by an increase in SPX — a whopping 14% increase, at that.  It does make one wonder what would happen to stocks if central banks ever stopped propping them up.


  • Charts I’m Watching: Jan 27, 2015

    Yesterday’s forecast worked out nicely.  Recall that this was the same scenario first laid out last Friday.

    As such, I see no reason to adjust Friday morning’s chart/forecast: a test of the SMA20/50 — and a potential IH&S right shoulder if those don’t hold.

    After SPX reached our initial downside target, we called for a bounce that was only slightly more exuberant than anticipated.  Watching USDJPY, we noted:

    It’s now threatening a breakout for the fifth time since early January.  I suspect this one will also run out of juice, leaving SPX to backtest the rising white channel at around 2053 before heading further south.

    2015-01-27 SPX 15 0600SPX bounced off the SMA20 at 2040 up to 2055, then hung around while USDJPY teased us with the idea of a breakout — a breakout that failed yet again last night.

    2015-01-27 USDJPY 60 0600Our closing note to members was that SPX should be shorted overnight at 2053 by those with the stomach and the ability to watch/hedge such positions — a stance that’s looking fairly prescient with the e-mini’s off nearly 30 points just prior to the opening bell.

    SPX is at our target of 2053.  I’d short here with tight stops — but would strongly recommend cash overnight for those who can’t hedge or watch their position like a hawk overnight.

    SPX looks likely to nail our next downside target in its opening move.  We’ll update the charts shortly.

    continued for members(more…)

  • Charts I’m Watching: Jan 26, 2015

    Last Friday’s pre-opening forecast worked out very nicely.  I just drew it backwards.

    Initial support can be found at the white .618 at 2053.29 and the rising white TL off the Oct 15 lows.  After that, the SMA20/50.  And, in the event it pushes lower, a backtest of the falling white channel (the red S.)

    I thought the initial drop would tag the white TL from mid-October, and the close would be at the .618 at 2053.29.  It worked the other way around.

    2015-01-26 0126-0600Futures were off 37 points in the wake of the Greek elections, but have recovered virtually all of those losses in the usual overnight USDJPY-driven ramp job.

    2015-01-26-USDJPY 4 0635Another factor weighing on equities: oil.  Crude light tested its previous lows late Friday.  Though it bounced on OPEC General Secretary El-Badri’s comments, it’s still looking rather wobbly.

    2015-01-26-CL 60 0625As such, I see no reason to adjust Friday morning’s chart/forecast: a test of the SMA20/50 — and a potential IH&S right shoulder if those don’t hold.

    UPDATE:  10:40 AM

    So far, so good on this morning’s forecast.

    2015-01-26-SPX 15 0739For those wondering whether or not the lower target will play out…it’s hard to say.  Tell me whether or not USDJPY will break out of its falling channel that goes back to Dec 7.

    It’s had three stick saves (on Jan 21, 22 and 25) that also propped up SPX (ES shown below for charting purposes.)

    2015-01-26-USDJPY v ES 0739continued for members(more…)

  • Gold Recovers its Luster

    When we last reviewed gold in November, it had dipped below an important level of support.

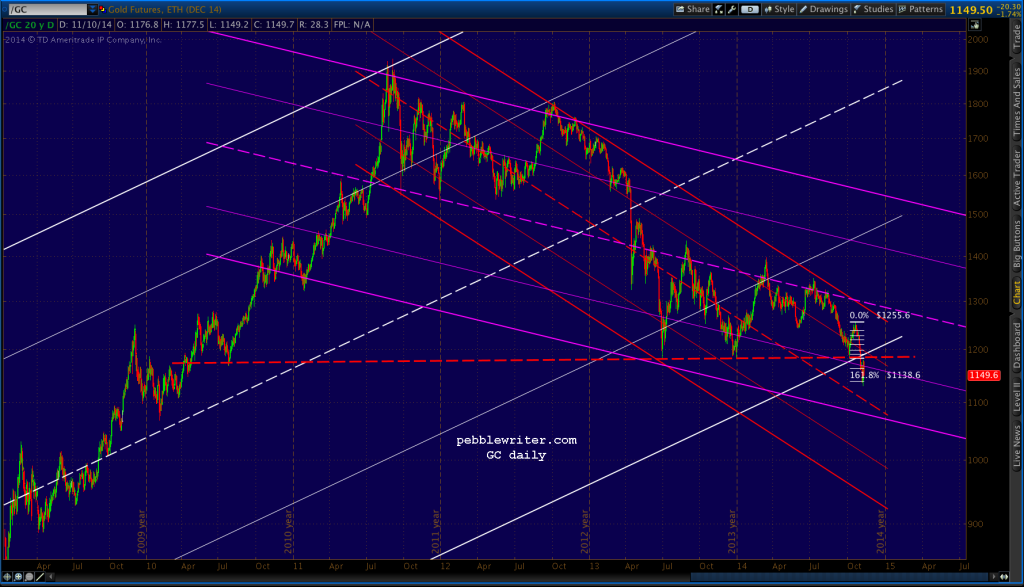
    2014-11-10-GC daily 1200

    As we noted back then:

    …a failure to retake the broken TL would indicate lower prices to come. [The channel placement] is tricky.  In this case, I’ll give more credence to the upside if/when the red trend line of support (now resistance) is breached.

    Wouldn’t you know…gold popped back above that red TL and is currently going strong.  As noted before, I wouldn’t put too much credence in the placement of a very long-term channel like the white one below.  But, the TL is clear.  And, as long as prices stay north of 1180 or so, all is good.

    2015-01-23 GC wkly 1300If they don’t, the close-up shows the strong case that could be made for a drop to the yellow .500 Fib at 1089.40.  But, of course, that would require the trend line and previous lows (1140ish) to break down again.

    2015-01-23 GC wkly CU 1300Bottom line, the argument is for a reversal here at the white .500 at 1302.  It also represents a backtest of the yellow .382, the midline of the purple channel and the top of the iffy red channel.

    GLTA.


  • Update on EURUSD: Jan 23, 2015

    In last month’s update [see: Update on EURUSD Dec, 3, 2014] we noted that it was approaching an important level of support: the purple .886 that intersected with a trend line connecting the previous three lows.  It was the perfect setup for a bounce if Draghi and friends didn’t come through with the massive quantitative easing they’d been threatening for the past couple of years.

    2014-12-03 EURUSD monthlyWe put a target on the white .618 Fib level just in case they finally did it.  As everyone knows by now, they did it [see, well: They Did It.]

    Guess where EURUSD ended up?

    2015-01-23 EURUSD wkly 1000For the promise of $1.1 trillion or so in bond purchases, the ECB succeeded in driving the pair right to our downside target — which it tagged today…and, then bounced.

    For anyone trying to relate the move to stocks, the picture is less than crystal clear.  While there has been a strong correlation between SPX (below, in purple) and the euro, that correlation broke down in May 2014, when stocks soared higher in lock step with USDJPY.

    2015-01-23 EURUSD daily 1050We should consider two key questions:

    (1)  could EURUSD bounce significantly here, in the wake of the QE announcement?
    (2)  what are the ramifications for stocks?

    continued for members(more…)

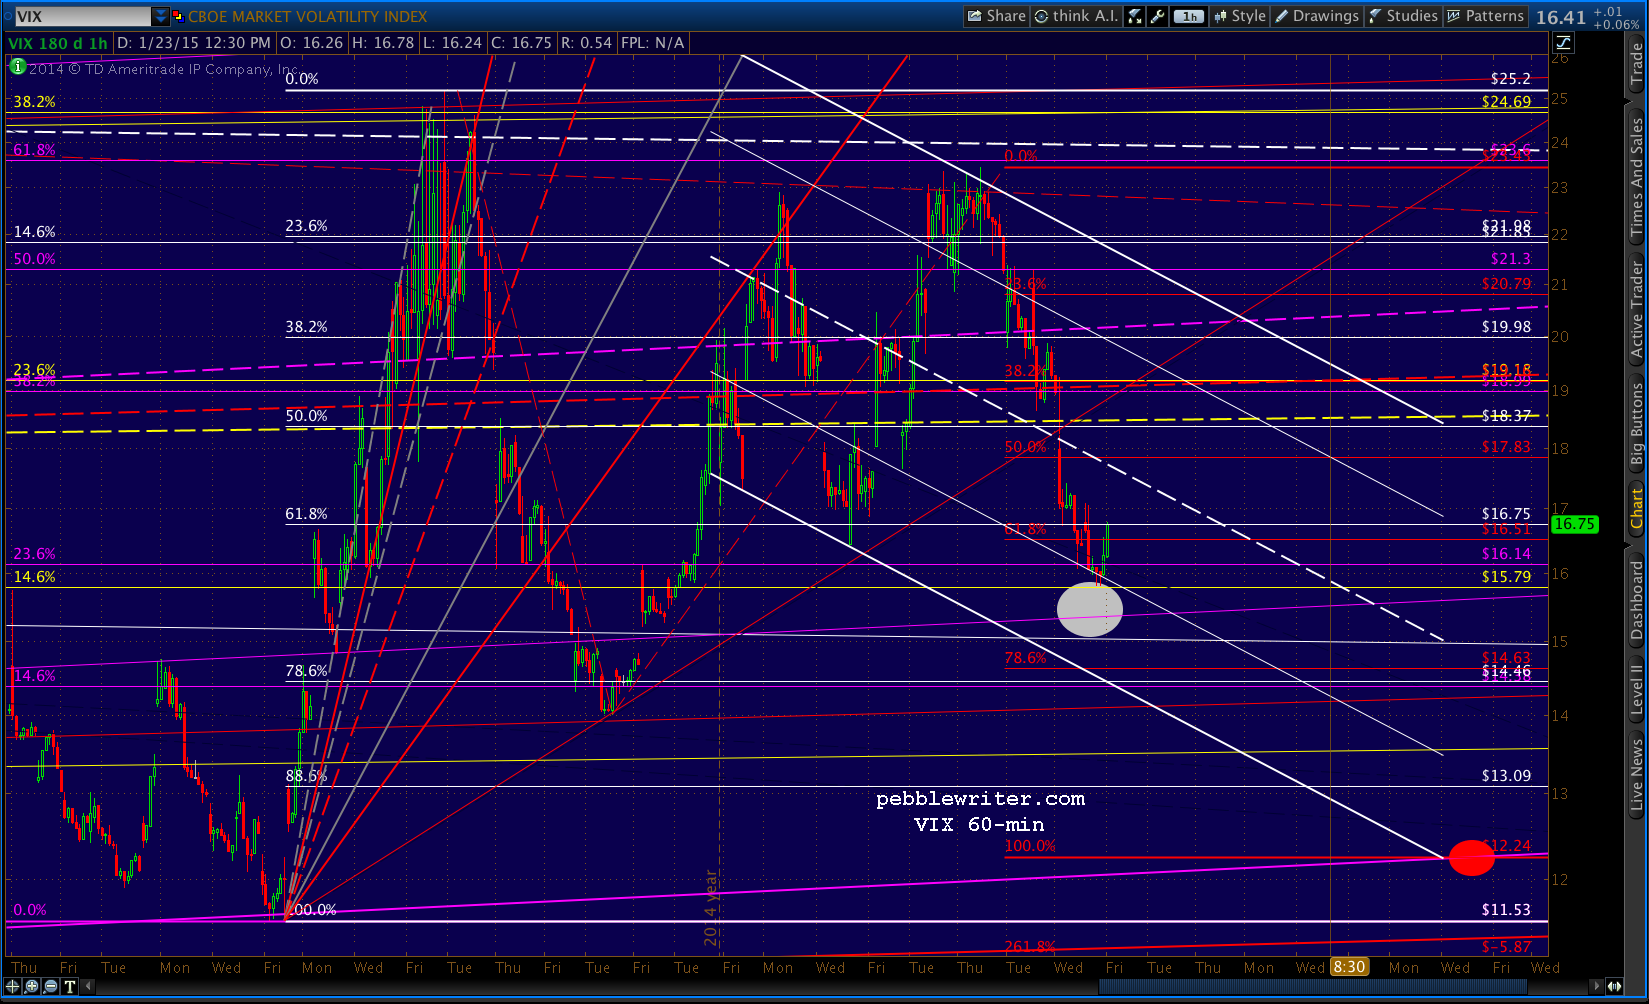
  • Update on VIX: Jan 23, 2015

    In last month’s update on VIX, we noted it had fallen below and backtested the rising purple channel bottom.

    Should the backtest hold, the message is that stocks have fallen as far as they need to.  VIX will settle lower in order to prevent things from getting out of hand.  But, remember, we’re expecting a fair amount of chop through year-end.  So, don’t be surprised if VIX vacillates around this [level] for days or weeks to come in order to set the stage for stocks’ next push.

    The backtest was, itself, a head fake.  VIX dropped for exactly one more day before shooting back up through the channel bottom as SPX logged a 100-pt decline through mid-December.

    2015-01-23 VIX daily 0700From there, it was a very wild ride as SPX regained all the losses (and, then some) before shedding 105 points through mid-January.

    In my opinion, VIX has lost much of its predictive ability.  It is frequently manipulated by the Fed’s proxies — not to mention other central banks and hedge funds — in order to prop up stocks (particularly at the end of the trading day.)

    So, instead of a valid barometer of the level of fear in the markets, it has become more an indicator of when TPTB are stepping in to prevent any further declines.  When things get out of hand — as they seemed to in early October, early December and early January — a monkey-hammering of VIX is just the thing to help “markets” recover.  Note the falling white TL connecting the tops of Oct 15, Dec 16 and Jan 16.

    Nevertheless, it might provide some clues to the script which guides the day-to-day moves.  Following a general downtrend from its highs of Oct 2008, VIX spent the couple of years going sideways.

    The spike in mid-October reached 31.06, which was roughly a .236 retracement (white grid) of the drop from 89.53 in 2008 to 10.28 this past year, and a .500 retracement of the drop from Aug 2011 (yellow grid.) Note the general uptrend since then as depicted by the revised purple channel.

    2015-01-23 VIX weekly 0700In the world of harmonics, we might put a pin in that yellow .500 tag and speculate about a potential Bat Pattern leading to the yellow .886 at 43.70.  Note that it’s closely aligned with the purple 1.618 at 43.13.  And, that price level is roughly equal to the previous peaks of the past five years: 48.20 in May 2010 and 48 in Aug 2011.

    If the rising purple channel is valid, it wouldn’t happen until July or so, and would slightly violate the .786 falling white channel line.  It would also represent an official breakout of the falling wedge from 2009 (the red, dashed TL and white channel bottom as upper and lower bounds respectively.)

    In order to get there, though, VIX would need to rebound at the white channel’s .236 line (currently around 15) and the purple channel would need to hold.  Note that the purple .236 has been tagged already, and the yellow .146 is just below, intersecting with the rising purple channel .236 line (the white dot.)

    Again, TPTB know these spots, too (or, at least should) and might well have special plans to smash VIX lower at that point. The purple channel has already tilted to a lesser slope once.  They could be angling for something like the red channel or yellow channel sketched in below.

    2015-01-23 VIX weekly 0800And, the decline from 25.2 on Dec 16 doesn’t look complete from a wave or harmonic standpoint.  A decline to the white .886 at 13.09 or even the purple channel bottom at 12ish would make all the sense in the world in the short run.

    If, on the other hand, VIX reverses around 15, our next upside target is the purple .886 at 29.  The chart below depicts the new purple channel as well as the targets mentioned above.

    2015-01-23 VIX daily 0800GLTA.


  • Charts I’m Watching: Jan 23, 2015

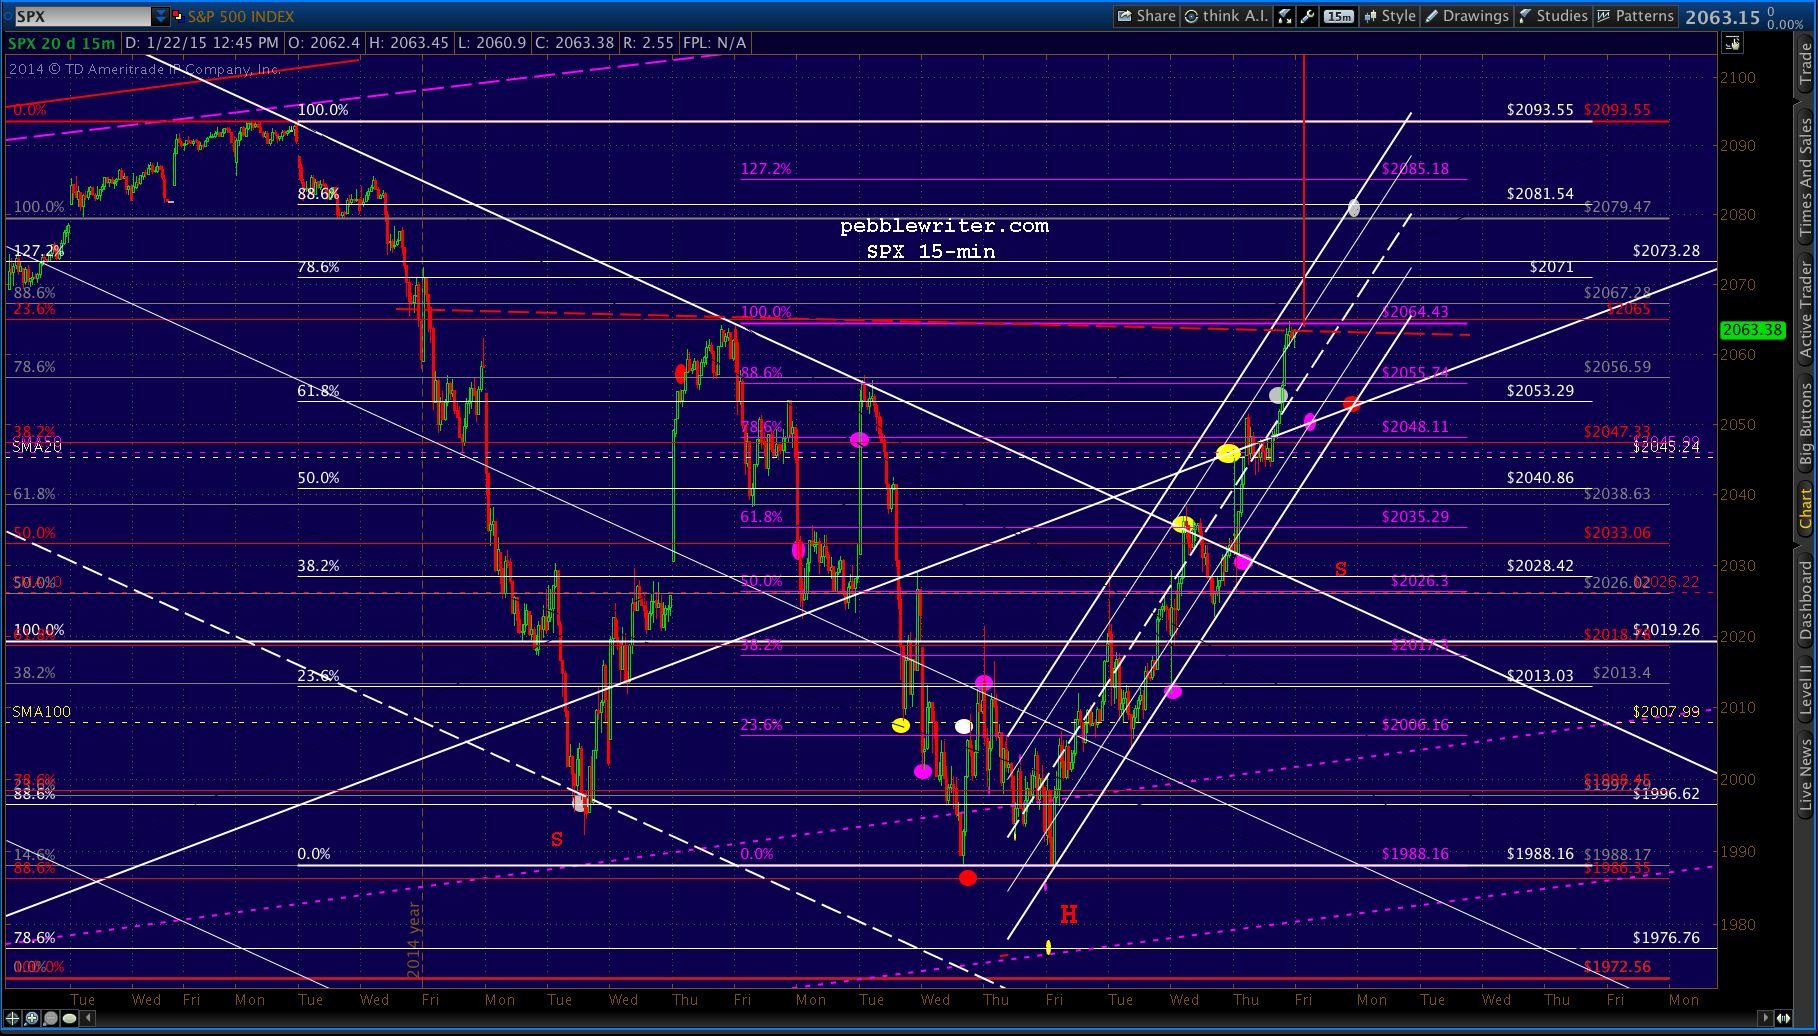
    Yesterday’s ECB QE lift-a-thon saw SPX perform pretty much as expected.  SPX reached the midpoint of the target we set Tuesday (2042-2047), then reversed to the bottom of the rising white channel as we detailed in our initial post:

    Look for SPX to back off from the SMAs and backtest the broken white channel, possibly around 2030.  TPTB should support it there.

    SPX reversed from 2045 to 2026 before the support kicked in, sending it back up through the SMA20 and 50 and through our initial upside target of the day at 2053.

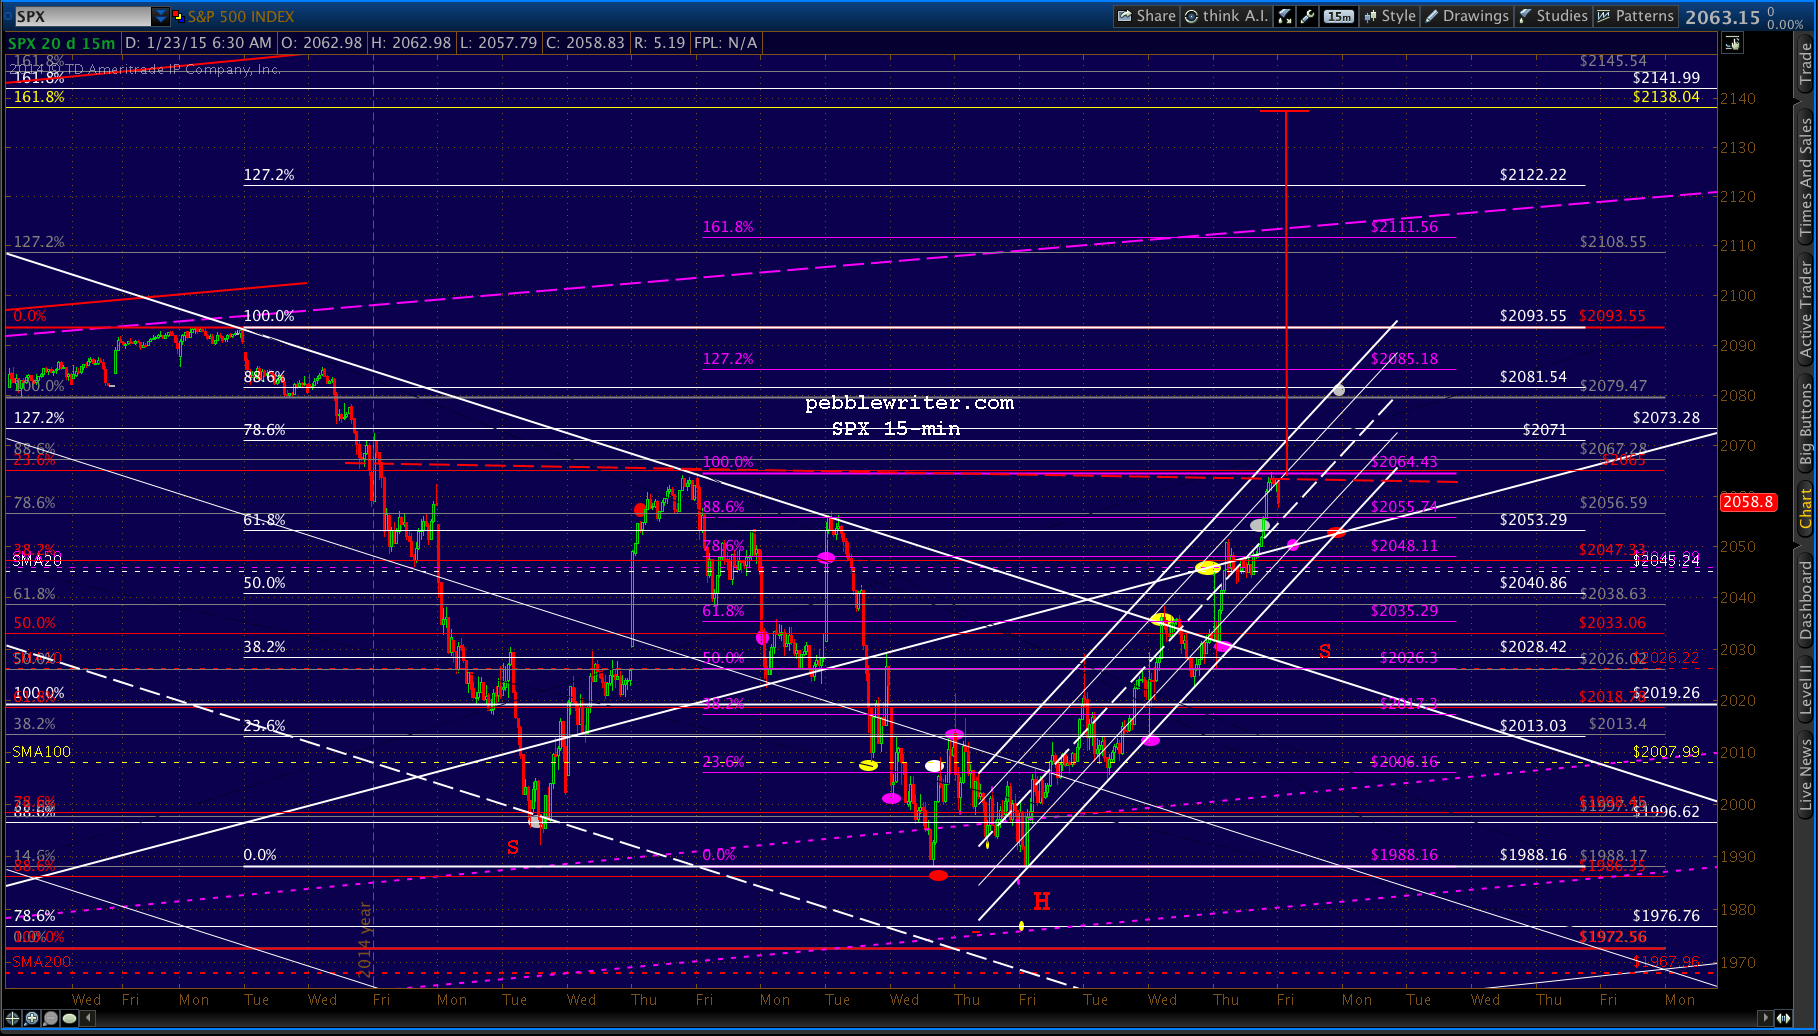
    2015-01-23 SPX 15 0622At 2055, we were fine with the idea of taking profits (53 points based on the above calls.)  But, the algos weren’t done.  At 2063, we thought it was probably a good shorting opportunity.

    Based on the price action in S&P futures, a drop in oil, and a probable reversal in DX, EURUSD, USDJPY and VIX, we should see at least a partial retrenchment of yesterday’s gains.

    Initial support can be found at the white .618 at 2053.29 and the rising white TL off the Oct 15 lows.  After that, the SMA20/50.  And, in the event it pushes lower, a backtest of the falling white channel (the red S.) 2015-01-23 SPX 15 0632We’ll update the other charts shortly.

    UPDATE:  3:45 PM

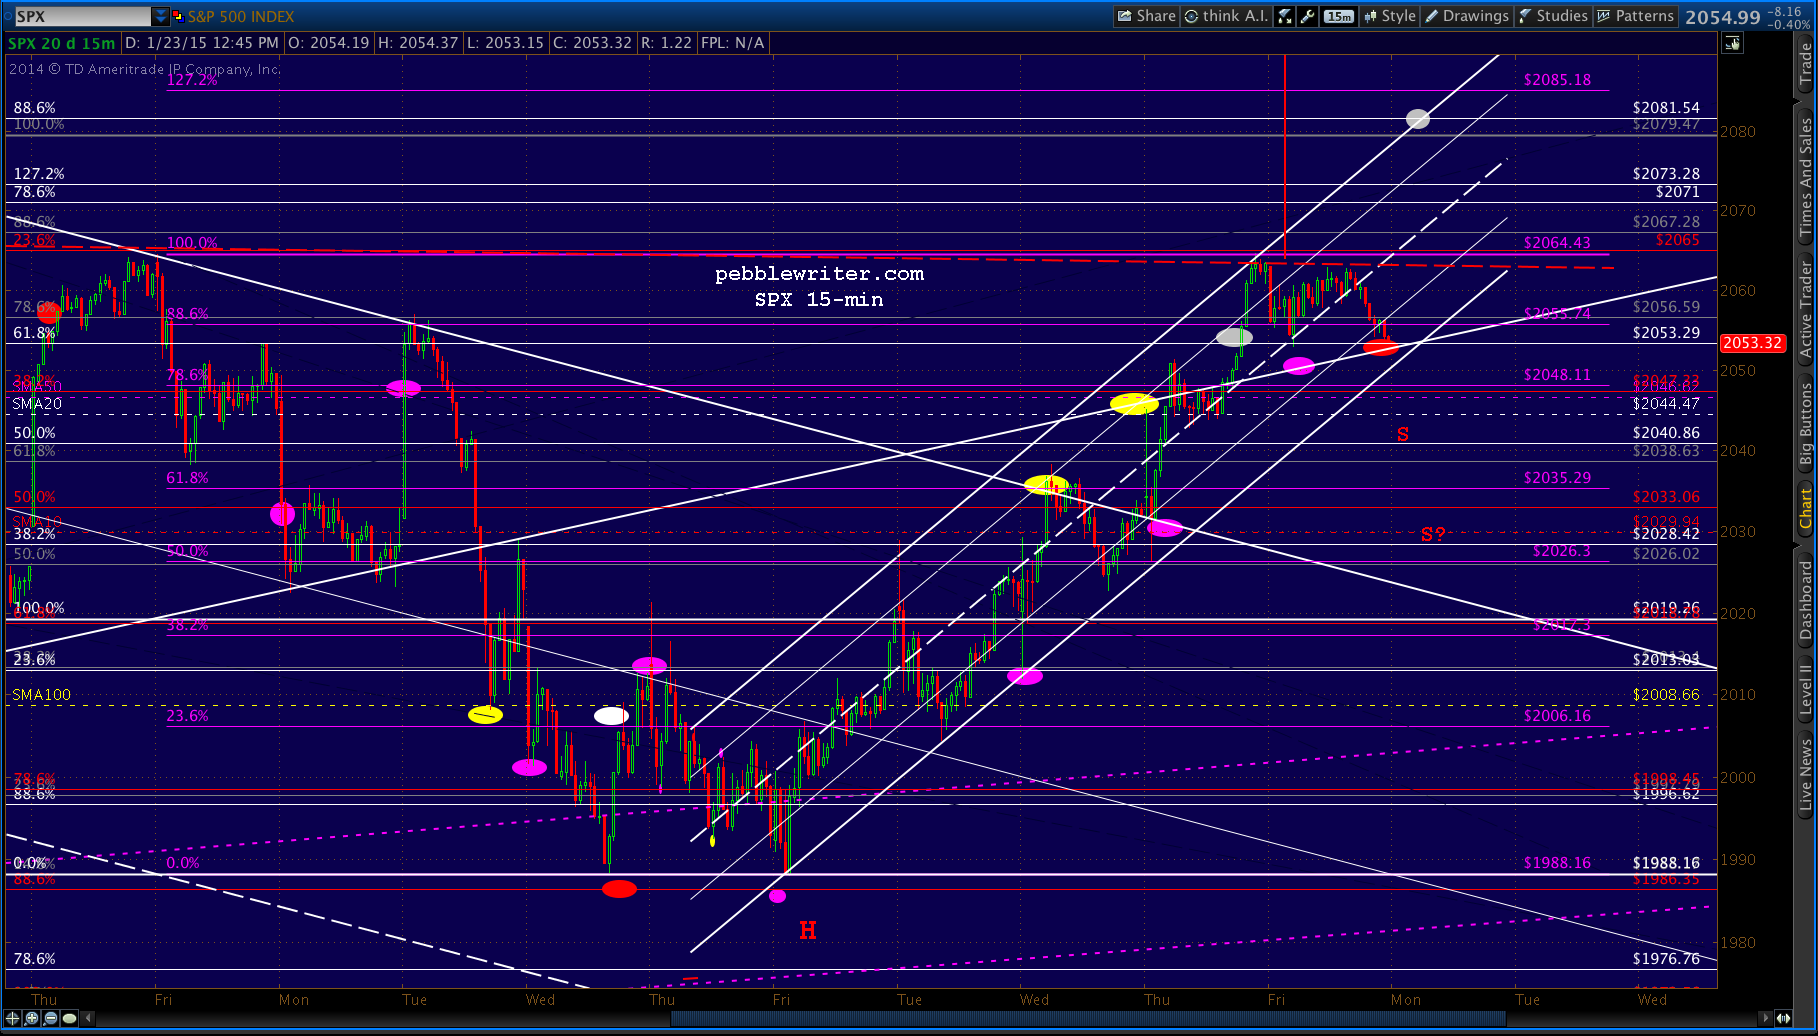
    Not too shabby….

    2015-01-23 SPX 15 1247

    Tough call going into the weekend.  Even if SPX stops at the rising white channel bottom, it doesn’t mean a continuation of the rise on Monday.

    Please note we’ve updated the EURUSD and VIX pages.  The EURUSD in particular holds some interesting implications for the stock market.  VIX tagged our downside target on the nose, bouncing exactly where it needed to in order to get this sell-off in SPX to our downside target.

    2015-01-23 VIX 60 1255We’ll update more over the next day or two.  Have a great weekend, everyone!