

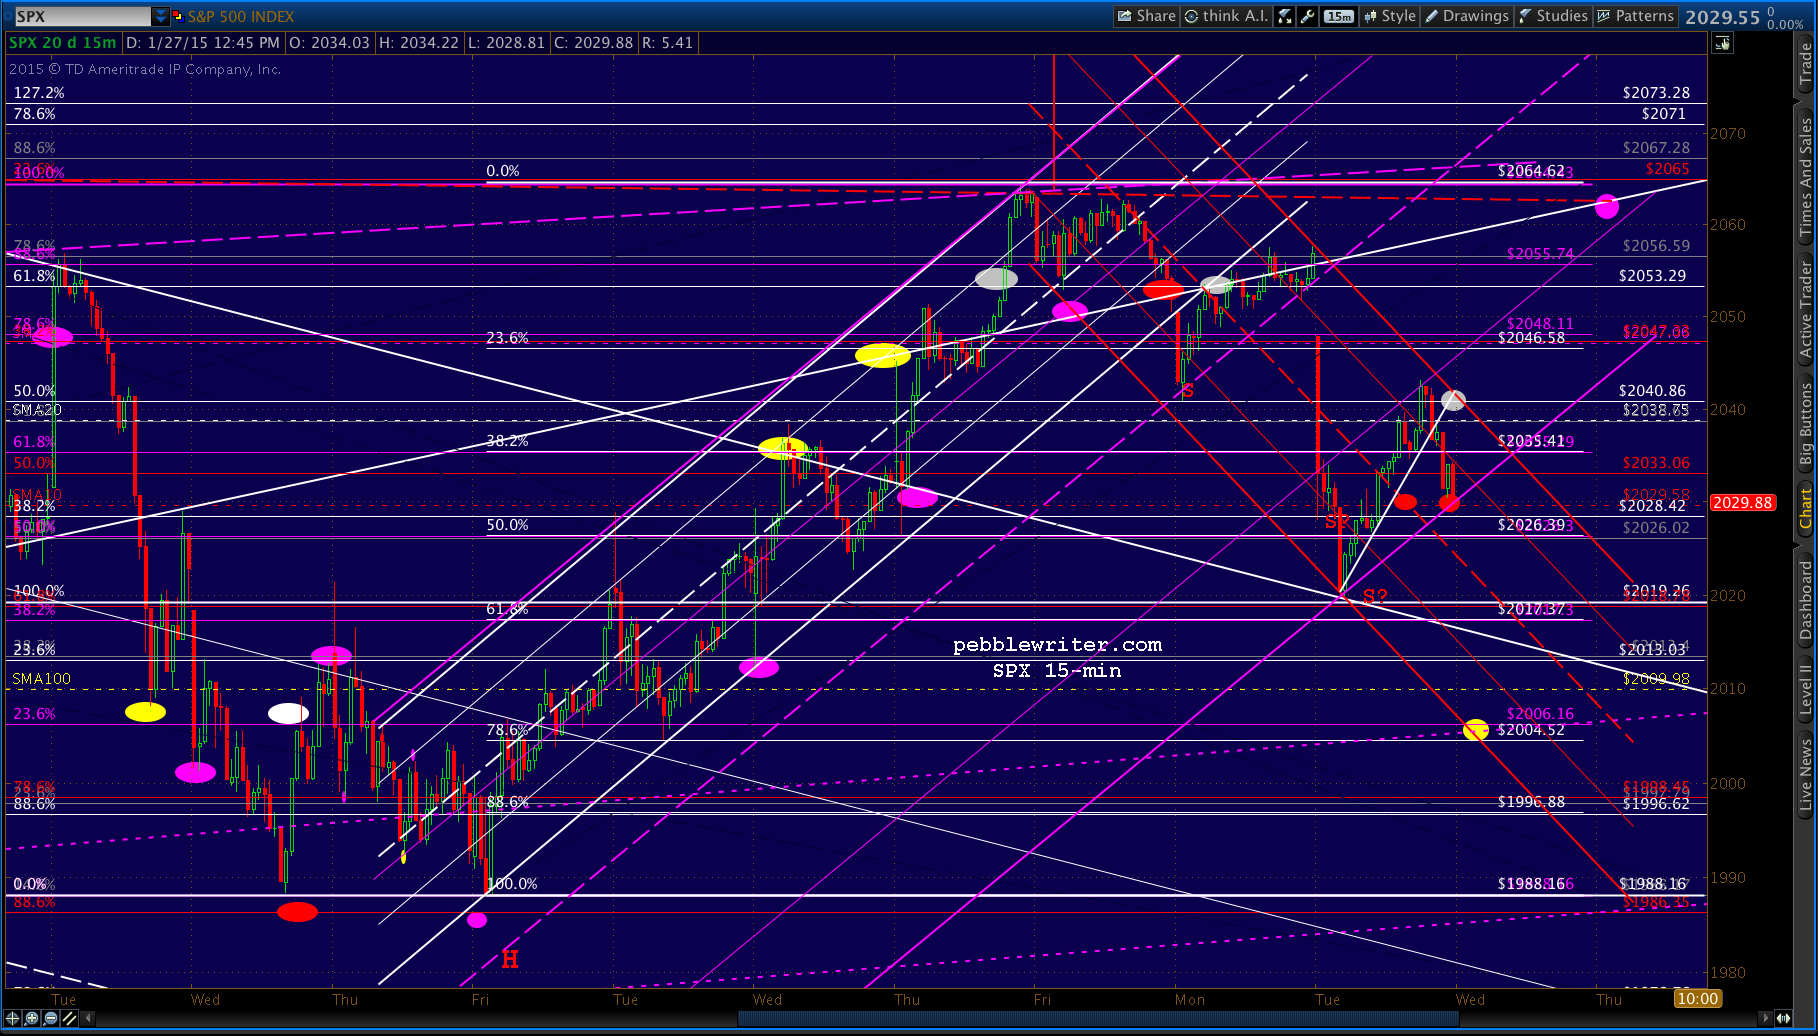
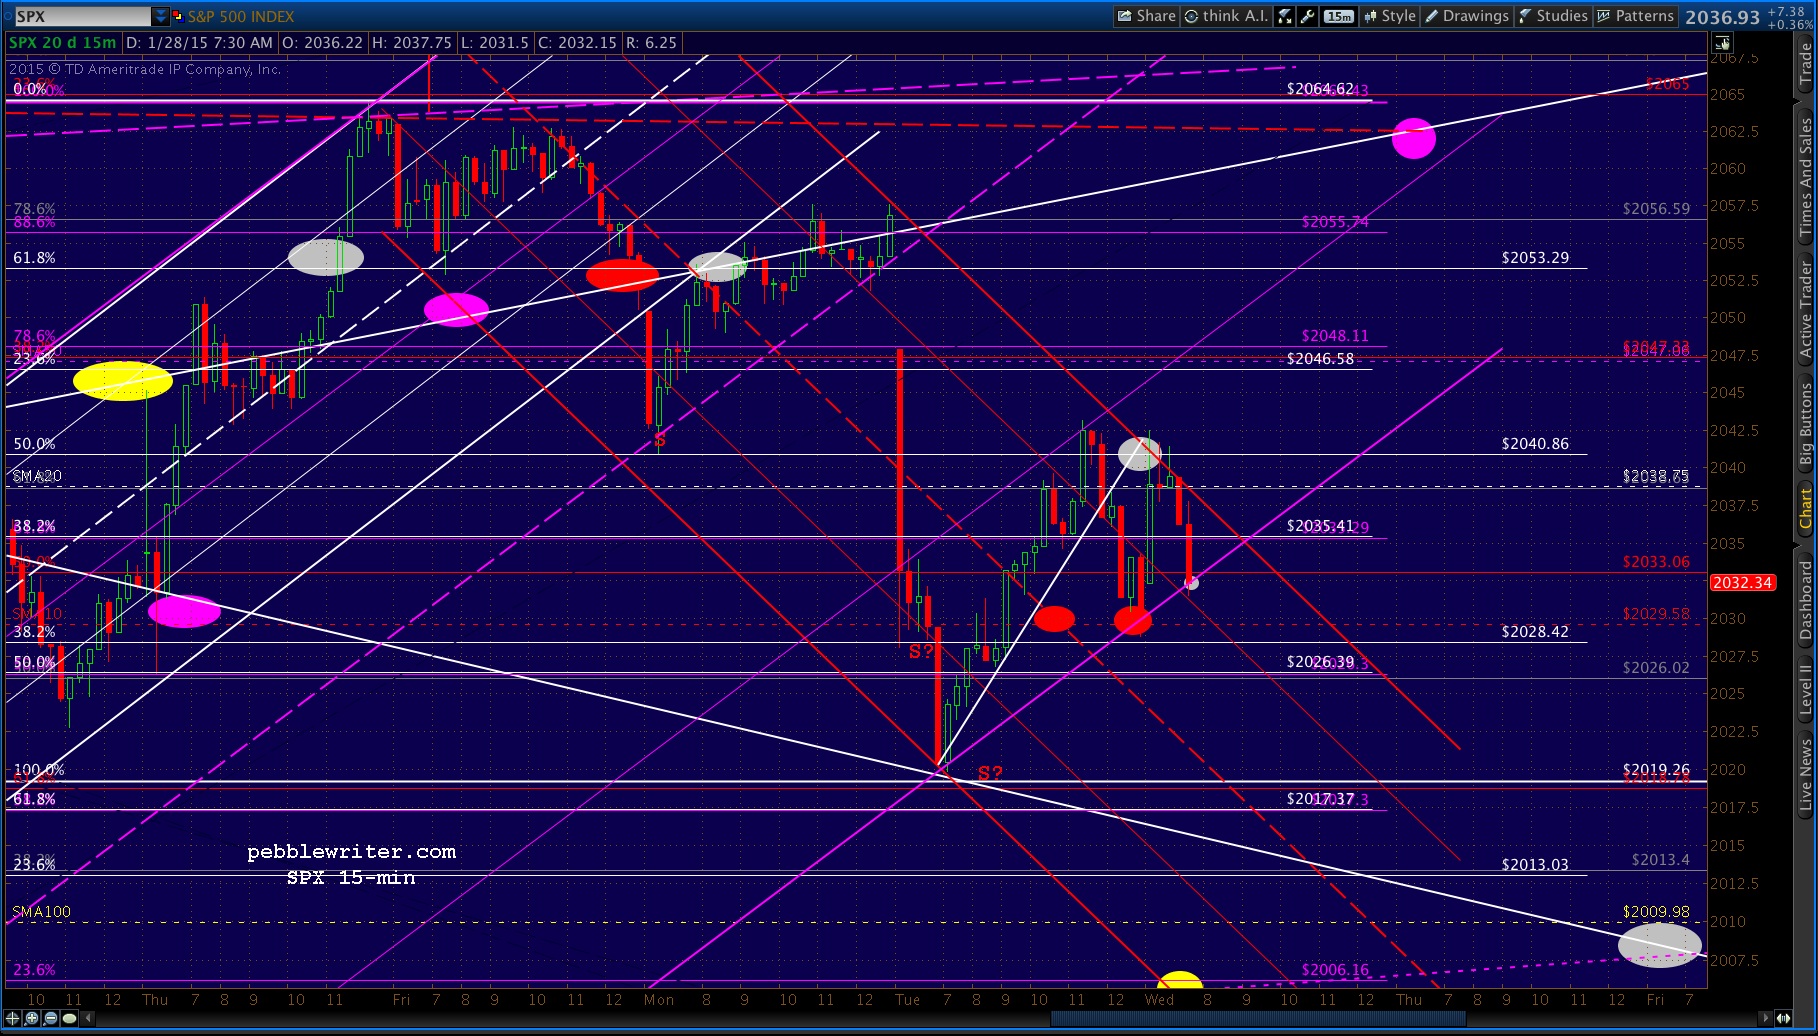
Yesterday was one of those days where the charting was deceptively easy (if only they all were…) We started out with essentially the same chart as was posted last Friday. The only alteration was to add another downside target (the lowest red “S”) at the falling white channel top in order to accommodate a potential backtest of that channel.
 Our gameplan for the day was pretty straightforward, a continuation of the previous day’s forecast:
…SPX should be shorted overnight at 2053 by those with the stomach and the ability to watch/hedge such positions — a stance that’s looking fairly prescient with the e-mini’s off nearly 30 points just prior to the opening bell…SPX looks likely to nail our next downside target in its opening move.
SPX nailed our next downside target, but the bounce was muted — only 6 1/2 points instead of a backtest of the SMA20. As such, our next downside target came into play sooner than expected.
Our original plan was for a deeper drop to somewhat match the left shoulder using the red neckline. I chose a backtest of the falling white channel at 2017ish as the target. I see this as at least a 50:50 shot…
The backtest stopped just short of our target at 2019. We then projected a bounce back to the SMA10 and then the SMA20 at 2041, at which point we recommended a protective stop. SPX reached 2043, then reversed — triggering our stop and setting our sites on the SMA10 at 2029. SPX closed at 2029.88.
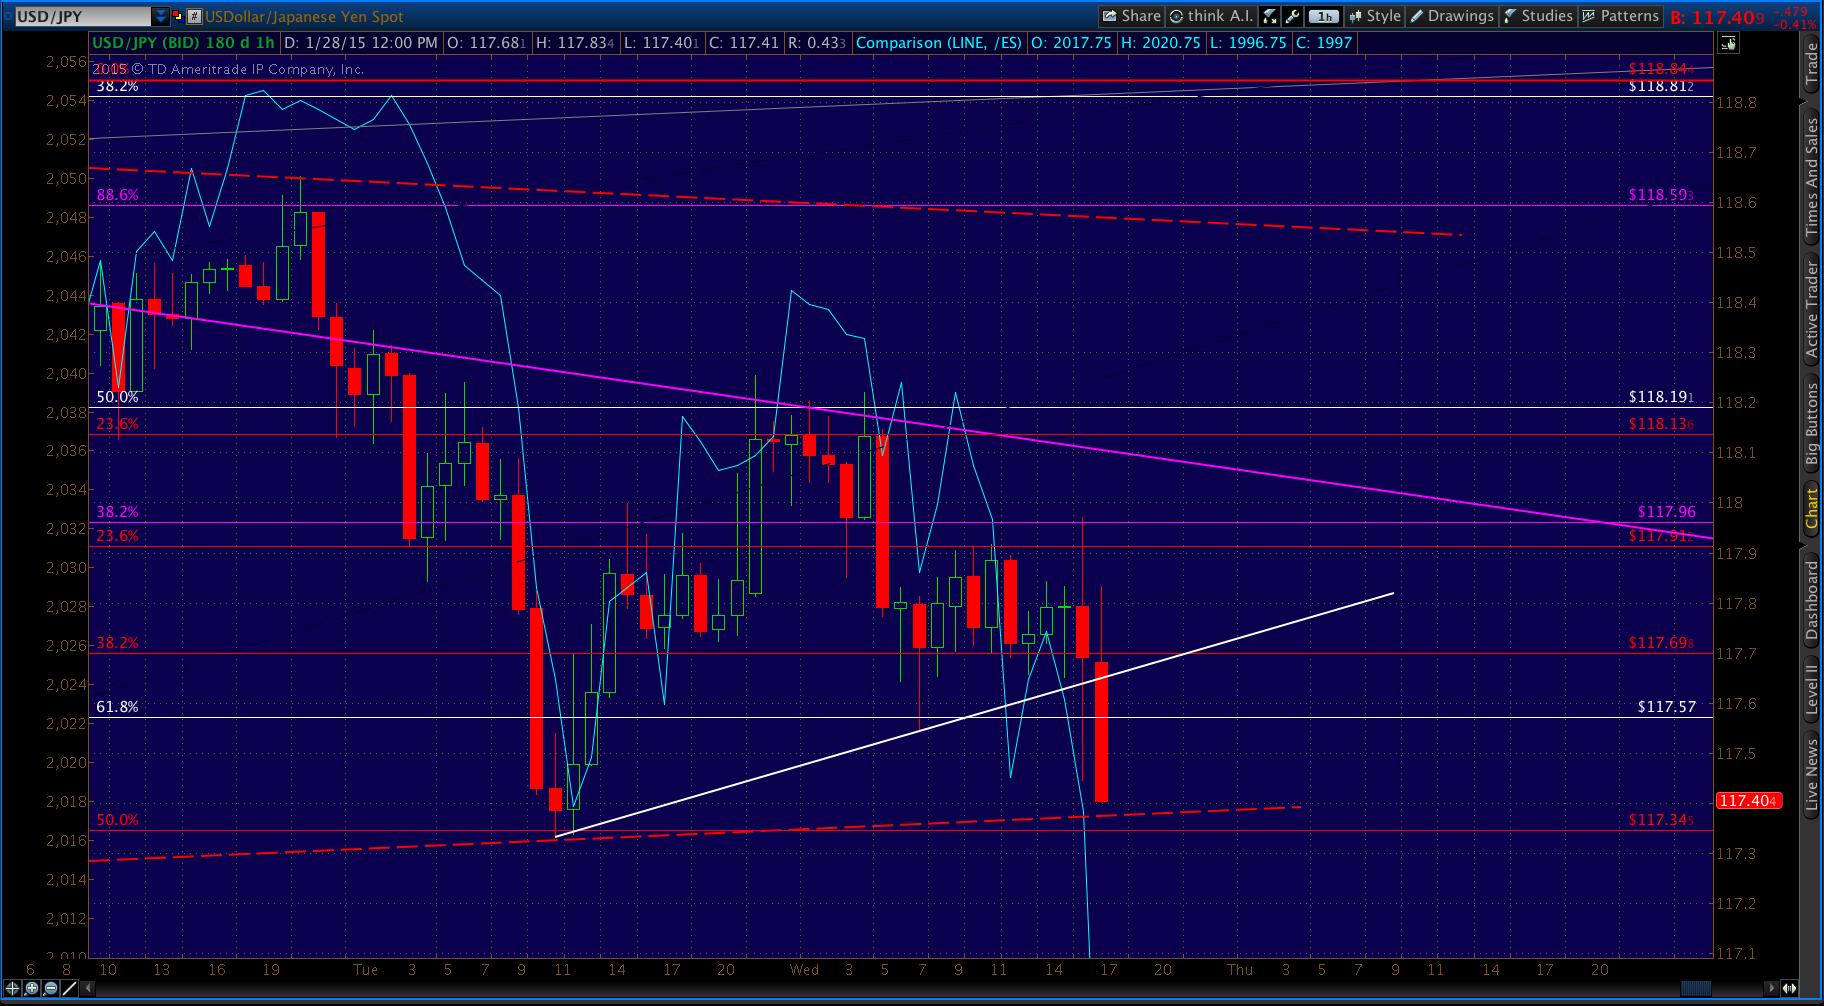
 After the close yesterday, AAPL blew the doors off most everyone’s forecast — kicking off a ramp-a-thon that saw USDJPY rally back to the channel top (yes, again) and S&P futures a whopping 24 points.
  Even though USDJPY backed off the channel top overnight, ES is clinging to a 5-6 point gain. This leaves the chart picture muddled, which is appropriate given that we’ll have a Fed rate decision coming up at 2pm EST. There will be no press conference, and no shocking shifts in policy are expected. But, it still leaves the “market” in a bit of suspense.
With the close at the SMA10 support yesterday, and a subsequent pop in the futures, the immediate trend looks to be higher. Remember, the drop to 2019 was a backtest of a falling channel.
continued for members…
But, the inability of USDJPY to break out has to be concerning for bulls. If SPX can hang on to the TL connecting to the 2019 lows, that TL could be considered part of a larger rising channel (purple below.) The purple and red necklines are up around 2062 and would be a great bullish target.
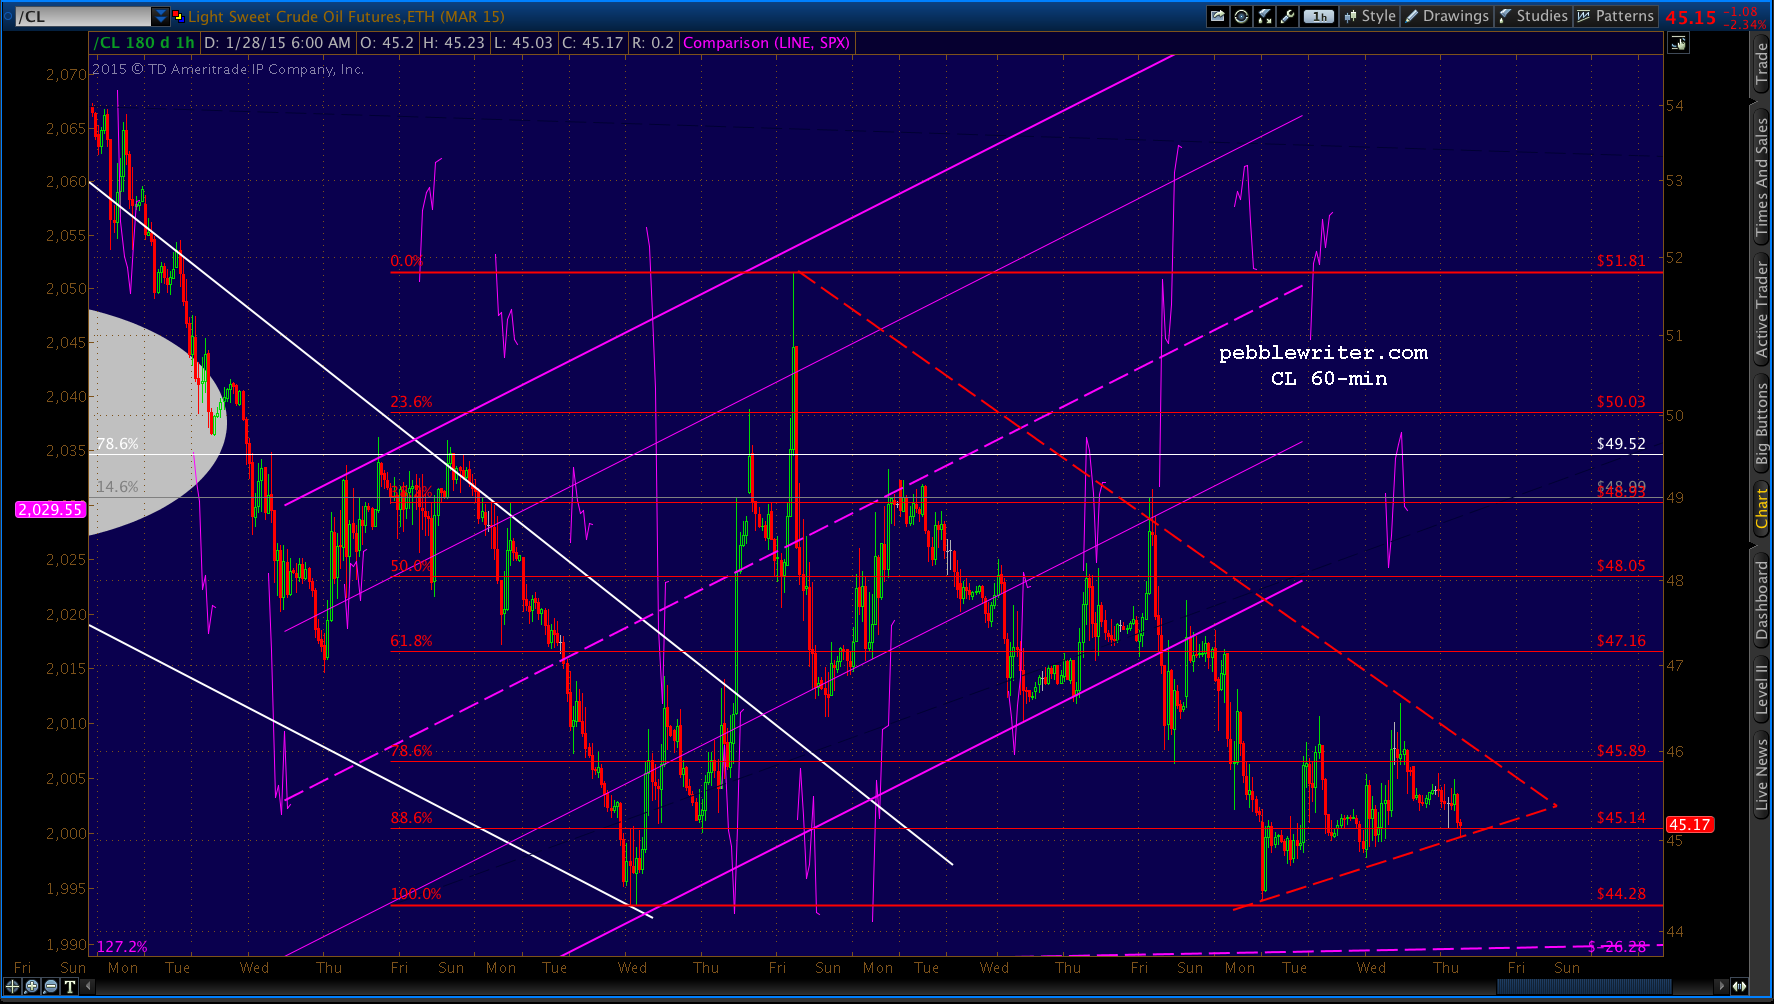
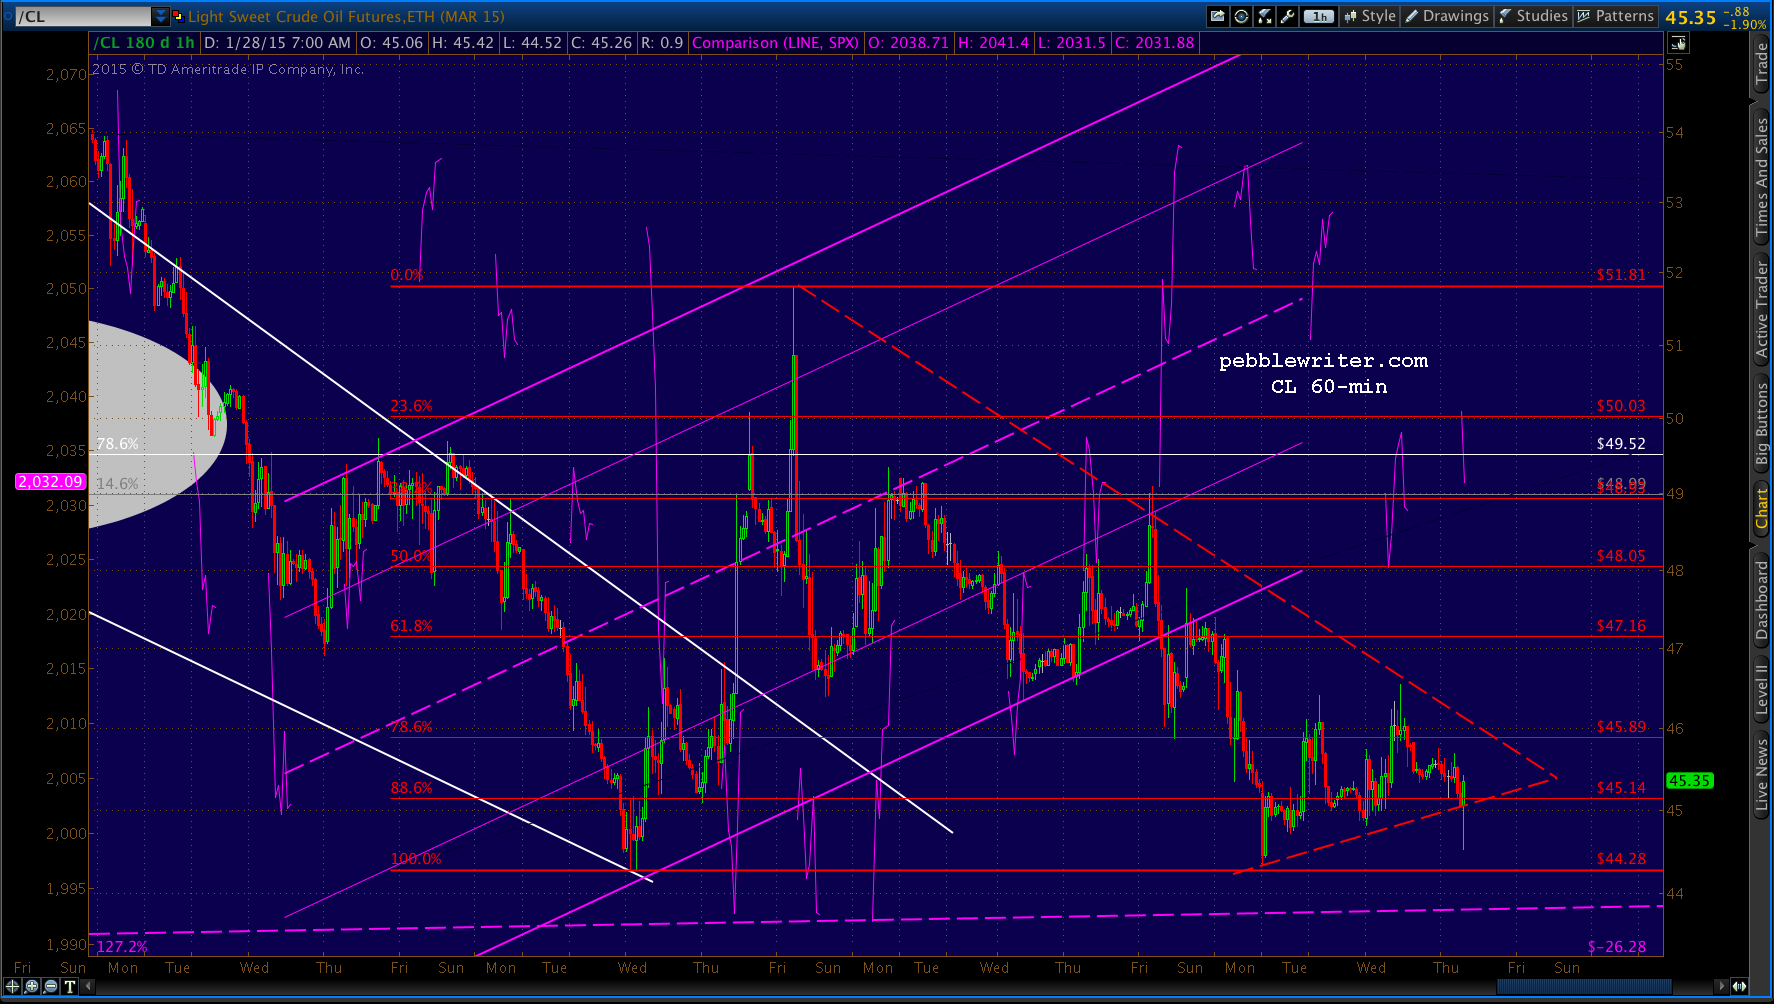
 If, however, prices drop below the tentative purple channel bottom, then our Gartley Pattern target at 2004 starts to look pretty good. The keys will undoubtedly continue to be USDJPY — whether it remains range bound below that channel top — and, CL — which is clinging to a very iffy uptrend that looks extremely managed.
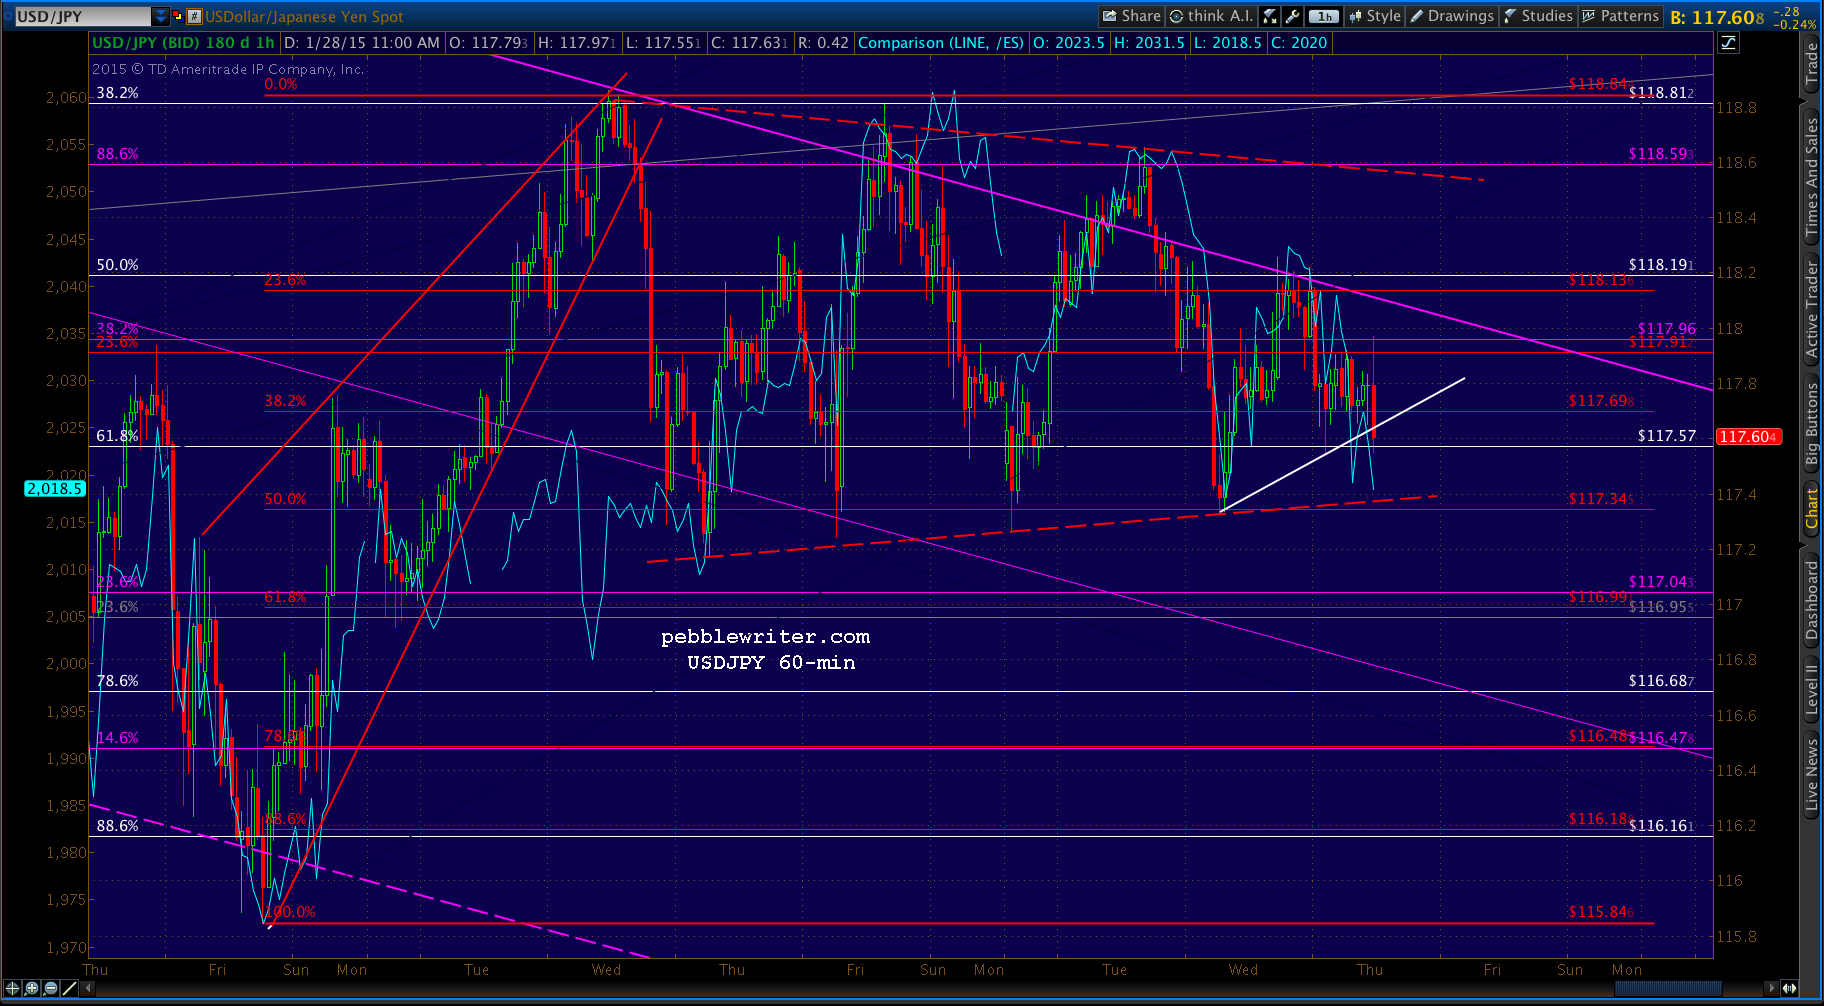
 Bottom line, I suspect USDJPY will take a run at the upper TL of the triangle it’s forming — where it will probably fall back again overnight. This would drag stocks higher into the end of the day — possibly to our neckline target — but, leave them in danger of another pullback.
Fed announcement days are usually all about consolidation until the deed is done, followed by algo-driven rallies into the close and more consolidation the day after. We’ll see.
UPDATE: 10:25 AM
CL just lost the lower bound of its triangle. Not a good development for stocks…
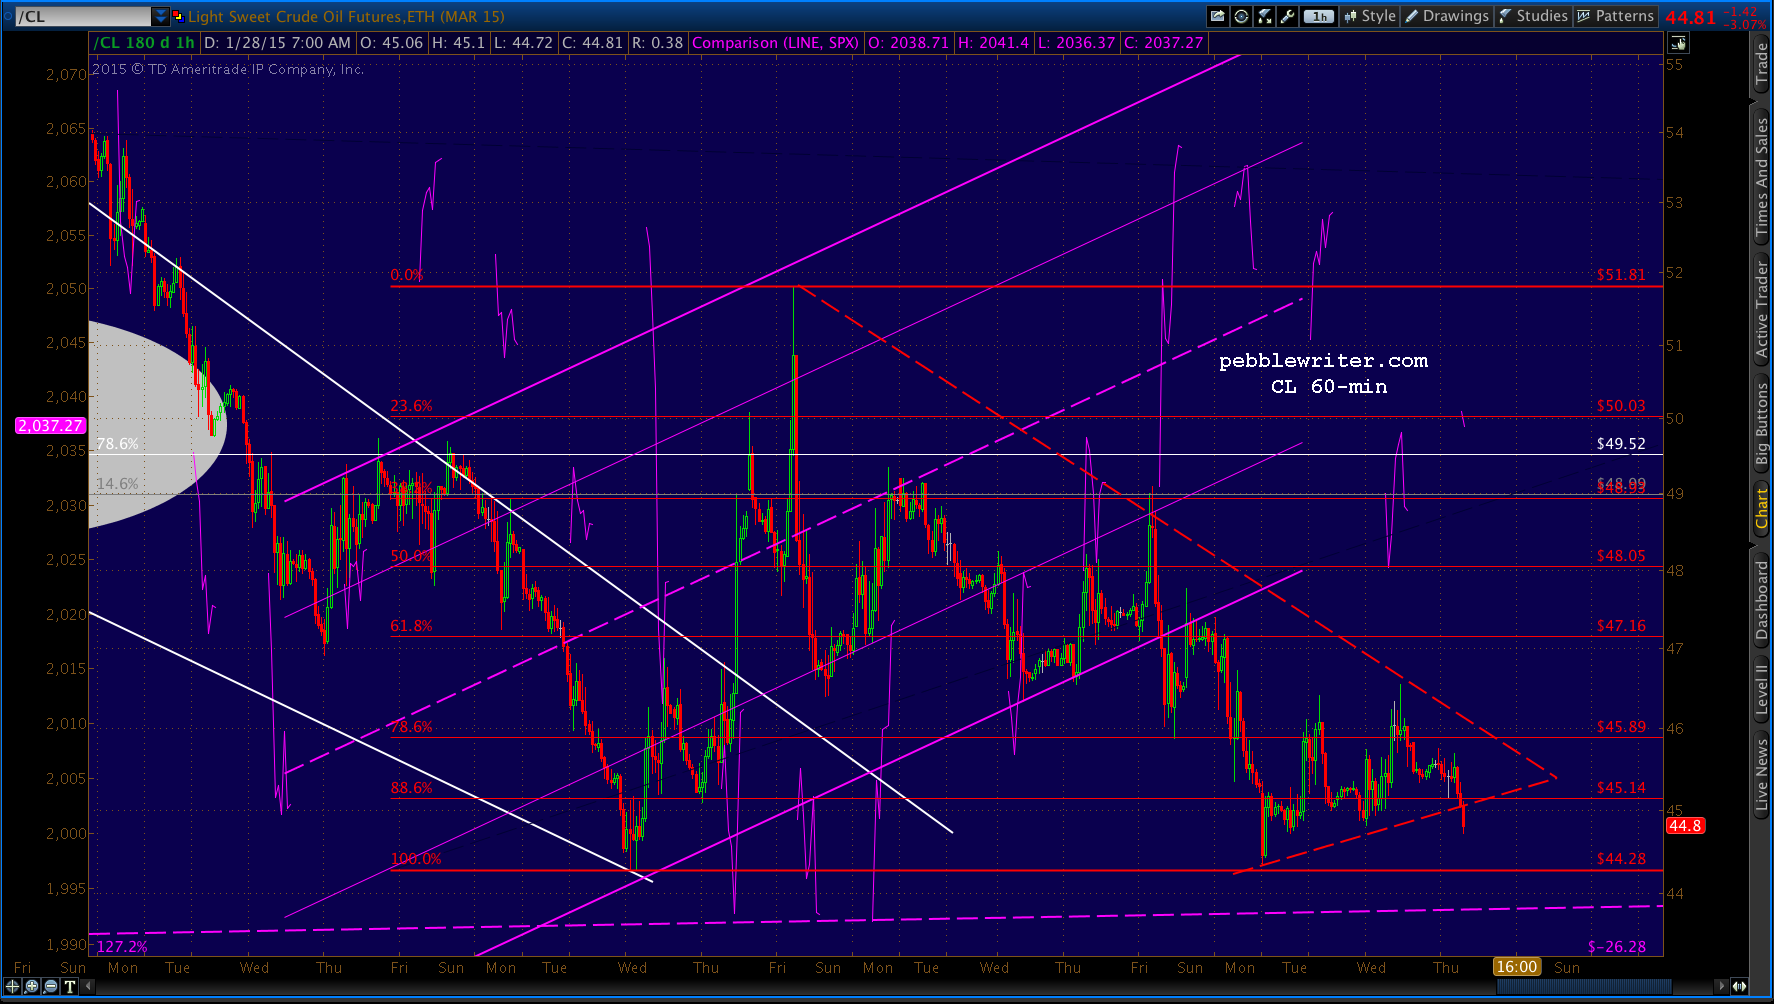 …which will probably retreat to the lower bound of its channel/TL.
UPDATE: 10:42 AM
CL to SPX: jk! If it can hold 44, we should get a nice bounce up to top the Jan 15 highs at 51.81.
Done, or another test of the SMA10 coming up?
UPDATE: 11:00 AM
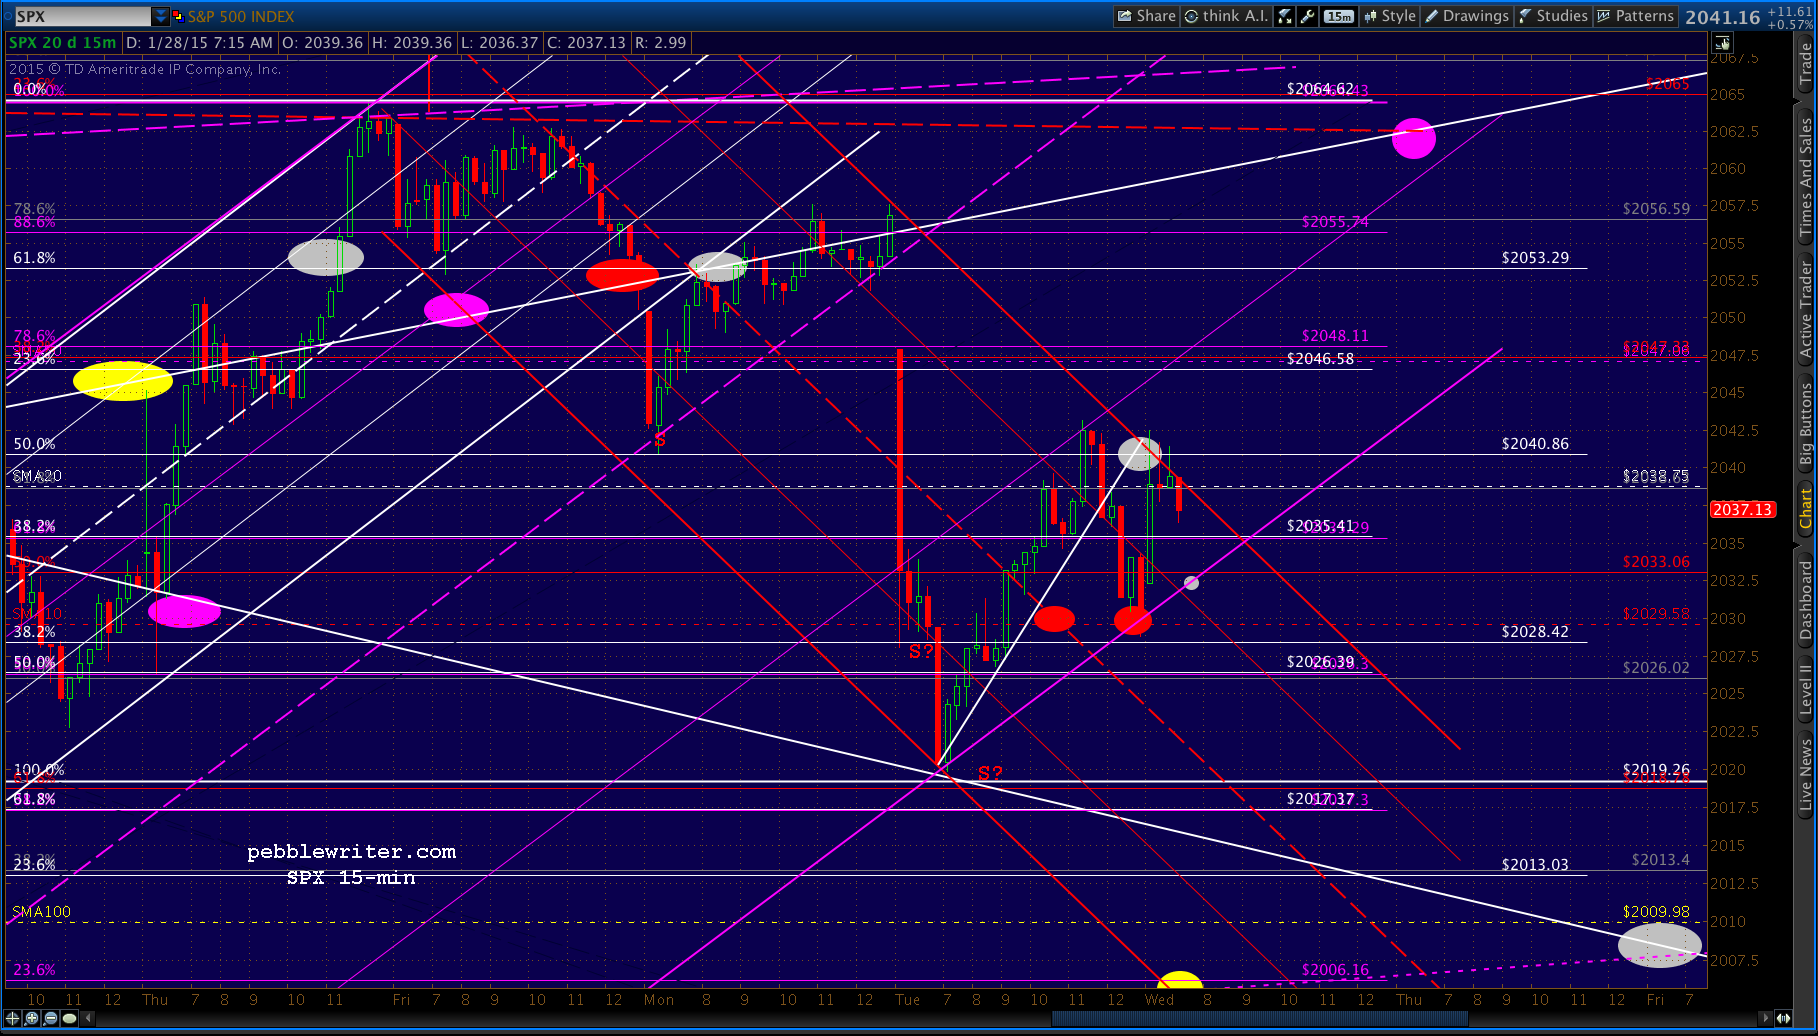
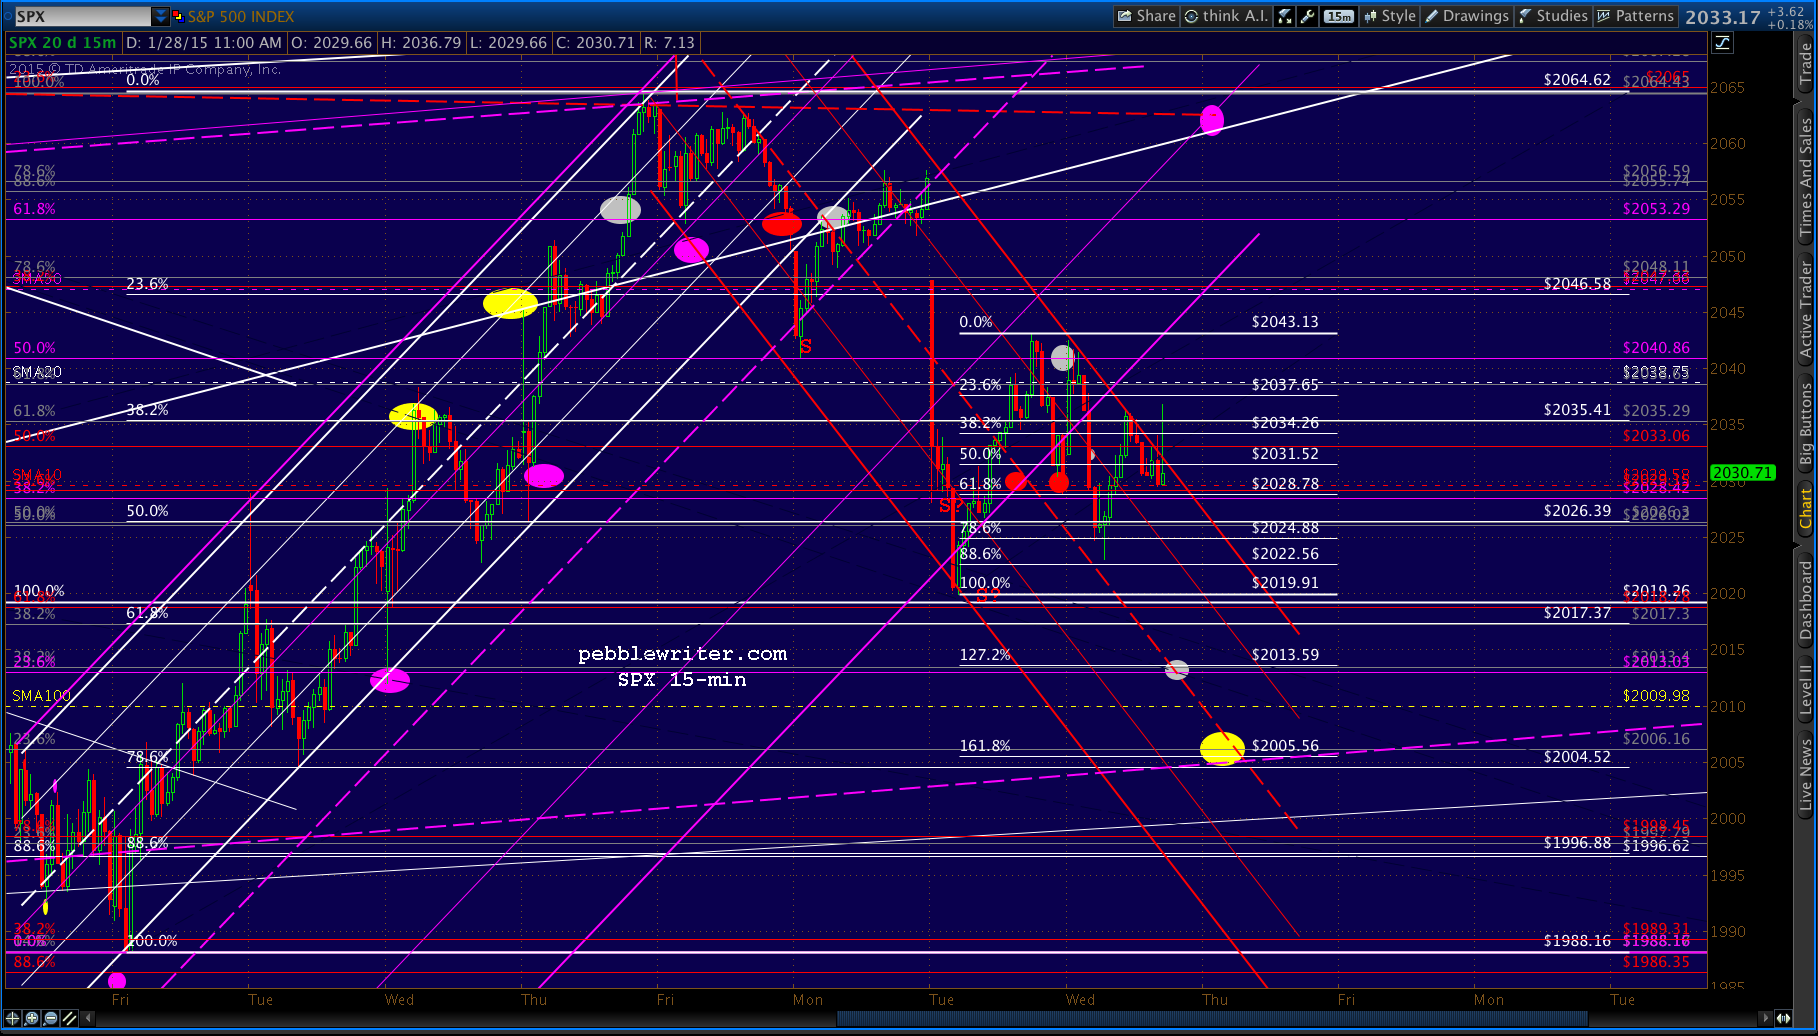
SPX just completed a little Gartley Pattern at the small white .786 and should get a bounce of some sort here — probably to backtest the SMA10 (2030) or broken purple channel/TL (2035ish.) But, the more interesting implication is the Butterfly Pattern that would be suggested — with the white 1.272 (2013.59) and 1.618 (2005.56) as potential downside targets.
 UPDATE: 12:24 PM
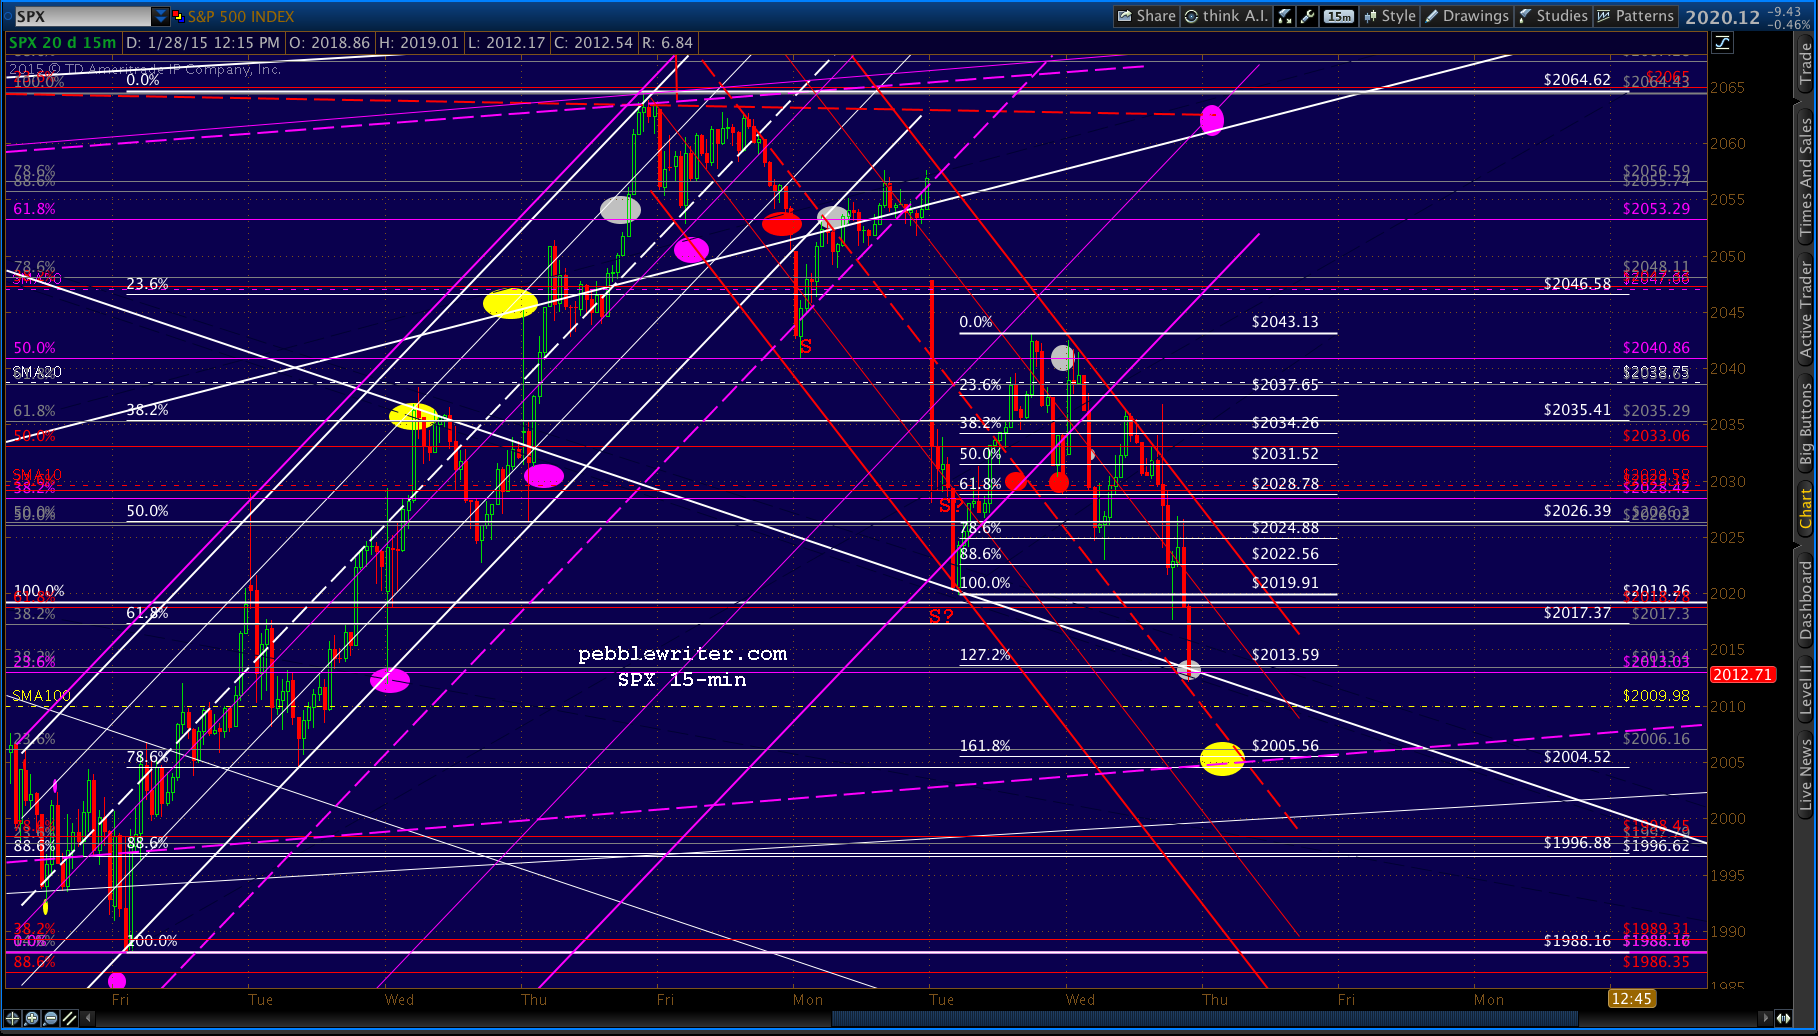
Just completed the backtest of the purple channel at 2035. The overall picture isn’t any clearer — suspect it’ll turn back down as we approach 2PM, which would support the idea of a drop to 2013 or 2005 as discussed above.
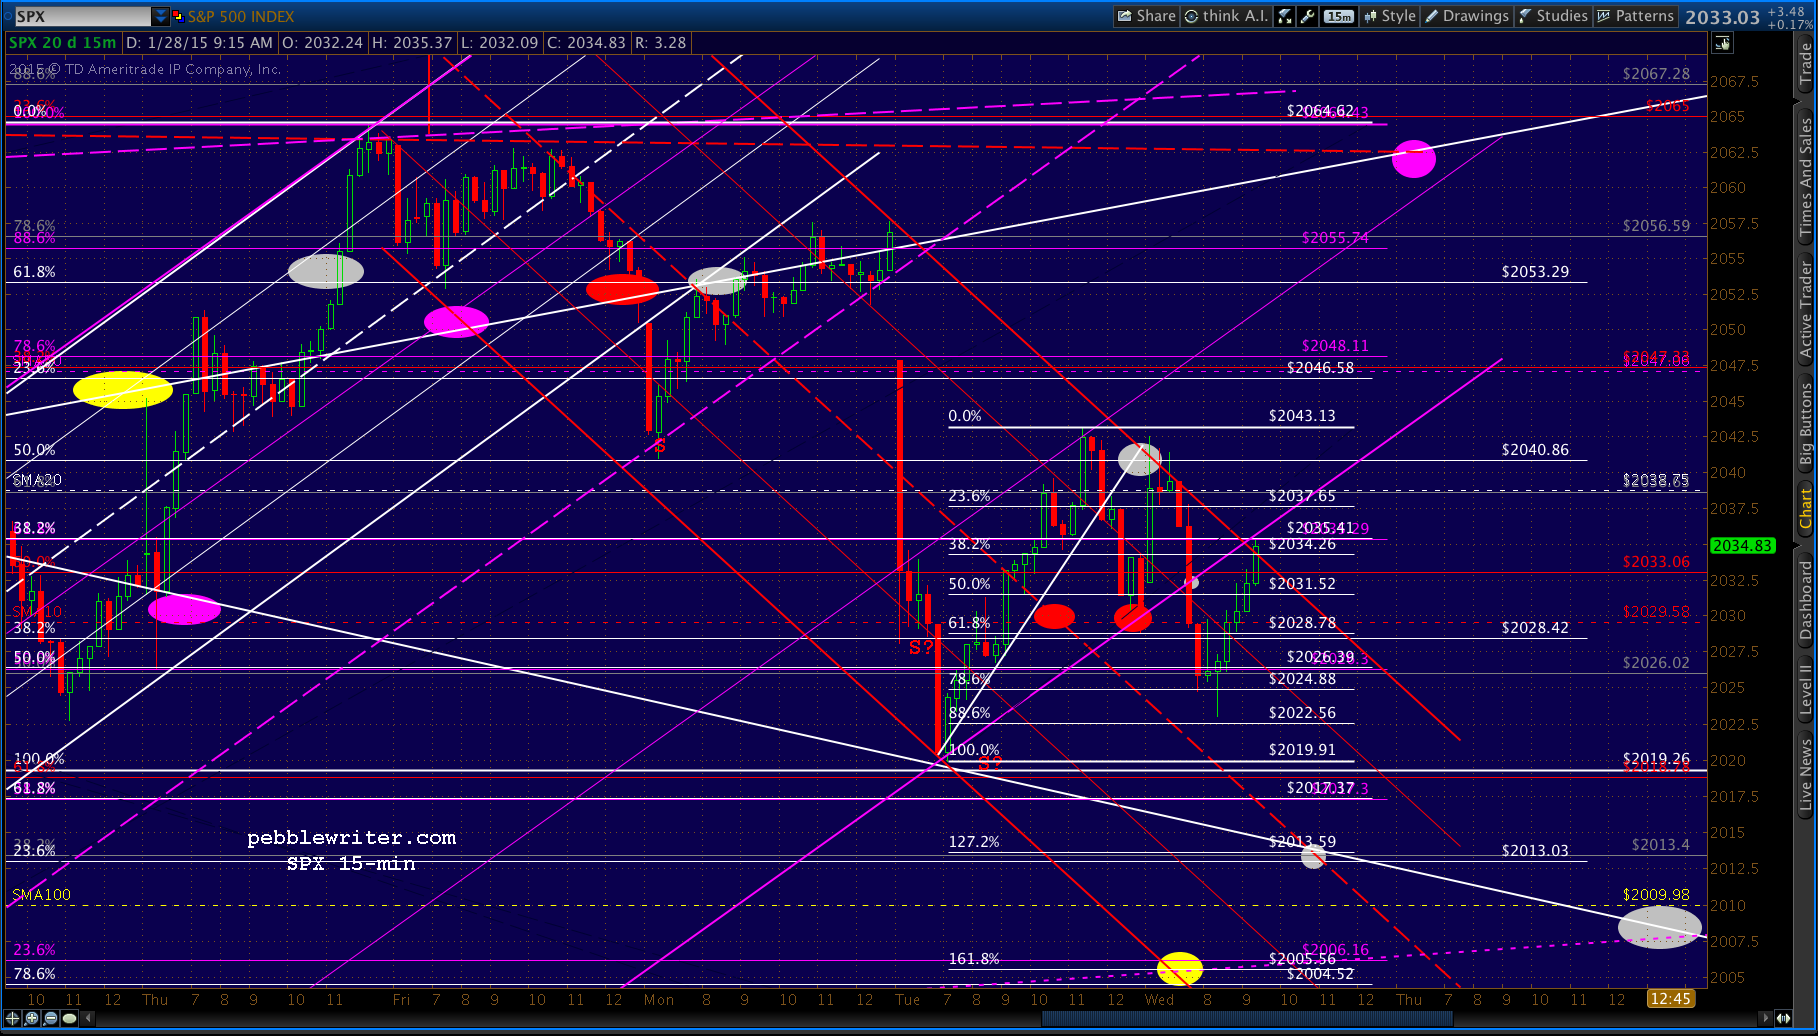 The bullish viewpoint is we’ve had five waves down from 2064 to 2019, a seemingly impulsive wave one to 2043, and three corrective waves back to 2023. This move up to 2035 would be the start of a wave three.
UPDATE: 2:10 PM
Initial reaction to Fed statement: quick pop, but looks to be heading lower.
I’ve adjusted the timing of the downside targets to work better with the falling red channel.
UPDATE: 3:28 PM
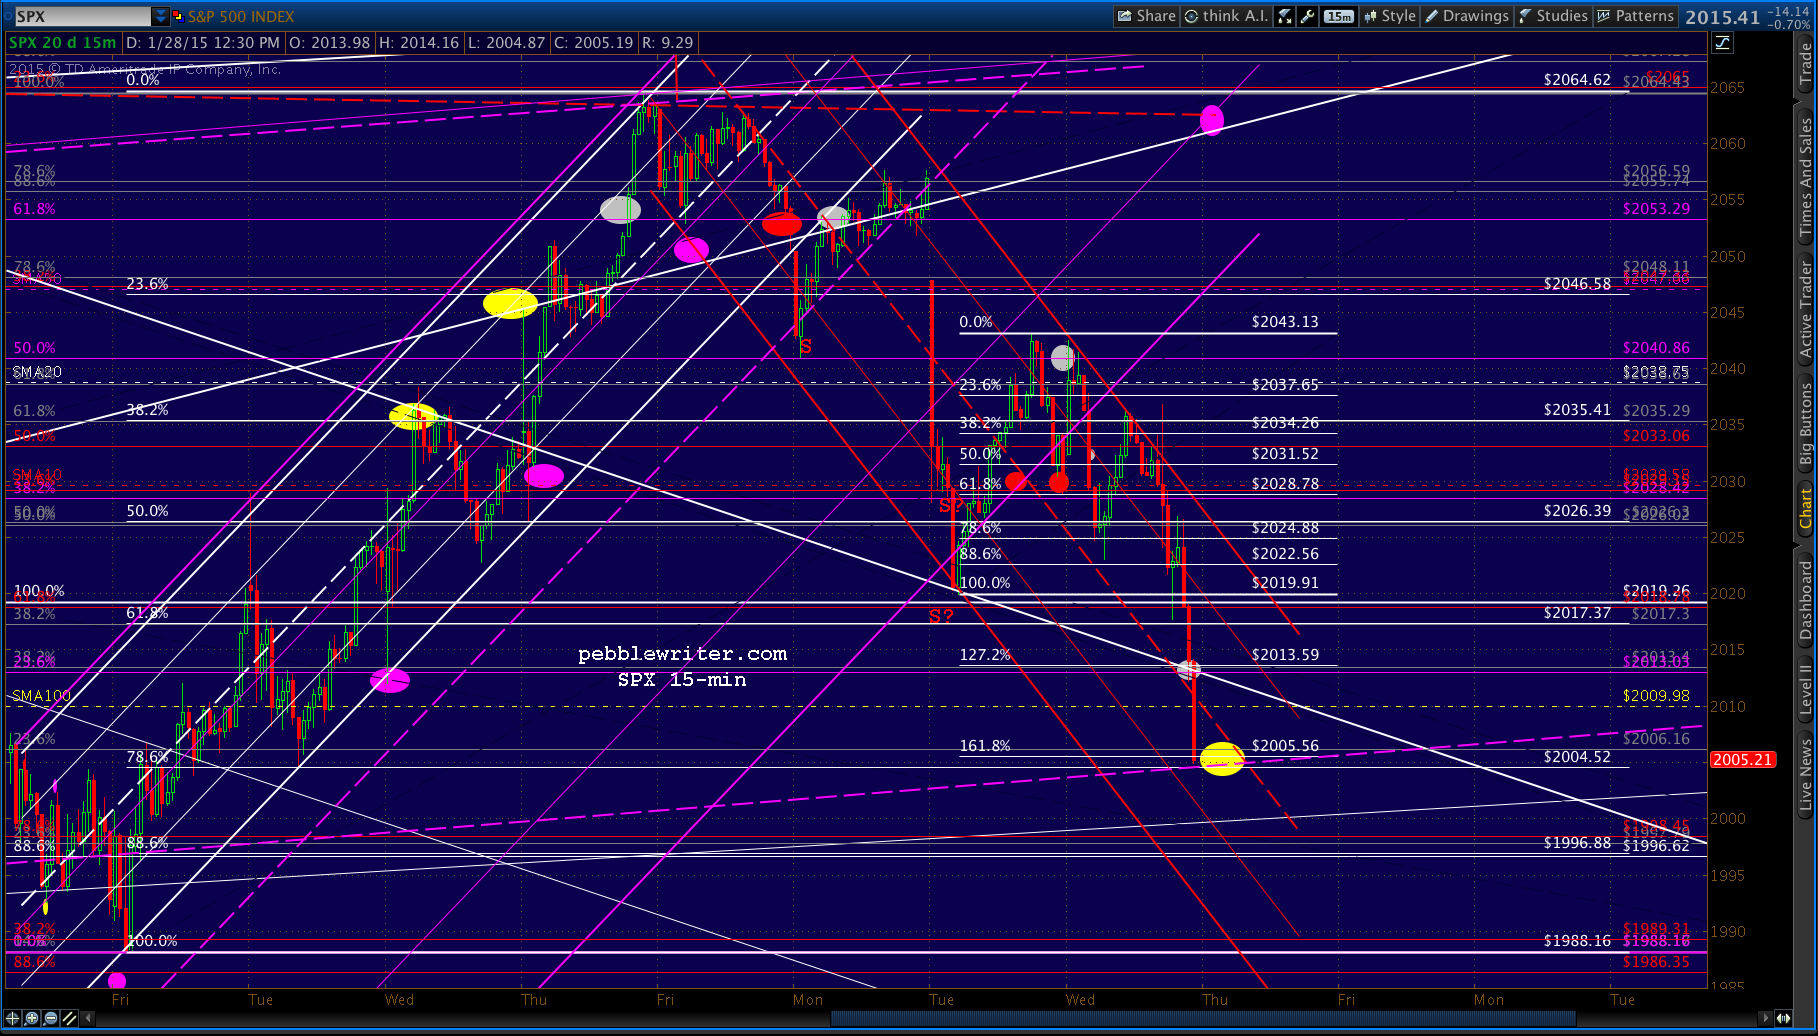
Next target down. Since we have another backtest, it’ll take a push through to reach the yellow dot. Either a melt-down into the close or first thing tomorrow.
 UPDATE: 3:42 PM
And, the last SPX target…
 …USDJPY coming up on the lower bound…
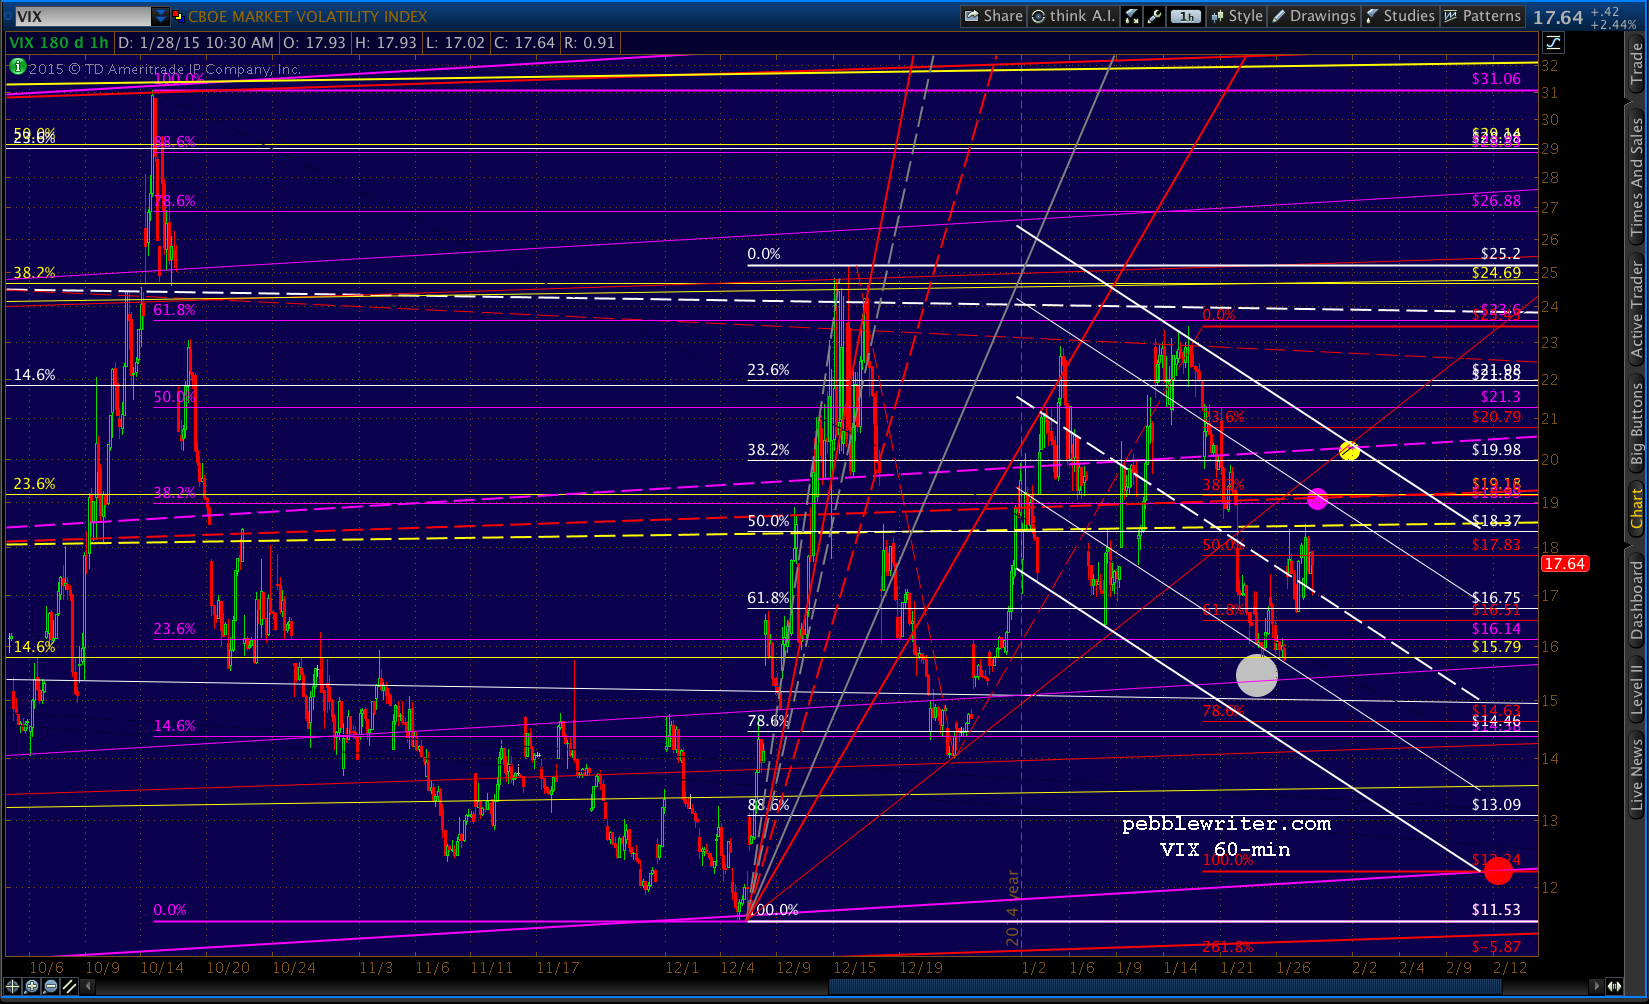
 …and VIX tagged yesterday’s upside target…
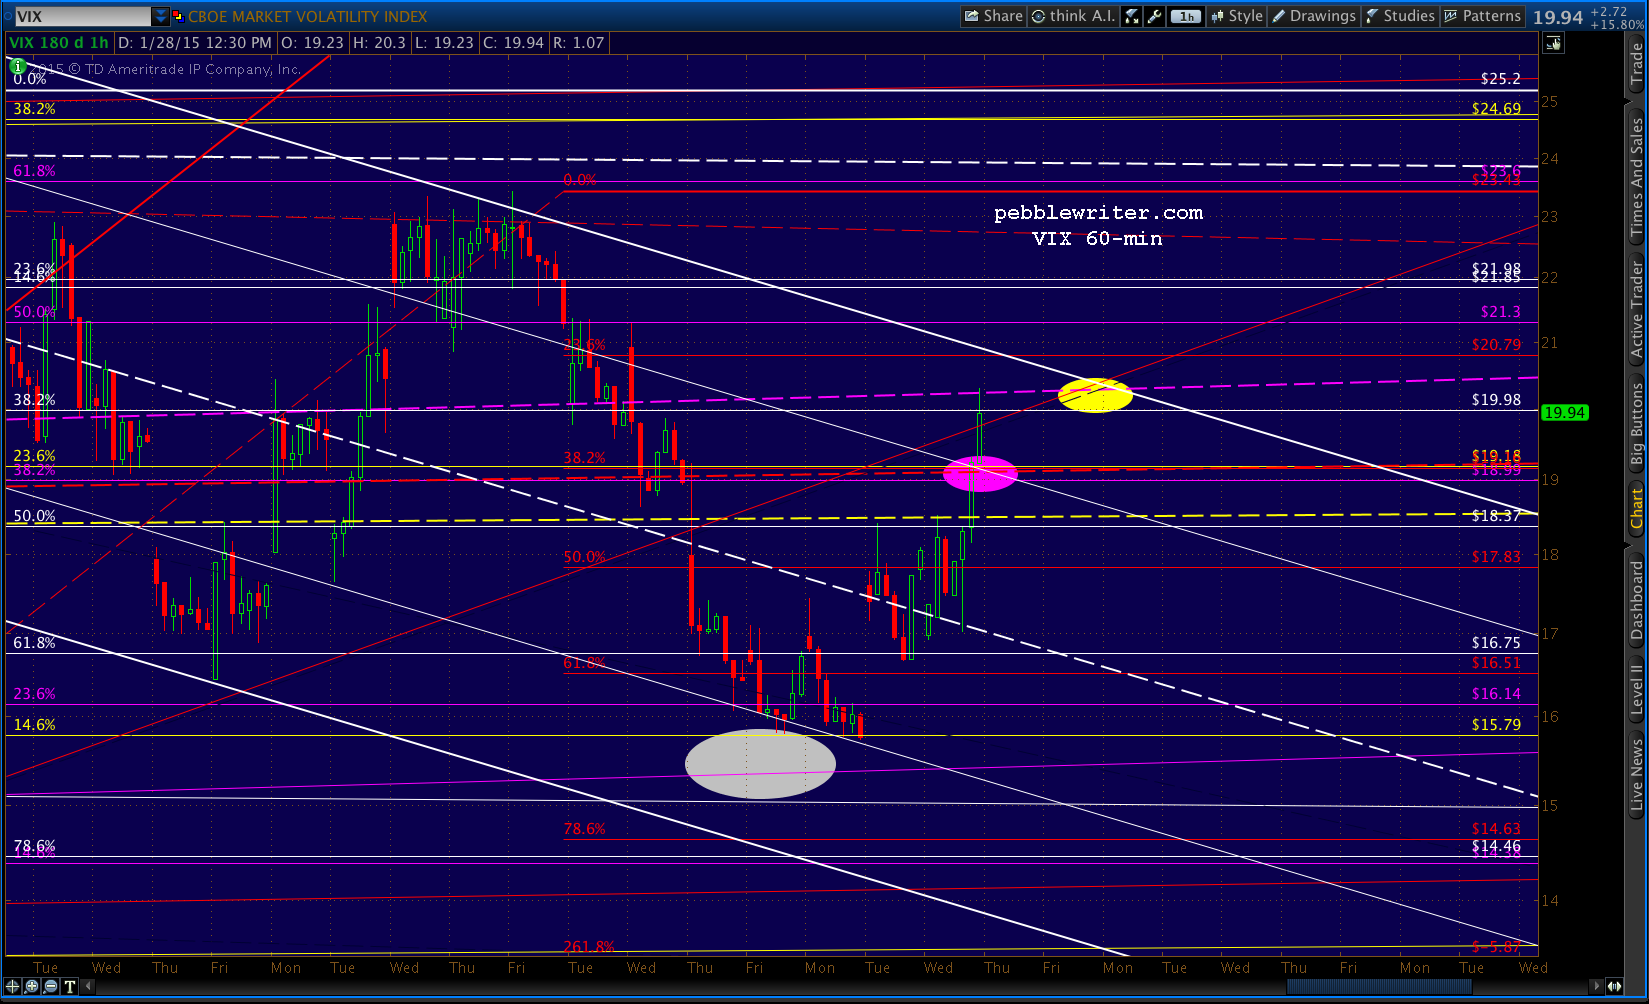 …should see a rebound here. Though from the looks of USDJPY, it might not be until tomorrow. If, for some reason, it doesn’t bounce, the next major support isn’t until the SMA200 way down at 1972.9.