Yesterday’s forecast worked out nicely. Recall that this was the same scenario first laid out last Friday.
As such, I see no reason to adjust Friday morning’s chart/forecast: a test of the SMA20/50 — and a potential IH&S right shoulder if those don’t hold.
After SPX reached our initial downside target, we called for a bounce that was only slightly more exuberant than anticipated. Watching USDJPY, we noted:
It’s now threatening a breakout for the fifth time since early January. I suspect this one will also run out of juice, leaving SPX to backtest the rising white channel at around 2053 before heading further south.
 SPX bounced off the SMA20 at 2040 up to 2055, then hung around while USDJPY teased us with the idea of a breakout — a breakout that failed yet again last night.
 Our closing note to members was that SPX should be shorted overnight at 2053 by those with the stomach and the ability to watch/hedge such positions — a stance that’s looking fairly prescient with the e-mini’s off nearly 30 points just prior to the opening bell.
SPX is at our target of 2053. I’d short here with tight stops — but would strongly recommend cash overnight for those who can’t hedge or watch their position like a hawk overnight.
SPX looks likely to nail our next downside target in its opening move. We’ll update the charts shortly.
continued for members…
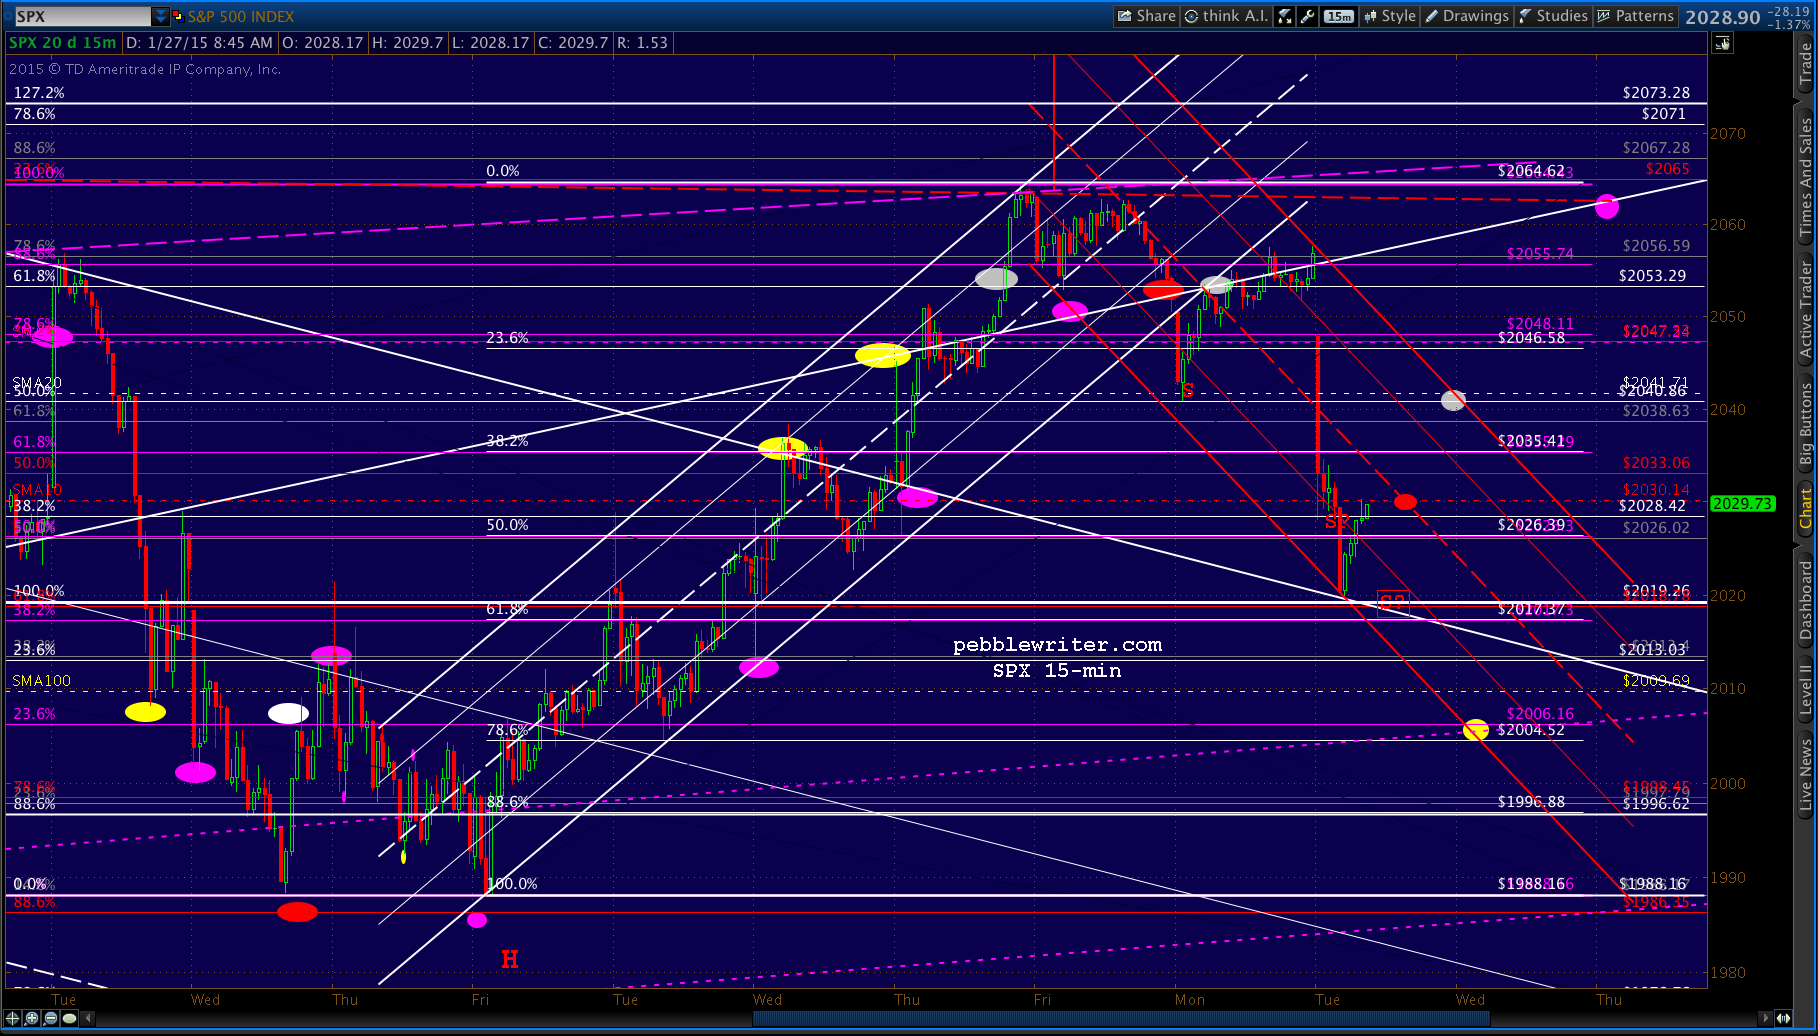
USDJPY is bouncing off a TL connecting the past 4 lows as SPX is reaching the SMA10. We should get a backtest of the SMA20 here at 2028.10.
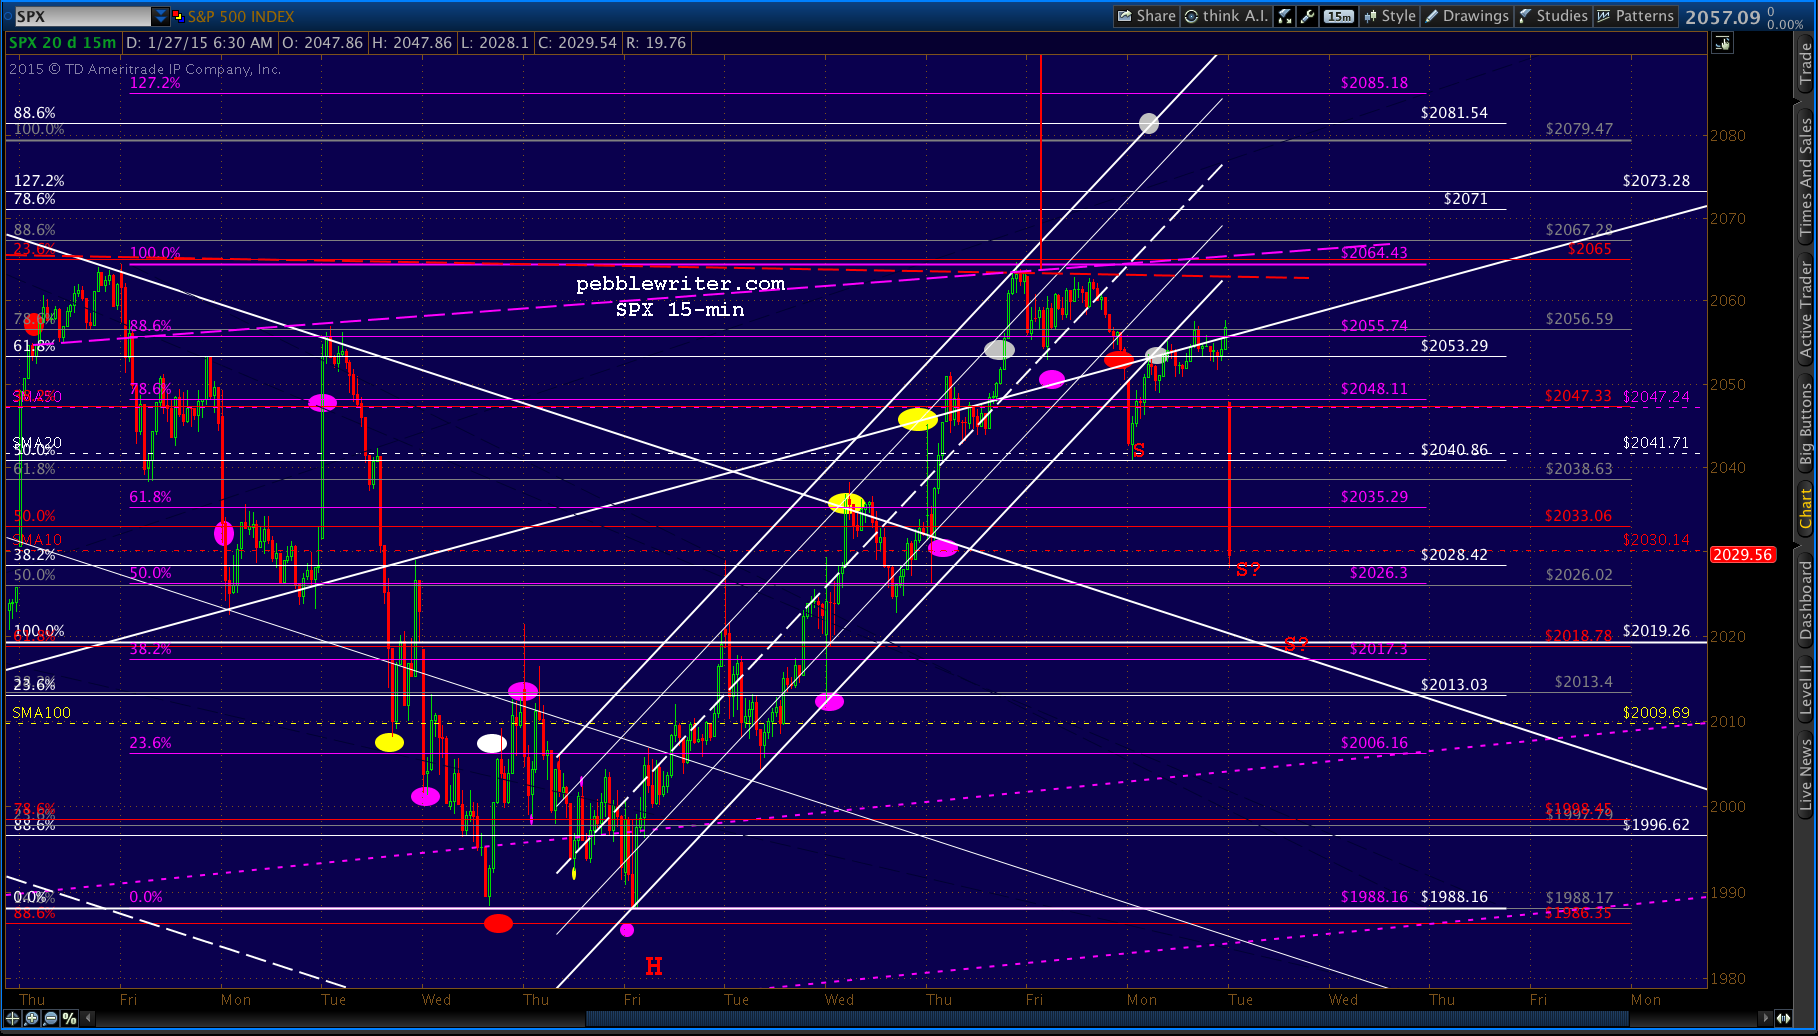 IMO, the 35-pt drop from 2063 last Friday is enough of a right shoulder to make for a decent IH&S Pattern if we use the dashed purple line as the neckline.
I’m not thrilled with rising necklines on IH&S Patterns. Falling necklines play out better. And, this drop — while it backtested the SMA10 — didn’t backtest any channels or TLs.
Our original plan was for a deeper drop to somewhat match the left shoulder using the red neckline. I chose a backtest of the falling white channel at 2017ish as the target. I see this as at least a 50:50 shot, though it will need further weakness from USDJPY — perhaps dropping through that TL. We’ll watch to see if it suddenly spurts higher on any further SPX weakness.
If our lower target is reached, the ideal time would be around 2pm EST. It’s worth noting that the SMA100 is coming back into view — currently at 2010, so not much lower than our 2017 target.
UPDATE: 10:47 AM
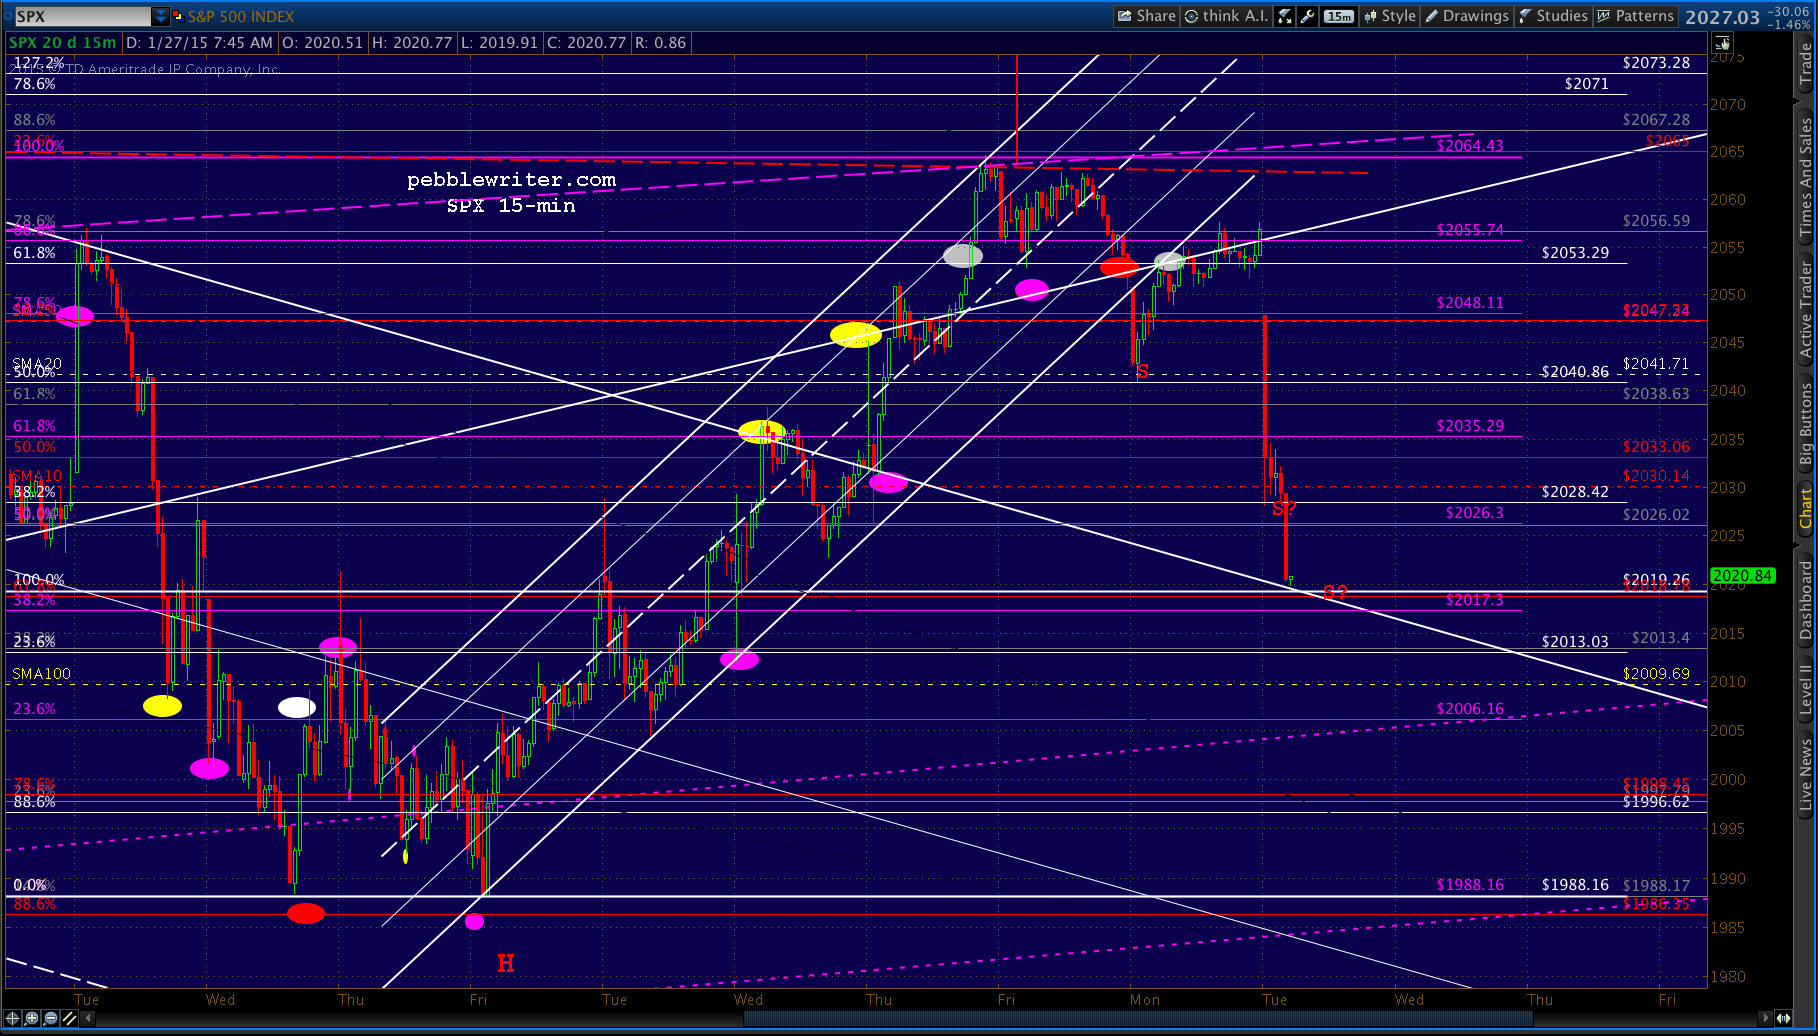
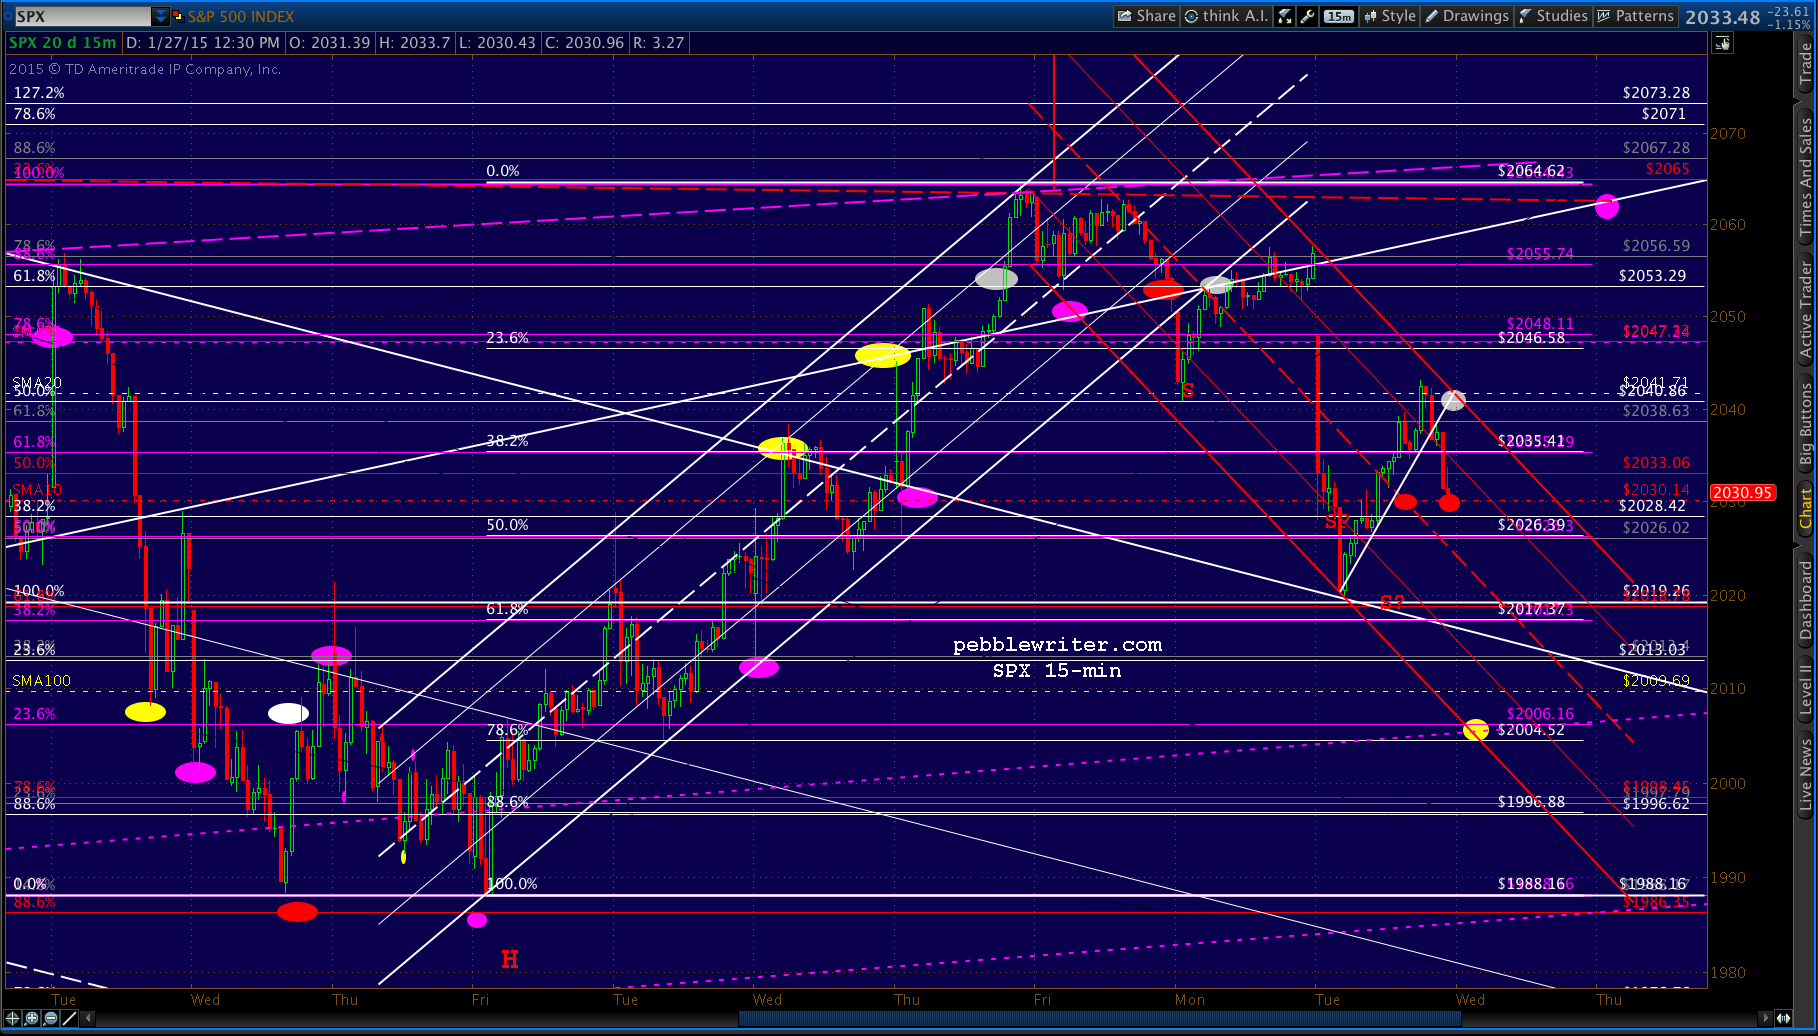
SPX just backtested the falling white channel. Since it was a little ahead of schedule, it wasn’t quite as low price-wise as it might have been — reaching only 2019.91 vs 2017 as forecast. We should get a bounce here, but I can’t rule out some fumbling around and drifting lower to, say, 2017.37 later in the session.
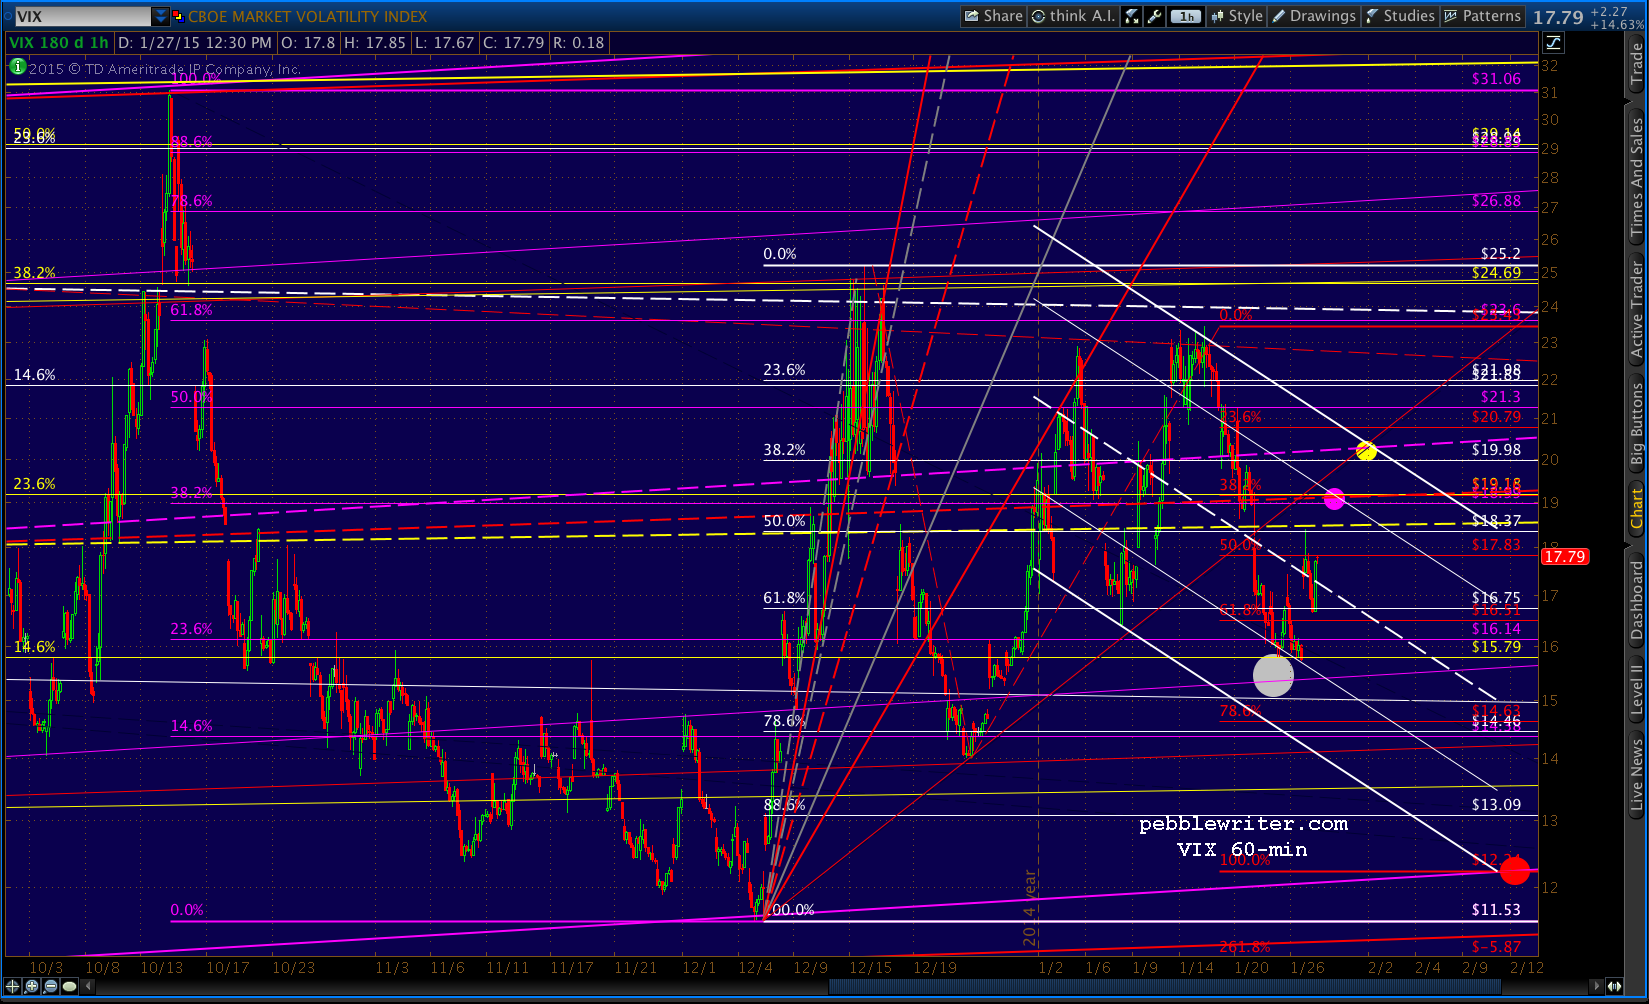
 Note that VIX has backtested the yellow channel midline we charted last week.
 UPDATE: 11:49 AM
SPX has bounced 11 points or so off the backtest, and is threatening to push up through the SMA10 again. If it does, it opens up the SMA20 (2041) mentioned earlier — or, even the SMA50 at 2047 if it gets rambunctious. The bulls would very much like to reach the red neckline at 2062.50.
 If it can’t push through the SMA10 (60:40?), then the white .618 at 2017.37 is still in play, and the SMA100 is waiting down at 2010ish. Note that with a reversal very close to the .618, we could see a Gartley Pattern target the .786 at 2004.52 — which would make for a nice head fake on the downside.
UPDATE: 2:25 PM
Just reached the second bounce target of 2041.71. I think it’s likely to go on up and tag the SMA50 at 2048.11, but a stop at current levels wouldn’t be a bad idea.
 USDJPY still has room to go if they want to ramp it back up to the channel top.
 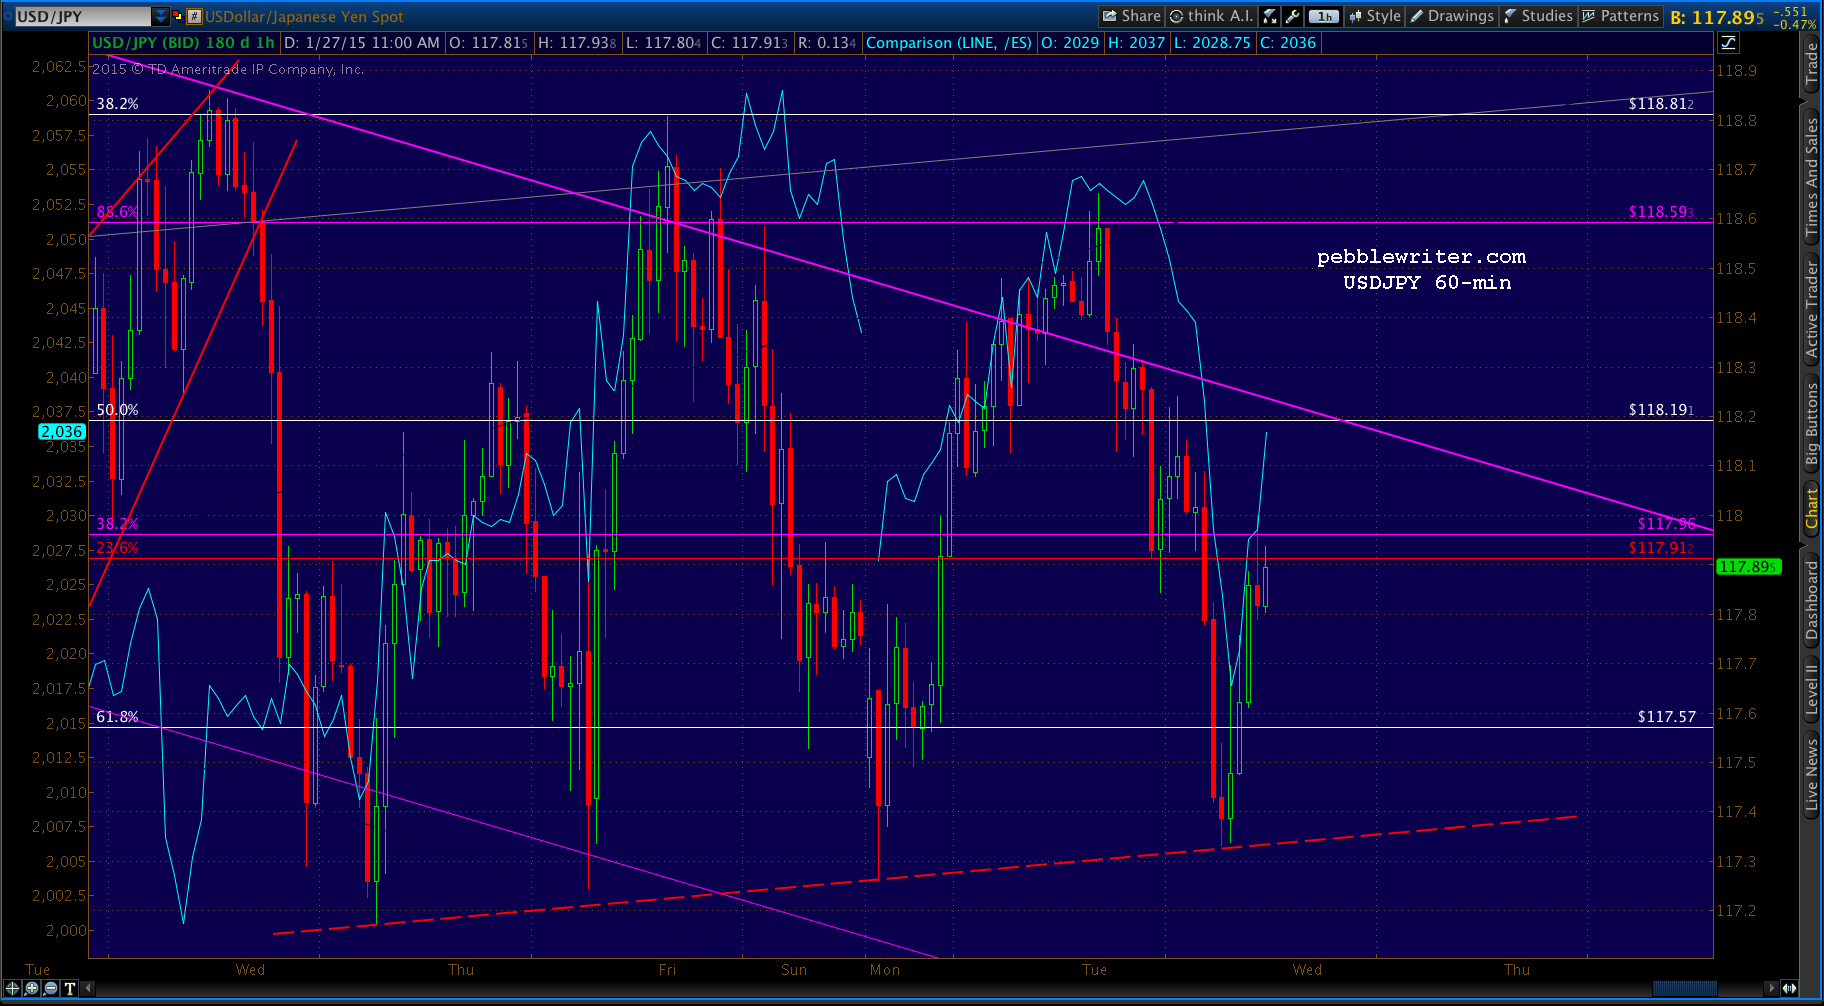 If SPX, instead, reverses here, then the SMA10 is back in the spotlight.
UPDATE: 3:40 PM
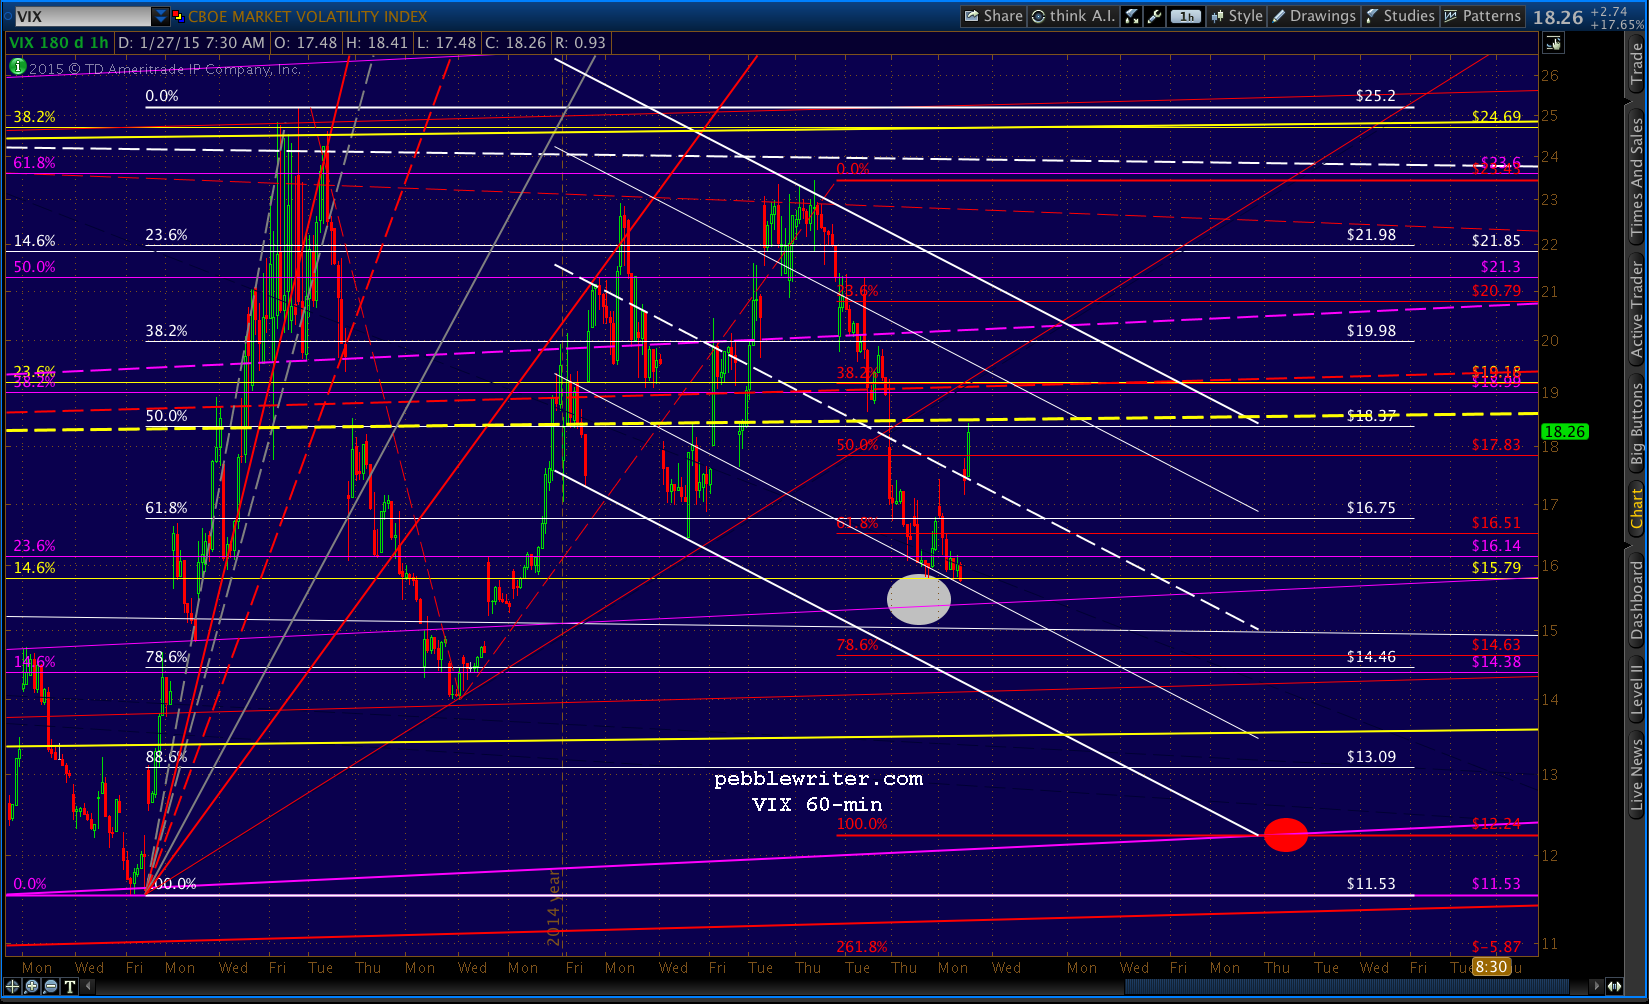
It reversed after all, and just tagged the SMA10 as discussed above. I think I’d call it a day here. It’s a positive close for such a negative day, and USDJPY has more upside.
 But, VIX looks to be heading higher.