Few financial assets engender as much debate as gold. Depending on whom you believe, gold is either about to double in price or drop by half. Many believe the price has been highly manipulated — an argument I wouldn’t even begin to dispute. Given the influence central banks and their proxies have exerted over other financial assets, I’d be shocked to learn that gold was, somehow, left out of the mix.
With that caveat, I still think it’s instructive to check in on the charts once in a while. If for no other reason, they can provide some hints as to the plans of The Powers That Be — assuming they have a plan and aren’t just winging it.
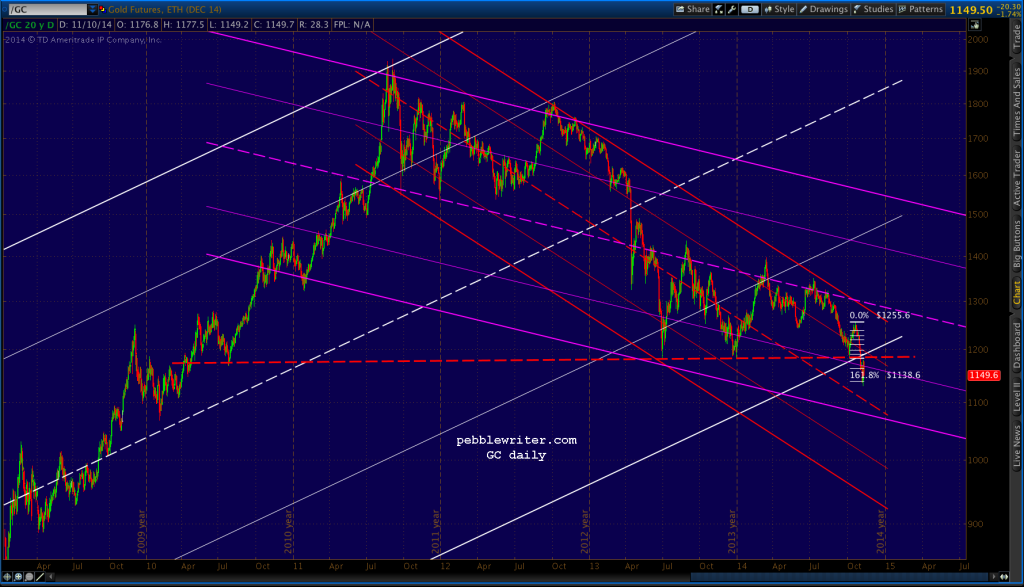
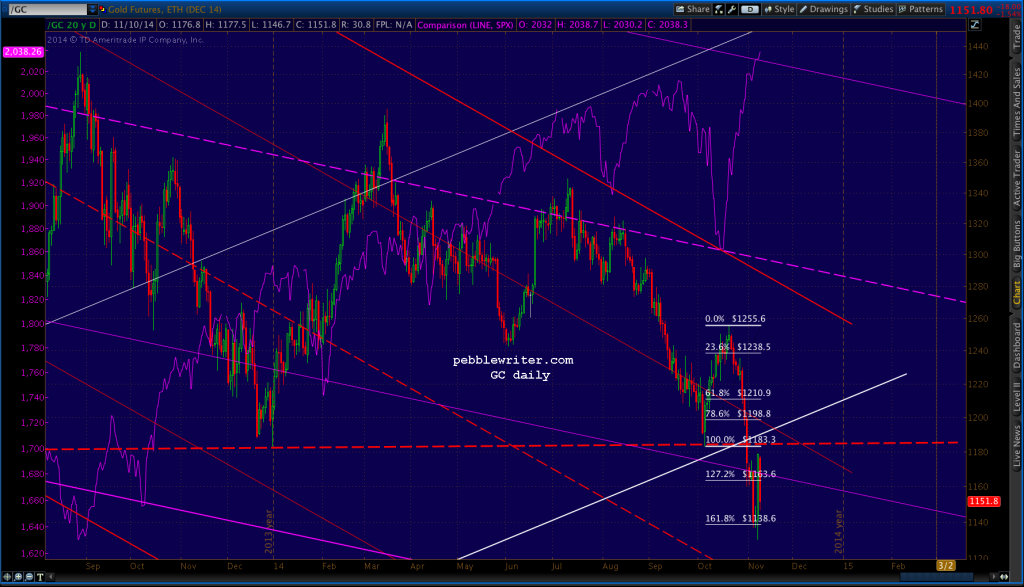
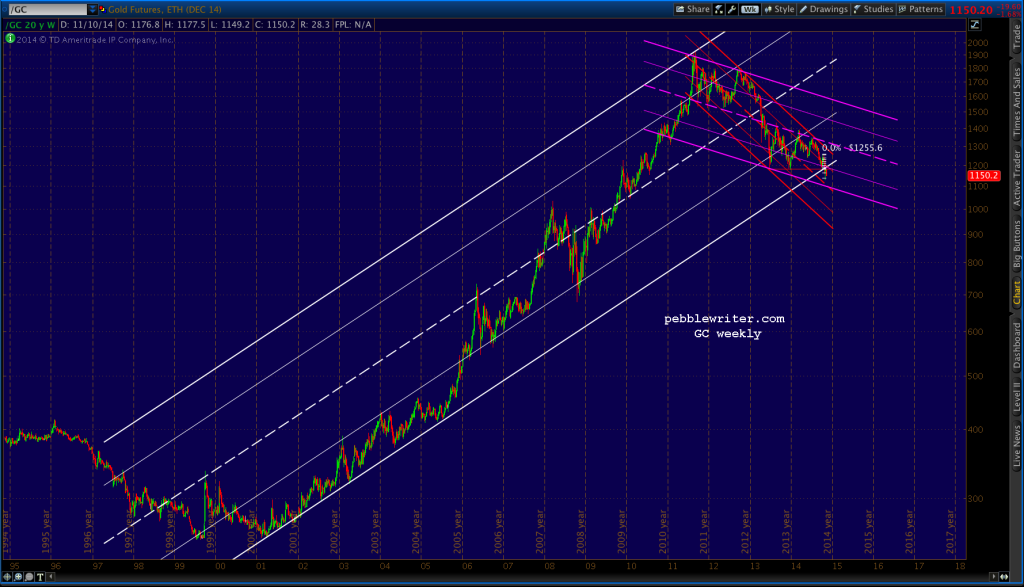
Those with a better memory than mine might remember we first talked in April 2013 [see: Apr 15, 2013 Update] about the 1155 target should the red channel bottom fail to hold. It didn’t. We went with the broader, alternate rising channel shown below in white and saw three pronounced bounces at horizontal support just above 1180 in June 2013, December 2013 and Oct 2014. That support finally broke down on Oct 31.
 GC dropped below the red, dashed trend line of support, and is currently in the process of backtesting it.
 As stocks have repeatedly demonstrated, losing important, long-term support isn’t necessarily the kiss of death. A timely aside by a Fed president can work wonders. But, ordinarily, a failure to retake the broken TL would indicate lower prices to come.
So, I was surprised to see that Merrill Lynch’s McNeil Curry just called a bottom on gold. Setting aside Curry’s arguments that the wave count, candle pattern and open interest are bulIish, I would readily admit that the extent of fiat creation supports the idea of a inflation-driven reversal — as does the long-term channel (I also like the idea of our 1155 Fib holding.)
Channels like this can tricky. A slight tilt one way or the other can make a world of difference in a chart that dates back 15+ years. In this case, I’ll give more credence to the upside if/when the red trend line of support (now resistance) is breached.
 Regarding inflation, the Fed’s all-you-can-eat approach to economic stability has spiked the money supply — but not velocity. Prevailing wisdom is that all that cash is going to banks and corporate coffers where it is bedding down for the long, cold winters to come.
If deflation is more of a threat than inflation at this point, the impetus for increasing prices would most likely be a rise in political/military conflicts, an inflationary shock (e.g. oil) or a financial development precipitating a flight to safety.
IMO, these risks are as significant as ever. Though, lately, stock prices have brushed them aside in a seemingly boundless central bank and algorithm-fueled melt-up. So, should we expect gold to be any more susceptible?
If TPTB meant gold prices to rebound from 1180 yet again, one would think they would have left the net in place at that level. Simply put, it’s a lot more work to overcome resistance than to observe support.
In addition, gold and equity prices have been negatively correlated lately. If stocks are to continue rising (as central bankers everywhere are clearly hoping inciting), we should expect continued weakness in gold. If for no other reason, they can point to it as justification for more inflation-stoking QE.
Bottom line: if you’re burying bullion in the back yard, you probably couldn’t care less about the day-to-day swings in the financial markets. But, if you’re a trader, keep an eye on that trend line around 1180 — gold’s line in the sand.
If 1155 holds and gold can push through 1180, then it has significant upside to 1300 or so — the .786 Fib and a TL off the highs dating back to May 2013. If not, the next real support doesn’t come in until 947.

